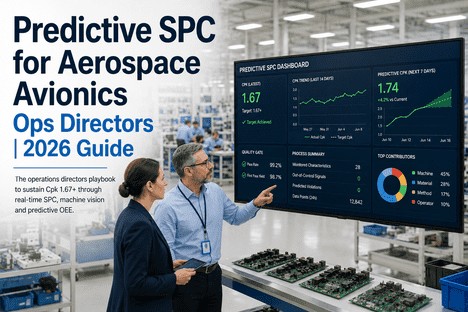
Predictive SPC for Aerospace Avionics Ops Directors | 2026 Guide
By Grace on June 16, 2026
Every operations director in aerospace avionics knows the three numbers that define their quality programme: the current Cpk of every critical characteristic on every IPC Class 3 product variant, the defect escape rate at the end of each production shift, and the false alarm rate of the inspection system that generates the first two numbers. The reality that most discover within the first quarter in the role is that achieving and sustaining Cpk 1.67 is not a process capability problem — it is a detection latency problem. Traditional SPC, with control limits calibrated during PPAP and reviewed at quarterly intervals, detects process drift only after the drift has already produced nonconforming boards. By the time the Western Electric rule fires, the defect population is already in the rework loop. Predictive SPC replaces this reactive sequence with a forward-looking intelligence layer that forecasts Cpk trajectory before the first nonconforming measurement appears. The operations director who deploys predictive SPC does not wait for the control chart to signal the past — they see where the process is heading and intervene before the capability index crosses the 1.67 threshold. This is the 2026 guide to making that transition.
Predictive SPC for Aerospace Avionics Ops Directors
Sustaining Cpk 1.67+ Across Every Product Variant, Every Shift, Every Material Lot — Without Waiting for the Control Chart to Tell You What Already Happened
iFactory's Predictive SPC platform gives operations directors ML-driven Cpk forecasting across every avionics assembly line — with adaptive control limits that transition automatically between product variants, multivariate drift detection that surfaces correlated patterns no univariate chart can see, and AS9100 audit documentation generated continuously from the predictions the system makes before defects form.
Cpk sustained on critical characteristics when predictive SPC replaces static quarterly-study limits with ML-driven adaptive boundaries — documented across 2025-2026 aerospace avionics deployments
94-98%
Defect prediction accuracy achieved by ML models trained on multivariate avionics production data — forecasting defect probability 4 to 24 hours before quality confirmation
10-50x
Faster drift detection with predictive SPC using EWMA and ML fusion models versus traditional Shewhart control charts on sampled measurement data
99%
Defect rate reduction when Cpk improves from 1.33 to 1.67 — the nonlinear relationship between incremental capability gains and exponential quality improvement
The Cpk Blind Spot: Why Static Limits Cannot Sustain Capability Through Product Variant and Material Changes
A typical aerospace avionics line produces 8 to 12 product variants per week, each with different component counts, solder profiles, and IPC Class 3 acceptance criteria. The SPC control limits were calculated during the last PPAP event — which for some product variants was 6 to 12 months ago. Every material lot change, every reflow profile adjustment for a new board thickness, every nozzle wear cycle on the placement head shifts the process distribution incrementally. No single shift is large enough to breach the static control limit. But across 40 product variant transitions and 15 material lot changes, the cumulative drift produces a process distribution that no longer resembles the PPAP baseline. The static control limits do not know this happened. They continue evaluating new production against a specification that no longer describes the current process. By the time the limit breaches, the defect population is already in the rework loop — and the operations director receives a Cpk report that explains what happened three shifts ago.
Traditional SPC vs Predictive SPC — The Five Differences That Determine Whether Cpk Sustains or Erodes
Dimension
Traditional SPC
Predictive SPC
Control limits
Static — set at PPAP, reviewed quarterly
Adaptive — recalculated continuously from live production data
Drift detection
Detects drift at limit breach — 35-75 nonconforming parts produced
Detects drift at half-sigma onset — alert fires 10-25 parts before breach
Cpk visibility
Calculated from batch samples — shift-end report
Calculated per board — live with forecasted trajectory
Product variant changes
Manual recalibration — 25-45 minutes of downtime
Automatic limit set transition — zero recalibration downtime
False alarm rate
15-25% during transitions — operators learn to ignore alerts
Under 5% — self-tuning limits distinguish regime changes from drifts
The Five Pillars of Predictive SPC for Sustained Cpk 1.67+
Predictive SPC is not a single capability — it is a coordinated system of five interdependent functions that together transform Cpk from a retrospective scorecard into a leading intervention trigger. Each pillar addresses a specific failure mode of traditional SPC, and all five operate simultaneously without requiring the operations director to manage individual components.
Pillar 01
Adaptive Control Limits
Control limits are recalculated after every board using a rolling statistical model of the current process baseline. When a new product variant is introduced or a material lot changes, the system distinguishes between a regime change that requires new limits and a process drift that requires intervention. Limits tighten when capability is high and widen when the process enters a transition window — without generating false alarms during either phase.
Continuous recalculation from live data stream
Pillar 02
ML-Driven Cpk Forecasting
An ensemble ML model — combining Random Forest, XGBoost, and LSTM architectures — analyses the multivariate parameter pattern for every board and projects Cpk at four horizons: board-level, hour-ahead, shift-ahead, and day-ahead. The projection incorporates current drift rate, scheduled product variant changes, and material batch transition plans. The operations director sees the forecasted Cpk alongside the current value, with confidence intervals for each horizon.
Four-horizon Cpk projection with confidence intervals
Pillar 03
Multivariate Drift Detection
Traditional SPC monitors each parameter on its own control chart. A 0.3 mm increase in solder paste height combined with a 2-degree reflow temperature drift may both stay within individual limits, but the correlated pattern signals a stencil condition or profile issue. Predictive SPC monitors the covariance structure across all parameters simultaneously, detecting multivariate drift patterns at the point of emergence — not after an individual variable breaches its univariate limit 50 boards later.
Cross-parameter covariance monitoring across all variables
Pillar 04
Automated Root Cause Attribution
When a Cpk trend declines or a predictive alert fires, the system automatically identifies the primary parameter driver from the multivariate model. The root cause is presented at alert time — not after a manual investigation that consumes 2 to 6 hours per event. The operations director sees a ranked list of contributing parameters with confidence scores, enabling immediate corrective action without waiting for the quality engineer to complete a root cause analysis.
Ranked root cause presented at alert time — no manual investigation required
Pillar 05
AS9100 Audit Automation
Every Cpk calculation, every limit recalibration, every predictive alert, and every corrective action is logged automatically with the process context data in use at the time — product variant, material lot ID, reflow profile version, and operator shift. The adaptive limit change log records every recalculation with the statistical rationale. Audit documentation for any date range, product variant, or assembly line exports in under one minute.
Complete audit trail generated automatically from every prediction and action
Adaptive Limits · ML Forecasting · Multivariate Detection · Root Cause · Audit Trail
The Five Pillars Work as One System. The Operations Director Sees One Number: Cpk Sustained Above 1.67 Across Every Product Variant and Every Shift.
iFactory integrates all five predictive SPC pillars into a single quality intelligence platform — so the operations director manages capability, not individual control chart parameters.
The Deployment Roadmap: From Static Limits to Predictive Cpk in 12 Weeks
The transition from traditional static SPC to predictive SCP follows a structured three-phase pathway that achieves measurable Cpk improvement at each stage without disrupting production. Each phase builds on the data and configuration from the previous one, and the operations director validates the output before promoting each capability to production use.
Phase
What Happens
Cpk Outcome
Weeks 1-4 Shadow Mode
Predictive SPC deployed in parallel with existing quality programme. ML model trains on 12-24 months of historical process-to-quality data. Forecasts generated but not used for decisions. Accuracy validated against actual AOI, ICT, and functional test outcomes. Operations director reviews weekly accuracy reports.
Baseline Cpk established. Forecast accuracy validated at 94%+ before Phase 2.
Weeks 5-8 Adaptive Limits Live
Adaptive control limits activated on all active parameters. Static limits retired. Product variant transition limits configured for the full product portfolio. Western Electric rules evaluated continuously on adaptive limits. Operations director dashboard shows live Cpk with forecasted trajectory.
Cpk stabilises across transitions. False alarm rate drops from 15-25% to under 5%.
Weeks 9-12 Full Predictive Mode
ML-driven Cpk forecasting promoted to primary dashboard display. Predictive alerts with ranked root cause attribution enabled. Automated prevention workflows configured. AS9100 audit documentation generation activated. Full Cpk sustainability achieved across product portfolio.
Cpk 1.67+ sustained across all critical characteristics. 30-50% scrap reduction documented.
The Operations Director's Predictive SPC Dashboard: Three Views That Replace a Dozen Reports
The dashboard is designed around the three questions that determine whether Cpk sustains or erodes across the operations director's portfolio: What is the current Cpk status across all lines and product variants? Where is capability trending and which parameters are driving the trend? And when the AS9100 auditor asks for Cpk evidence, is the documentation current and complete?
Dashboard View 01
Cpk Status Board — Current and Forecast by Line and Product Variant
Every active line and product variant displayed with current Cpk, 8-hour trend direction, and forecasted Cpk at the shift-ahead horizon. Parameters at or above 1.67 are shown in green. Parameters trending toward 1.67 are flagged with the primary driver and the projected time to breach. The operations director sees plant-wide Cpk status in one view without opening a single control chart.
Operations action: Lines with declining Cpk trend receive immediate drill-down before the 1.67 threshold is breached.
Dashboard View 02
Predictive Alert Feed — Ranked by Severity With Root Cause Attribution
Every predictive alert includes the forecasted Cpk trend, the primary parameter driver identified by the multivariate ML model, the recommended corrective action, and the confidence score of the root cause attribution. Alerts are ranked by severity — Cpk trending toward 1.67 triggers a dashboard alert, toward 1.33 triggers a corrective action workflow, and below 1.00 escalates automatically to production hold authority.
Operations action: Ranked alerts with root cause drive targeted intervention — no manual investigation required.
Dashboard View 03
Audit Record — AS9100 Cpk Documentation in One Click
Every piece of AS9100 and AS9103 documentation required for Cpk compliance — continuous Cpk history by product variant and characteristic, adaptive limit change log with statistical rationale for every recalibration, predictive alert log with forecast accuracy verification, and CAPA effectiveness tracking linked to Cpk trend data — is generated automatically and exportable for any date range, product variant, or assembly line. Audit preparation drops from days of manual data compilation to a single export.
Operations action: Export complete AS9100 Cpk audit package on demand. Current and complete at every shift.
We had been sustaining Cpk around 1.45 on our critical solder paste height characteristic for 18 months. Every quarterly review showed the same number. Every static control limit said we were in control. What we did not see was that the process distribution had shifted incrementally across 40 product variant changes and 22 material lot transitions — each shift too small for the static limits to flag, but cumulatively large enough to move us 0.22 below the 1.67 target. The quarterly Cpk report was measuring a capability that had not existed for months. Predictive SPC identified the drift pattern in the first week of shadow mode deployment — and within 30 days of adaptive limits going live, we had moved Cpk from 1.45 to 1.72. The difference was not a process change. It was a detection architecture change. We were finally seeing where the process was heading instead of where it had been.
Cpk sustainability in aerospace avionics is not a process capability problem — it is a detection architecture problem. When control limits are calibrated on data that is 6 to 12 months old, when product variant transitions require 25 to 45 minutes of manual recalibration, when univariate charts miss the multivariate drift patterns that signal emerging defect populations, and when Cpk arrives as a shift-end report that describes a process state that no longer exists, the operations director is managing capability with tools designed for a manufacturing era when data arrived in spreadsheets and analysis happened offline. Predictive SPC replaces every element of this architecture simultaneously: adaptive limits that transition automatically between every product variant and material lot, ML-driven Cpk forecasting that projects capability forward at four horizons, multivariate drift detection that surfaces correlated patterns invisible to univariate charts, automated root cause attribution that eliminates the 2-to-6-hour investigation cycle, and AS9100 audit documentation that exports in under one minute.
The 2026 industry evidence across aerospace electronics and avionics deployments is definitive. Plants deploying predictive SPC with ML-driven Cpk forecasting sustain capability above 1.67 on critical characteristics, achieve 94 to 98 percent defect prediction accuracy at the shift-ahead horizon, detect process drift 10 to 50 times faster than traditional Shewhart control charts, and reduce false alarm rates from 15 to 25 percent down to under 5 percent. The nonlinear relationship between Cpk improvement and defect reduction means that moving from 1.33 to 1.67 represents a 99 percent reduction in defect rate — a capability gain that no static limit system can deliver because static limits cannot detect the drift that erodes Cpk between quarterly studies. The operations directors achieving and sustaining the upper end of these outcomes are the ones who deployed adaptive limits early, configured multivariate ML models trained on their product portfolio, and used the Cpk status board to convert predictive alerts into process interventions before the first nonconforming board was produced.
iFactory's Predictive SPC platform is designed for operations directors in aerospace avionics who need to sustain Cpk 1.67+ across every product variant, material lot, and shift — without waiting for the control chart to tell them what already happened. Book a Demo to see the Predictive SPC dashboard configured for your avionics product portfolio and assembly line configuration, or talk to an expert about a free Cpk sustainability assessment for your aerospace avionics quality programme.
Frequently Asked Questions
Adaptive SPC and predictive SPC serve complementary but distinct functions. Adaptive SPC recalculates control limits dynamically against the current process baseline, ensuring that limits reflect current conditions rather than historical PPAP values. Predictive SPC builds on this foundation by adding an ML-powered trend projection layer: it analyses the directional drift rate across all monitored parameters, projects the trajectory forward at multiple horizons, and fires a predictive alert when the data indicates a control limit breach is likely within the next 10 to 25 boards. The distinction is timing — adaptive SPC tells you where the limit is right now; predictive SPC tells you when you will cross it unless you intervene. iFactory's platform includes both capabilities running simultaneously: adaptive limits maintain current baseline accuracy, and the predictive engine provides the forward-looking alert that converts SPC from a reactive to a proactive quality tool. Talk to an expert about deploying both layers together in your facility.
The ML ensemble model initialises using historical data from the process historian and inspection systems — AOI, X-ray, ICT, and functional test results — paired with the process parameters active at the time of each measurement. A minimum of 6 months of paired process-to-quality data is sufficient to build an initial model with 90 percent-plus forecast accuracy at the shift horizon. Twelve to 18 months of data covering multiple product variant transitions and material lot changes improves accuracy during transitions to 94 to 98 percent. The model deploys in shadow mode first — generating forecasts alongside the existing quality programme without driving decisions — allowing the quality team to validate accuracy against actual inspection outcomes before relying on predictions for corrective actions. Shadow mode typically runs for 2 to 4 weeks and provides the documented accuracy data needed to transition to full predictive mode. Book a Demo to see accuracy validation data from comparable avionics deployments.
Yes. iFactory's product architecture registers each avionics product variant as a separate specification profile with its own Cpk targets, tolerance bands, IPC Class 3 acceptance criteria, and adaptive limit baselines. When the line transitions between variants — for example, from a flight control computer to a radar processing module to a power distribution unit — the active profile switches automatically, the adaptive limits transition to the new variant's baseline without operator intervention, and the ML model applies the variant-specific historical pattern library to forecast Cpk for the new variant. The operations director's dashboard shows Cpk status segmented by variant, enabling comparison across the product portfolio. Historical data is maintained per variant, so trend analysis reflects the actual capability trajectory for each product family. Talk to an expert about configuring multi-variant predictive SPC for your avionics product portfolio.
Predictive SPC connects to existing inspection and test equipment through standard industrial interfaces and data connectors — no replacement of capital equipment required. The platform ingests measurement data from AOI, X-ray inspection, in-circuit testers, and functional test benches via REST APIs, database connectors, or file-based data exchange, depending on the existing equipment's connectivity capability. The ML model trains on the combined data stream from all inspection sources, and the adaptive control limits and Cpk forecasts are calculated from the same data the existing systems already produce. The inspection equipment continues to operate exactly as programmed — the predictive SPC platform adds the ML-driven analysis layer on top of the existing data flow. Integration of the first product line typically requires 2 to 4 weeks, with additional lines deploying faster as the connector templates are already configured. Book a Demo to see the integration architecture configured for your existing equipment set.
Cpk 1.67 Is the Target. Predictive SPC Makes It Sustainable. Get a Free Cpk Sustainability Assessment for Your Avionics Line.
iFactory's Predictive SPC platform for aerospace avionics operations directors — adaptive control limits that transition with every product variant, ML-driven Cpk forecasting at four horizons, multivariate drift detection across all parameters simultaneously, automated root cause attribution at alert time, and AS9100 audit documentation generated automatically from every prediction the system makes before defects form.