AI Vision QC for Aerospace Heat Treatment – Predictive Maintenance
By Grace on June 16, 2026
A quality engineer in aerospace heat treatment operates at the intersection of two realities that rarely align. The first reality is the furnace control system — a precisely logged sequence of ramp rates, soak temperatures, quench pressures, and cycle times that, on paper, satisfies every AMS 2750 requirement and NADCAP checklist item. The second reality is what happens inside the furnace that the control system does not measure: the heating element that has degraded unevenly across its service life, the load thermocouple that drifted 8 degrees since the last SAT, the quench flow shadow that leaves parts in position B7 cooling 15 degrees per minute slower than the probe records. Between these two realities, unplanned downtime events and quality escapes accumulate at an estimated cost of $520,000 per year per facility in maintenance, scrap, and rework alone. AI vision inspection closes this gap by giving quality engineers a continuous visual and thermal intelligence layer that sees what the control system cannot.
AI VISION INSPECTION · WESTERN ELECTRIC RULES · PREDICTIVE FURNACE MAINTENANCE · AS9100 TRACEABILITY
Quality Engineers Using AI Vision to Monitor Furnace Conditions, Detect Surface Defects, and Predict Maintenance Needs Are Cutting Unplanned Downtime by 40% While Reducing Scrap by 35%.
iFactory's AI Vision QC platform gives quality engineers continuous thermal and optical surveillance of every furnace cycle, surface inspection at production speed, and predictive maintenance alerts that trigger before the fault causes downtime — with all 8 Western Electric rules running in real time against every monitored parameter.
The Unplanned Downtime and Quality Escape Problem in Aerospace Heat Treatment
Aerospace heat treatment furnaces operate as part of a special process under AS9100 Rev D Clause 8.5.1.2 precisely because the relationship between process conditions and product quality cannot be fully verified by end-of-cycle inspection. The quality engineer depends on control charts, pyrometry records, and periodic TUS reports to infer that every part in the load met its metallurgical requirements. However, the furnace itself is a dynamic system whose components degrade between maintenance intervals, and the cost of discovering that degradation through a quality escape rather than through predictive detection is measured in tens of thousands of dollars per event and hundreds of thousands per year across a typical facility.
$520K
Average annual cost of unplanned downtime, scrap, and rework per aerospace heat treatment facility from furnace-related failures alone
40%+
Unplanned downtime reduction documented when AI vision and predictive maintenance systems replace calendar-based furnace servicing
35%
Scrap reduction achieved within 90 days of deploying AI quality integration across aerospace heat treatment and machining operations
97%
Accuracy achieved by AI-driven furnace current monitoring systems for detecting anomalies before they cause unplanned shutdowns
Three Root Causes of Furnace Downtime and Quality Escapes That Static SPC Cannot Detect
The quality engineer reviewing last week's control charts sees data that satisfies the compliance requirement but does not reflect the actual condition of the furnace or the parts inside it. Standard SPC, applied to process parameters recorded at the furnace level, misses three categories of developing failure that AI vision inspection and real-time SPC with Western Electric rules are uniquely positioned to catch.
FAILURE MODE 01
Heating Element and Thermocouple Degradation
Heating elements degrade asymmetrically — the elements near the door cycle more frequently and accumulate more thermal fatigue than elements at the back of the furnace. The control thermocouple reports a zone temperature that is within spec, but the actual thermal distribution across the load has shifted. The quality engineer sees stable control charts while parts in the cold zone experience incomplete austenitization. AI vision with thermal imaging detects the developing temperature gradient pattern weeks before a TUS would formally identify it. Real-time SPC applying Western Electric Rule 2 (two of three consecutive points beyond 2-sigma) flags the element current signature drift as a developing assignable cause.
AI Vision QC fix: Continuous thermal imaging detects element degradation gradient 4-6 weeks before TUS identifies it. Western Electric Rule 2 flags current drift.
FAILURE MODE 02
Refractory Lining Erosion and Hot Spot Formation
Refractory linings erode over time through thermal cycling, mechanical abrasion from load handling, and chemical attack from atmosphere contaminants. A hot spot on the furnace shell that is 30 degrees above baseline indicates lining thickness reduction that will eventually breach the insulation and create a thermal uniformity excursion. Traditional maintenance catches this during annual refractory inspections. By then, the hot spot has been developing for 60 to 180 days and has already caused measurable energy efficiency loss and marginal quality degradation in loads processed in that zone. AI vision with continuous thermal surveillance detects hot spots at formation and tracks growth rate, enabling condition-based refractory replacement scheduling.
AI Vision QC fix: Thermal surveillance detects hot spots 60-180 days before breach. Growth rate tracking enables planned outage scheduling.
FAILURE MODE 03
Quench System Performance Drift
Quench systems degrade progressively — polymer quenchants lose cooling efficacy as they accumulate thermal degradation products, oil quenchants change viscosity with age, quench agitators lose flow rate as impellers wear, and heat exchanger fouling raises quenchant temperature across a shift. The degradation is slow enough that no single batch triggers an alarm, but the cumulative Cpk shift from 1.67 to 1.1 over 90 days represents a 34% reduction in process capability that the quality engineer discovers only when a hardness test fails. AI vision monitoring of quenchant clarity, flow visualization, and cooling curve analysis detects the drift trajectory and applies Western Electric Rule 4 (eight consecutive points on one side of center line) to trigger a predictive quench media change alert before any part fails.
AI Vision QC fix: Cooling curve trend analysis with Western Electric Rule 4 triggers predictive media change 30-60 days before quality deviation.
STATIC SPC WITH CALENDAR-BASED PM
Discovers degradation after quality escape. Furnace runs until thermocouple fails SAT or part fails hardness test. Unplanned downtime averages 8-24 hours per event at $8,000-$22,000 per hour of lost production.
AI VISION QC WITH REAL-TIME WESTERN ELECTRIC RULES
Detects degradation trajectory 30-180 days before failure. Maintenance scheduled during planned outages. Zero unplanned downtime from detected failure modes. Quality escapes prevented before they occur.
How AI Vision QC and Real-Time SPC Work Together in the Furnace Environment
The iFactory AI Vision QC platform for aerospace heat treatment operates as an integrated four-layer system that connects what the furnace control system records with what the AI vision system sees and what the real-time SPC engine detects. Each layer feeds the next, creating a closed-loop quality and maintenance intelligence layer that operates continuously across every cycle, every shift, and every furnace.
LAYER 01
Visual and Thermal Surveillance
Continuous optical and IR monitoring of every furnace zone
Industrial-grade thermal and optical cameras installed at furnace viewing ports and shell exterior positions provide continuous 24/7 surveillance of heating elements, refractory surfaces, load positioning, and quench system operation. The vision system operates in real time, capturing thermal data at every frame and feeding it to the AI inference engine without requiring operator intervention. Each camera stream is processed at the edge using GPU inference, with thermal anomaly detection latency under 50 milliseconds — fast enough to catch transient events like a quench flame flare or a load shift that exposes parts to direct radiant heating.
Element condition monitoring
Hot spot detection
Load position verification
LAYER 02
AI Defect Detection and Classification
Deep learning models trained on aerospace defect patterns
The AI inference engine runs YOLO-based and CNN-based deep learning models trained on aerospace-specific defect datasets — surface cracks, porosity, thermal barrier coating spallation, oxidation discoloration, quench cracking, and distortion indicators. Models achieve detection precision of 89-94% on production data with false positive rates below 2%. Defect classification includes severity grading: critical defects trigger immediate containment actions, marginal defects are logged for trend monitoring, and acceptable surface conditions are recorded for the quality record. Every detection is timestamped and linked to the furnace cycle, load number, part serial number, and position in the load.
Crack and porosity detection
Coating spallation identification
Distortion and quench crack classification
LAYER 03
Real-Time SPC Engine With Western Electric Rules
All 8 rules evaluated simultaneously on every parameter every second
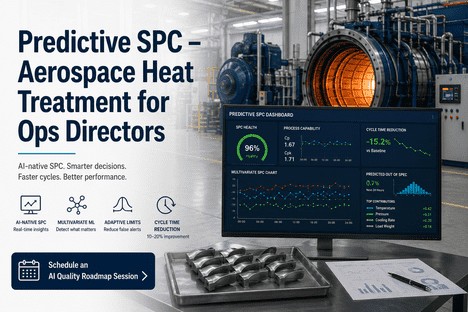
The SPC engine ingests all vision-detected defect rates, thermal gradient measurements, element current signatures, and quench cooling curve data as control chart parameters. All 8 Western Electric rules run continuously on every parameter in real time: Rule 1 catches single-point excursions beyond 3-sigma for immediate stop-production events. Rule 2 and Rule 3 detect developing trends in defect rates and thermal gradients 2-4 weeks before they breach specification limits. Rule 4 identifies systematic bias shifts from media degradation or sensor drift. Rules 5-8 capture stratification, mixture, and trend patterns that manual weekly SPC reviews routinely miss. Cp, Cpk, Pp, and Ppk are recalculated per measurement and displayed as live values, not weekly snapshots.
Live Cp/Cpk per parameter
All 8 rules every second
Auto-CAPA initiation
LAYER 04
Root-Cause ML Correlation
Connects defect patterns to process parameters automatically
The root-cause ML layer correlates vision-detected defect patterns with the process parameter state at the time each part was processed — furnace zone temperatures, ramp rates, soak duration, quench cooling curve, quench media batch, load position, and previous maintenance events. When the ML model identifies a statistically significant correlation between a specific parameter combination and an elevated defect rate, it generates a root-cause hypothesis with a confidence score and supporting evidence. A quality engineer who sees that 73% of quench crack defects are associated with loads processed within 48 hours of a quench media top-up has a specific, actionable hypothesis that drives a process change — not a generic corrective action requesting operators to inspect parts more carefully.
"Our weekly SPC reviews were showing stable control charts while heating elements were silently degrading and our quench Cpk was dropping from 1.67 to 1.1 over three months. The AI vision system detected the element current signature drift and the quench trend in week two. We scheduled both interventions during planned maintenance. Zero unplanned downtime. Zero quality escapes from those failure modes."
What the Quality Engineer's Dashboard Shows in Real Time
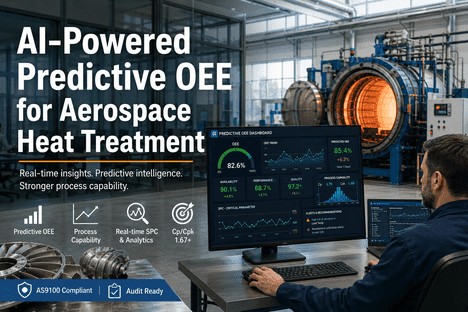
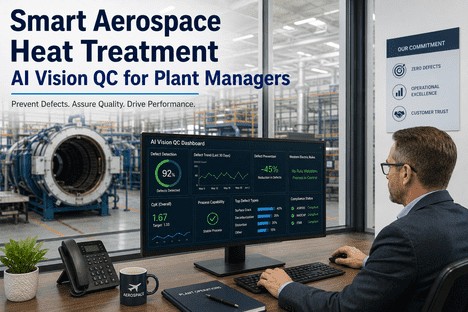
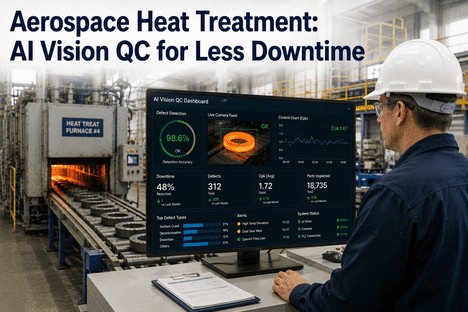
The quality engineer view of the AI Vision QC platform is designed around the questions that quality engineers need to answer continuously: is the furnace developing any condition that will produce a nonconformance, are the control charts showing signals that warrant investigation, what is the current defect rate by furnace and alloy, and is the Cpk trend moving toward or away from the 1.67 target for critical characteristics.
DASHBOARD 01
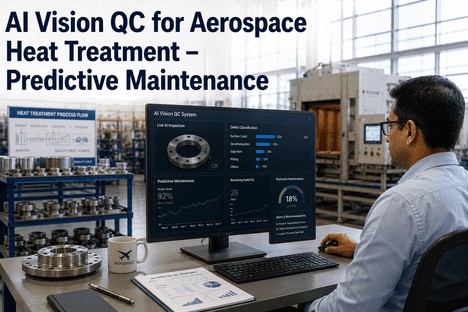
Furnace Health Score With Predictive Alerts
Every furnace receives a live health score calculated from thermal gradient uniformity, element current signature trends, refractory hot spot growth rate, quench system Cpk, and thermocouple drift rate. Scores above 80 indicate normal operation. Scores between 60 and 80 trigger a maintenance planning alert with the specific degrading component identified. Scores below 60 generate an immediate review alert with estimated remaining useful life. The health score trend line shows whether the furnace is improving, stable, or declining across the last 90 days.
Quality engineer action: Schedule maintenance for components trending below 60 before they cause unplanned downtime.
DASHBOARD 02
Live Western Electric Rules Violation Log
Every Western Electric rule violation across all monitored parameters is displayed in a live log with the rule number, the violating parameter, the current value, the context (furnace, cycle, load), and the severity classification. Rule 1 violations (beyond 3-sigma) are highlighted as critical with automatic CAPA initiation. Rule 2, 3, and 4 violations generate trending alerts that the quality engineer reviews and dispositions. Rules 5-8 violations are logged for pattern analysis and escalated if they persist across multiple cycles. The log is filterable by furnace, parameter category, alloy, and time period.
Surface Defect Pareto by Furnace, Alloy, and Recipe
Every defect detected by the AI vision system is classified by type — crack, porosity, spallation, oxidation, distortion — and logged against the furnace, alloy, recipe, and load position. The Pareto view ranks defect categories by frequency and severity across any date range and filter combination. A quality engineer who sees that 62% of oxidation discoloration defects occur on vacuum furnaces processing 17-4PH within 72 hours of a diffusion pump regeneration has a specific process correlation that drives a SOP change rather than operator-level corrective action.
Quality engineer action: Pareto correlations escalate to process engineering for recipe or procedure updates.
DASHBOARD 04
Root-Cause ML Correlation Engine Results
The ML correlation results view displays statistically significant associations between process parameter combinations and defect outcomes. Each correlation is displayed with the parameter combination, the defect type, the confidence score, the odds ratio, the number of supporting events, and the date range of the analyzed data. The quality engineer reviews each correlation, accepts or rejects the hypothesis, and if accepted, the system automatically generates a CAPA record linking the root cause to the specific process parameter that needs adjustment.
Quality engineer action: Accept valid correlations to auto-generate CAPA with root cause and parameter adjustment recommendation.
The Rolls-Royce SPC methodology, documented in their published guide for aerospace precision manufacturing, identifies four Western Electric rules as mandatory for safety-critical component monitoring and extends to all eight rules for special processes including heat treatment. Their framework requires that Cpk below 1.67 triggers 100% inspection, engineering review, and senior management approval for critical aerospace characteristics. iFactory's AI Vision QC platform implements this methodology automatically — all 8 Western Electric rules evaluated every second, Cpk recalculated per measurement, and violations linked directly to CAPA records without requiring the quality engineer to export data, stage charts, or write reports.
— Rolls-Royce SPC Methodology for Aerospace Heat Treatment, Implemented in iFactory AI Vision QC Platform
Deployment Path for Quality Engineers: From Pilot to Plant-Wide Coverage
The iFactory AI Vision QC platform deploys in three phases designed to deliver measurable ROI within the first 90 days while building toward full plant-wide coverage across all furnace types, alloy families, and quality characteristics.
1
Pilot Phase — Days 1 to 30
One high-value vacuum or atmosphere furnace equipped with thermal and optical cameras connected to the AI inference engine and real-time SPC platform. The quality engineer configures Western Electric rule thresholds per parameter, validates vision defect detection accuracy against current inspection results, and establishes baseline Cpk values for all monitored characteristics. Phase 1 delivers the first predictive maintenance alert and the first real-time control chart within the first week.
Deliverable: Pilot furnace under AI Vision QC with validated detection accuracy and live SPC.
2
Expansion Phase — Days 31 to 90
Additional furnaces connected to the platform — atmosphere, vacuum, salt bath, and solution treat lines. The root-cause ML model receives cross-furnace data and begins generating statistically significant parameter-defect correlations. The quality engineer validates the first ML-generated root-cause hypothesis against actual investigation outcomes. Cpk trend reports by furnace and alloy become available as live dashboards.
Deliverable: Multi-furnace coverage with ML-generated root-cause hypotheses validated and active.
3
Integration Phase — Days 91 to 180
Full integration with the quality management system, CMMS, and ERP. AI vision defect data flows directly into the QMS as inspection records. Real-time SPC alerts generate CAPA records automatically with root-cause linkage. Predictive maintenance alerts generate work orders in the CMMS with recommended intervention windows. Audit documentation is generated automatically for NADCAP and AS9100 compliance, covering every cycle across every connected furnace.
Deliverable: Plant-wide AI Vision QC with full QMS/CMMS integration and automated audit documentation.
Conclusion
Heat treatment quality escapes and unplanned furnace downtime are not separate problems. They are the same underlying problem expressed in two different forms — the quality engineer lacks real-time visibility into the actual condition of the furnace and the parts inside it. The control system logs temperatures that are within specification. The TUS was passed three months ago. The control charts show stable operation. But the heating element is degrading, the quench media is approaching end of life, and a part in position C7 is cooling 12 degrees per minute slower than the specification requires. The quality engineer discovers this either through a predictive alert or through a non-conformance report. The platform determines which one arrives first.
AI Vision QC addresses all four dimensions simultaneously: continuous thermal and optical surveillance that sees what the control system cannot, deep learning defect detection that classifies surface anomalies at production speed with 89-94% precision, a real-time SPC engine that evaluates all 8 Western Electric rules on every parameter every second, and a root-cause ML layer that correlates defect patterns with process parameters to generate actionable hypotheses. The documented outcomes across aerospace deployments are consistent: 40% or greater reduction in unplanned downtime, 35% scrap reduction within 90 days, and annual cost recovery exceeding $500,000 per facility from prevented failures, reduced scrap, and eliminated manual documentation labor.
For the quality engineer managing vacuum furnace, atmosphere, and salt bath operations under AS9100 and NADCAP quality systems, the question is no longer whether AI vision and real-time SPC can integrate into an aerospace heat treatment environment. The question is whether the current gap between what the control system records and what actually happens inside the furnace is an acceptable risk for flight-critical components. iFactory's AI Vision QC platform is designed for quality engineers who need to close that gap with continuous visual intelligence, predictive maintenance alerts, and audit-ready evidence — not as a future capability, but as a production-deployed system operating in aerospace facilities today. Book a Demo to see the AI Vision QC system configured for your furnace types and alloy portfolio, or talk to an expert about a free predictive maintenance assessment for your heat treatment operations.
Frequently Asked Questions
AI vision detects three categories of defects that control-system-level SPC inherently misses. First, thermal gradient asymmetries across the furnace zone that develop between TUS intervals — the control thermocouple reports a stable temperature while the actual thermal distribution shifts due to element degradation, load-induced convection changes, or refractory wear. Second, surface-level part defects that occur during processing — quench cracking, oxidation discoloration, distortion, thermal barrier coating spallation — which are visible on the part surface after the cycle but are not correlated with any single logged process parameter because they result from the interaction of multiple variables at the part-position level. Third, developing equipment health conditions — heating element current signature drift, refractory hot spot growth, quench media clarity degradation — that follow a slow trajectory invisible to threshold-based alarms but clearly visible to AI trend analysis applying Western Electric Rules 2, 3, and 4. The common thread across all three categories is that conventional SPC monitors what the furnace reports. AI vision monitors what the furnace actually does. Book a Demo to see comparative detection data from production furnace deployments.
The Rolls-Royce SPC methodology for aerospace manufacturing specifies that all 8 Western Electric rules apply to special processes including heat treatment, with Rule 1 (one point beyond 3-sigma) classified as a stop-production event requiring immediate investigation before the next cycle. iFactory's SPC engine implements this with configurable thresholds per parameter category. For soak time and zone uniformity parameters, Rule 1 triggers an alert within 2 seconds and blocks the furnace from starting the next cycle until the quality engineer dispositions the violation. For quench cooling rate Cpk, Rule 2 and Rule 4 are configured as trending alerts that give the quality engineer 30-60 days of lead time before the media change is required. For vision-detected defect rates, Rule 3 and Rule 8 capture the gradual increase in surface anomaly frequency that indicates a developing process problem. The engine applies separate sigma calculations per parameter, per furnace, and per alloy-family combination, so a Rule 2 violation on quench Cpk for 300M steel triggers a different response threshold than the same rule on the same parameter for aluminum alloy processing. Talk to an expert about configuring Western Electric rule thresholds for your alloy portfolio.
The system is designed for non-invasive installation on existing furnace hardware without requiring furnace modification or new viewing ports. Thermal cameras mount externally on existing view port windows, sight glass assemblies, or furnace shell exterior surfaces for shell temperature monitoring. Optical cameras for load position verification and part surface inspection mount at existing observation ports or on dedicated brackets that do not penetrate the furnace envelope. For furnaces without view ports, exterior shell thermal monitoring provides the predictive maintenance data for element degradation, refractory hot spot detection, and thermocouple drift — the highest-value failure modes — without requiring any furnace modification. The installation process for the first pilot furnace typically requires less than one shift and does not interrupt production. Book a Demo to see furnace camera installation configurations for your specific furnace types.
The ML model begins generating initial correlations after approximately 30 days of data collection from a single furnace, correlating vision-detected defect rates with logged process parameters — zone temperatures, ramp rates, soak duration, quench cooling curves, and load position data. After 90 days of multi-furnace operation, the model has sufficient cross-furnace data to produce statistically significant correlations with confidence scores above 90%. The correlation engine uses a combination of multivariate regression and random forest analysis, with each correlation validated against the historical baseline. The quality engineer sees not just the correlation but the supporting data — event count, odds ratio, confidence interval, and the time period of the analyzed data. For facilities with existing historical data in the process historian and LIMS, the model can back-load 12-24 months of data to generate correlations within the first week of deployment rather than waiting for 90 days of new data accumulation. Talk to an expert about the historical data requirements for accelerating ML model deployment at your facility.
The Furnace Control System Logs What Happens. AI Vision Sees What Actually Happens. Close the Gap Before the Next Quality Escape. Get a Free Predictive Maintenance Assessment.
iFactory's AI Vision QC platform for aerospace heat treatment quality engineers — continuous thermal and optical surveillance, deep learning defect detection at production speed, all 8 Western Electric rules running in real time on every parameter, and root-cause ML that correlates defect patterns with process parameters to generate actionable hypotheses before the next non-conformance report.