Biogas plants are paid for what they produce — yet most operate without knowing what they will produce in 24 hours, which substrate delivered the most methane per tonne last week, or how their specific yield compares to what their plant configuration is capable of. A plant running at 270 m³/tonne VS when its feedstock mix is capable of 320 m³/tonne is leaving 18% of its revenue potential on the table — silently every day. iFactory's yield prediction and analytics platform closes this gap: tracking specific methane yield per substrate, forecasting gas output 48 hours ahead, benchmarking plant performance against theoretical potential, and identifying the operational decisions that are costing the most per kWh produced. Book a free yield analytics assessment.
Quick Answer
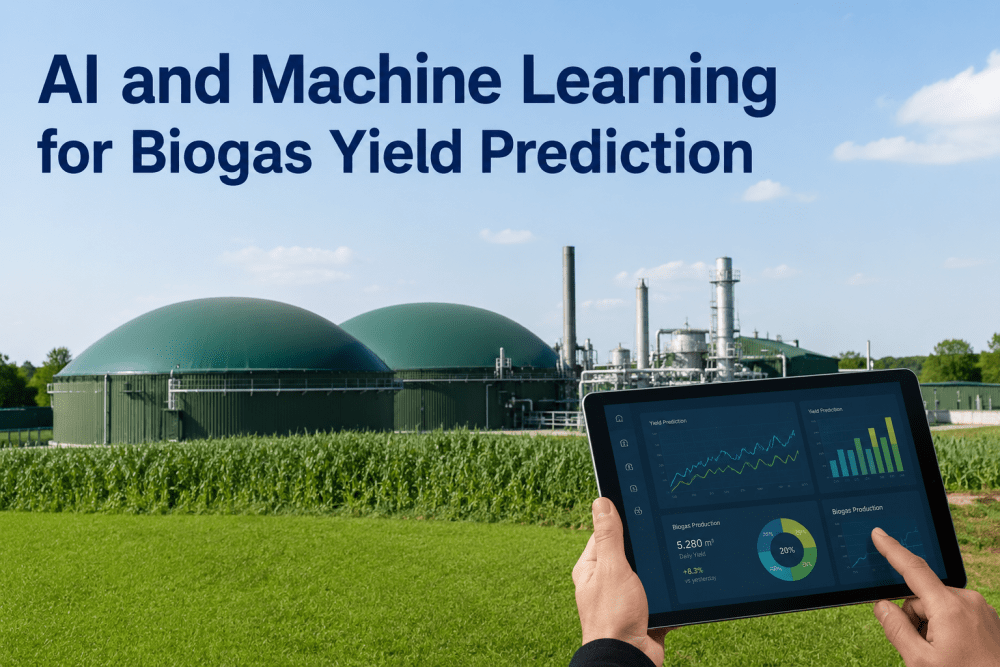
iFactory tracks specific methane yield in m³/tonne VS per substrate type, forecasts gas output 48 hours ahead from biological state and feedstock data, benchmarks your plant against theoretical potential and industry performance ranges, and identifies the operational decisions — feeding patterns, OLR management, temperature control — that are reducing yield per tonne of input.
Yield Losses iFactory Identifies & Recovers
Each card below is a yield loss that biogas plants absorb without knowing it exists — because without substrate-level and process-level analytics, the loss is invisible until it shows up in the annual revenue report. Book a demo to see yield analytics applied to your plant data.
Specific Yield Below Substrate Potential
m³/t VSPer Substrate Tracked
Problem: Plants track total gas output but rarely track methane yield per tonne VS per substrate type — making it impossible to know whether underperformance is from feedstock quality, biological inhibition, or process inefficiency.
iFactory solution: Tracks m³ CH4 per tonne VS per substrate type continuously — identifying which inputs deliver above and below their theoretical BMP, and whether the gap is from feedstock quality variance or from suboptimal digester conditions.
Yield gap quantified per substrate — cause identified
No 48-Hour Methane Forecast for CHP Dispatch
48 hrsForecast Horizon
Problem: Without a methane output forecast, CHP dispatch decisions are made reactively — engines start when gas pressure rises and stop when it falls. Missed peak electricity price windows and unplanned gas flaring events both result from operating without a forward-looking production view.
iFactory solution: Forecasts methane output 24–48 hours ahead from current biological state, digester temperature, substrate composition, and OLR trajectory — enabling CHP dispatch scheduling against grid electricity prices and avoiding both gas waste and missed revenue windows.
CHP dispatch optimised against 48-hr yield forecast
Feeding Pattern Inefficiency — Night vs Day Yield Gap
PatternAnalysis Per Shift
Problem: Manual feeding operations concentrate VS loading during day shifts — creating overnight OLR troughs that suppress methanogen activity during the lowest-activity period. The result is a consistent 10–15% yield gap between shift patterns that no operator notices because gas output is measured daily, not hourly.
iFactory solution: Analyses gas production curves by hour, shift, and day of week — identifying feeding pattern inefficiencies and recommending a distributed feeding schedule that maintains stable OLR across all 24 hours.
Shift-level feeding pattern optimised — OLR stabilised
Production Cost Per kWh — No Visibility
€/kWhReal-Time Cost Tracking
Problem: Most biogas plants know their annual revenue but cannot calculate their production cost per kWh in real time — making it impossible to evaluate whether a given feedstock purchase, maintenance decision, or operational change improves or worsens the economics per unit of energy produced.
iFactory solution: Calculates production cost per kWh continuously — combining substrate cost, maintenance cost per running hour, parasitic energy consumption, and gas upgrading cost against actual methane output — and shows how each operational variable affects the cost per kWh.
Production cost per kWh tracked in real time
VS Destruction Efficiency Below Target
VSDestruction Tracked
Problem: VS destruction efficiency — the percentage of volatile solids converted to biogas rather than remaining in digestate — typically runs 5–12% below optimal in plants without process optimisation. Each percentage point represents methane yield left in the digestate leaving the plant.
iFactory solution: Tracks VS destruction efficiency from feedstock intake VS versus digestate VS output — identifying whether low destruction results from insufficient HRT, temperature excursion, biological inhibition, or substrate recalcitrance, and recommending specific process adjustments to recover each percentage point.
VS destruction gap identified — process adjusted to recover yield
No Industry Benchmark — No Performance Reference Point
Top 25%Benchmark Target
Problem: Without external benchmarking, plant operators have no reference point for whether their specific yield, CHP efficiency, or maintenance cost is competitive — making it impossible to prioritise improvement efforts or make the case for capital investment in process optimisation.
iFactory solution: Benchmarks your plant's specific methane yield, CHP availability, maintenance cost per kWh, and production cost against anonymised industry performance ranges — showing your plant's percentile rank and the yield and cost improvement available from closing the gap to top-quartile performance.
Industry percentile rank shown — improvement value quantified
Know What Your Plant Is Worth Per Tonne of Feedstock — Not Just What It Produces Per Day.
iFactory connects feedstock intake, digester biological data, gas output, and operating costs into a unified yield analytics layer. Active from existing SCADA and lab data within 4 weeks.
Key Production KPIs iFactory Tracks
Every KPI below is calculated automatically from integrated SCADA, feedstock, and lab data — no manual data entry required after initial setup.
Specific Methane Yield
m³ CH4 / tonne VS
Per substrate type and per digester stage — compared to theoretical BMP and historical baseline
48-Hour Gas Output Forecast
m³ CH4 / day
Biological state model — updated every 15 minutes as digester conditions change
VS Destruction Efficiency
% VS converted
Feedstock VS intake vs digestate VS output — gap traced to process cause
Production Cost
€ / kWh produced
Substrate cost + maintenance + parasitic energy — real-time, per operating decision
CHP Electrical Efficiency
% kWh / m³ CH4
Actual vs rated efficiency per engine — degradation trend tracked per unit
Methane Concentration
% CH4 in biogas
Gas quality trended vs digester biological state — deviation classified to upstream cause
Organic Loading Rate
kg VS / m³ / day
Actual vs safe ceiling — per digester stage, with biological state correlation
Industry Percentile Rank
Top X%
Specific yield, maintenance cost, and CHP availability benchmarked against industry ranges
iFactory Yield Analytics Deployment Roadmap
iFactory activates yield analytics in four phases — each adding a layer of intelligence on top of the connected data stream.
Phase 1
Data Integration & Baseline Yield Audit
Weeks 1–2
iFactory connects to SCADA, gas analyser, and feedstock intake records — reconstructing historical specific yield per substrate type and identifying the yield gap between actual performance and theoretical potential from your current feedstock mix.
Deliverable: Historical yield-per-substrate analysis + gap quantification
Phase 2
Live KPI Dashboard & Cost Tracking
Weeks 2–4
Production KPI dashboard goes live — specific yield, VS destruction efficiency, CHP electrical efficiency, and production cost per kWh calculated automatically from integrated data streams. No manual data entry required.
Deliverable: Live production KPI dashboard + cost per kWh tracking
Phase 3
48-Hour Yield Forecast & CHP Dispatch
Weeks 4–6
Biological state model calibrated to your plant — 48-hour methane output forecast active, updated every 15 minutes. CHP dispatch schedule recommendation generated daily against forecast and grid electricity price data.
Deliverable: 48-hr yield forecast + CHP dispatch recommendation
Phase 4
Benchmarking & Continuous Optimisation
Ongoing
Industry benchmarking activated — your plant's specific yield, CHP efficiency, and maintenance cost ranked against anonymised industry performance ranges. Monthly reports quantify yield improvement achieved, remaining gap to top-quartile, and the highest-value optimisation opportunities for the next period.
Deliverable: Monthly yield improvement report + benchmark ranking
Platform Capability Comparison — Yield Analytics
Agraferm Process Manager, BioGasViewer Analytics, Weltec Biogas Portal, and generic historian platforms offer gas output logging and basic KPI dashboards. iFactory differentiates on substrate-level yield attribution, 48-hour biological state forecasting, production cost modelling, and industry benchmarking — capabilities that require multi-source data integration, not standalone gas meter logging. Book a comparison demo.
| Capability |
iFactory |
Agraferm |
BioGasViewer |
Weltec Portal |
Generic Historian |
| Yield Tracking |
| m³ CH4 / tonne VS per substrate type |
Auto-calculated, per batch |
Manual input required |
Total yield only |
Not available |
Not available |
| VS destruction efficiency tracking |
Intake vs digestate, continuous |
Manual lab entry |
Not available |
Not available |
Not available |
| Yield gap traced to process cause |
AI root cause classification |
Not available |
Not available |
Not available |
Not available |
| Forecasting & Planning |
| 48-hour methane output forecast |
Biological state model |
Not available |
Not available |
Not available |
Not available |
| CHP dispatch vs grid price recommendation |
Daily schedule, price-aware |
Not available |
Not available |
Not available |
Not available |
| Economics & Benchmarking |
| Production cost per kWh — real-time |
Substrate + maintenance + energy |
Not available |
Not available |
Not available |
Not available |
| Industry percentile benchmarking |
Anonymised industry comparison |
Not available |
Not available |
Not available |
Not available |
Based on publicly available product documentation as of Q1 2025. Verify current capabilities with each vendor before procurement decisions.
Measured Outcomes Across Deployed Plants
22%
Average Increase in Specific Methane Yield Per Tonne VS
48 hrs
Methane Forecast Horizon — Updated Every 15 Minutes
18%
Reduction in Production Cost Per kWh After Optimisation
8 KPIs
Tracked Automatically — No Manual Data Entry
Per
Substrate Yield Tracking — Not Just Total Plant Output
4 wks
To Live Production Dashboard — Existing Data Used
Top 25%
Industry Benchmark Target — Quantified Gap Shown
Daily
CHP Dispatch Recommendation vs Grid Electricity Price
How Much Yield Is Your Plant Leaving on the Table Per Tonne of Feedstock?
iFactory's pre-deployment assessment analyses your existing SCADA and feedstock records to quantify the gap between your current specific yield and your plant's theoretical potential — before any software is installed.
From the Field
"We thought we were running at a reasonable 275 m³/tonne VS. iFactory showed us our maize silage batches were delivering 310 m³/tonne while our food waste was delivering 215 m³/tonne — and we were buying food waste at a higher cost per tonne of VS than the silage. The yield analytics paid for themselves in the first procurement decision we changed. We also started using the 48-hour forecast to schedule CHP output against peak electricity prices — that alone added €18,000 in the first quarter."
Commercial Director
8 MWe Agricultural & Food Waste Biogas Plant — Denmark
Frequently Asked Questions
QHow accurate is the 48-hour methane forecast — what data does it require?
The forecast uses current biological state (VFA:alkalinity, pH trend), digester temperature, substrate composition, and feeding schedule — achieving ±8–12% accuracy in the first month, improving to ±5% as the biological model is refined. Existing SCADA data is sufficient; no new sensors are required.
See forecast accuracy in a demo.
QHow does iFactory calculate specific yield per substrate if we mix multiple inputs before feeding?
iFactory uses substrate intake records (weight and type per delivery), BMP reference values, and actual gas output to attribute yield fractions to each substrate type using mass balance modelling. Precision improves as the system accumulates plant-specific BMP data over 6–8 weeks.
QWhat does the industry benchmarking compare our plant against — is it relevant to our plant type and feedstock?
Benchmarks are filtered by plant type (agricultural, food waste, sewage sludge, co-digestion), capacity range, and feedstock category — so your plant is compared to genuinely comparable operations. Benchmarking covers specific yield, CHP availability, maintenance cost per kWh, and production cost.
Review benchmark categories in a demo.
QCan iFactory's CHP dispatch recommendation integrate with our energy management system or grid export contract?
Yes. iFactory ingests grid electricity price feeds (day-ahead market or fixed tariff schedules) and generates a daily CHP dispatch plan that maximises revenue within your gas storage capacity, minimum generation commitments, and engine maintenance windows. API export to energy management systems is supported.
Continue Reading
Biogas Feedstock Optimisation SoftwareThe upstream input to yield prediction — C:N ratio, BMP tracking, and cost-per-kWh ranking per substrate type.
Read more
AI Anaerobic Digestion OptimisationBiological process optimisation that maximises the methane yield the forecast is predicting — VFA control and OLR management.
Read more
Predictive Analytics for CHP EnginesCHP availability and electrical efficiency — the other half of the revenue equation alongside methane yield.
Read more
SCADA / PLC Integration for Biogas PlantsThe data foundation that makes yield analytics possible — connecting every process data source into one intelligence layer.
Read more
Real-Time Yield Intelligence — Per Substrate, Per Digester, Per kWh Produced.
iFactory tracks specific methane yield, VS destruction efficiency, production cost per kWh, and 48-hour output forecast — benchmarked against industry performance ranges and linked to the operational decisions that drive every number.
m³/tonne VS Per Substrate
48-Hour Yield Forecast
Production Cost Per kWh
VS Destruction Efficiency
Industry Benchmarking