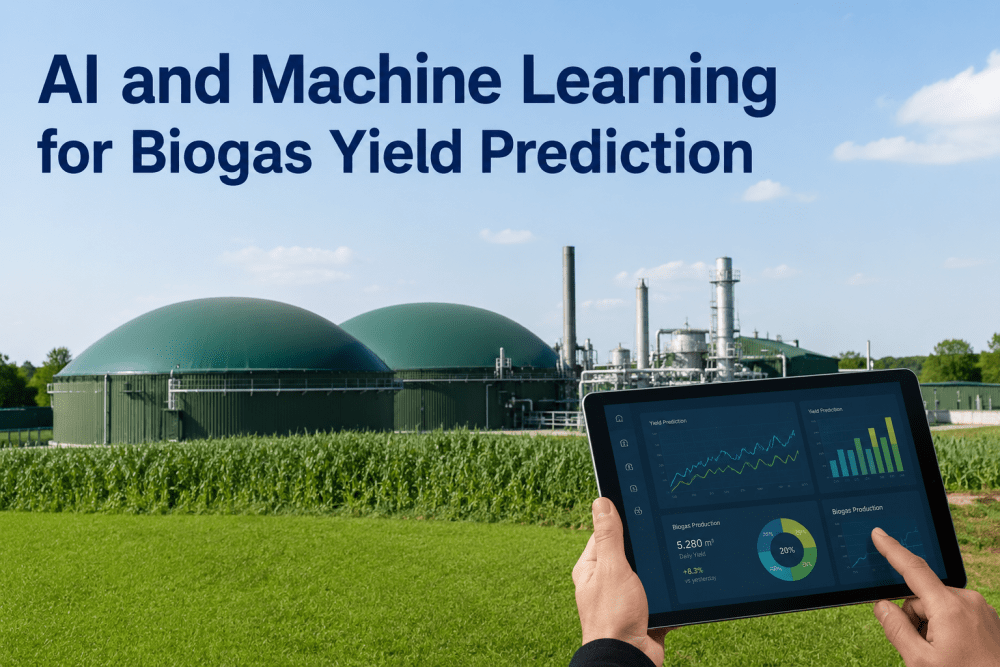
Biogas plants generate a continuous stream of process data — temperature, pH, volatile fatty acid concentration, organic loading rate, gas composition, hydraulic retention time — that contains everything needed to predict methane yield with high accuracy.Facilities that have deployed iFactory's ML-based yield optimization platform are reporting 22–34% increases in methane yield, 18% reductions in digester upset events, and payback periods under seven months from feed scheduling optimization alone. Book a demo to see the yield model applied to your facility's data.
The Analytics Gap That Costs Biogas Plants 25–35% of Their Methane Potential
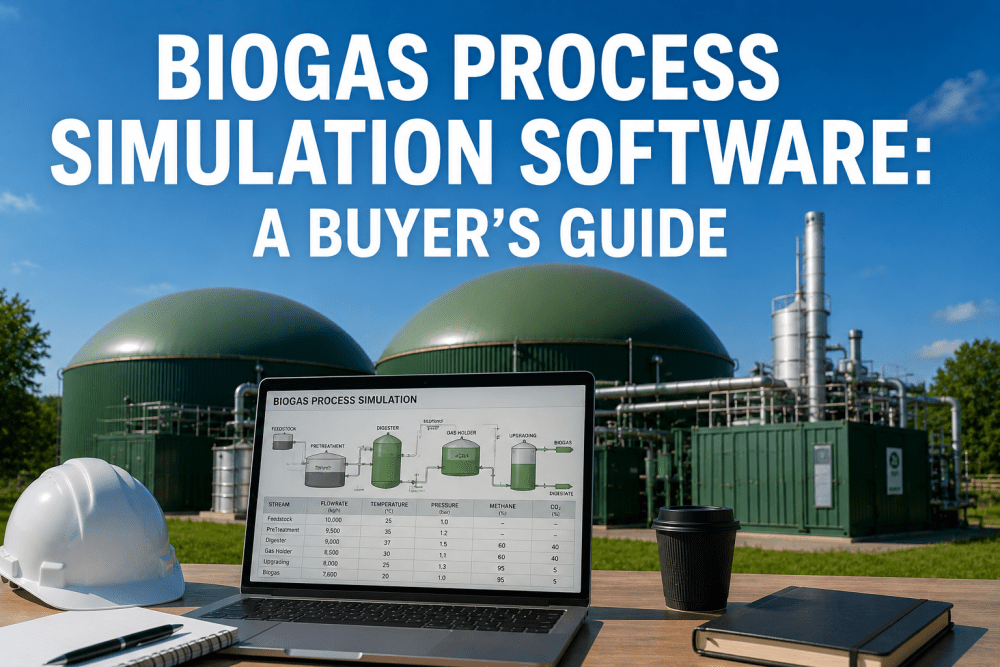
Anaerobic digestion is a biological process governed by dozens of interacting parameters — feedstock composition, organic loading rate (OLR), pH buffering capacity, volatile fatty acid (VFA) concentration, ammonia inhibition levels, trace element availability, and microbial population dynamics. The relationship between any single parameter and methane yield is rarely linear: a 10% increase in OLR may boost yield when VFA levels are below 2,000 mg/L but trigger acidification and yield collapse when they are above 3,500 mg/L. Traditional control strategies rely on fixed setpoints and operator experience — monitor pH, keep VFA:alkalinity ratio below 0.4, maintain temperature within ±1°C — but these heuristics cannot account for the compound interactions that determine actual methane output at any given moment.Book a demo
The Four Parameter Categories That Drive Biogas Yield — and How ML Models Use Them
Methane yield prediction requires monitoring across four interconnected parameter categories. Each category contributes distinct signals to the ML model, and the model's predictive power depends on capturing the interactions between categories rather than treating them as independent variables. iFactory's neural network architecture processes all four categories simultaneously through a multi-input layer that preserves the cross-category interaction effects that linear regression models cannot capture.Book a demo
Feedstock Composition and Variability Modeling
Feedstock is the most influential yet most variable input to any anaerobic digestion model. Total solids (TS), volatile solids (VS), C:N ratio, carbohydrate-to-protein balance, and trace element concentration vary within and between feedstock batches. A 10% increase in VS loading can boost methane potential by 8–12%, but only if the C:N ratio stays between 20:1 and 30:1 and ammonia inhibition does not develop.
Process Chemistry and Stability Indicators
Digester chemistry determines whether the biological environment supports methanogenesis or drifts toward acidification and yield collapse. VFA concentration, alkalinity, VFA:alkalinity ratio, pH, and total ammonia nitrogen (TAN) are the primary chemical indicators.
Microbial Population Health and Activity Indicators
The microbial community — hydrolytic bacteria, acidogens, acetogens, and methanogens — responds to changes in feedstock, temperature, and chemistry on time scales ranging from hours to weeks. Direct microbial monitoring (FISH, qPCR, metagenomics) provides definitive population data but at sampling intervals that are too sparse for real-time control. iFactory's ML model infers microbial activity from the chemical indicators that change as population dynamics shift: propionate accumulation signals acetogen inhibition; acetate accumulation indicates methanogen stress; hydrogen partial pressure trends reflect syntrophic activity balance. The model learns each facility's specific microbial response patterns and flags shifts that precede yield changes.
Operational Factors: Loading, Retention, and Mixing
Operational decisions — feeding schedule, organic loading rate, hydraulic retention time, mixing intensity — are the levers that operators can adjust in real time, and they have immediate effects on methane yield. The challenge is that the optimal setting for each lever depends on the current state of the other three parameter categoriesBook a demo.
How iFactory's Neural Network Architecture Converts Process Data into Actionable Yield Predictions
Standard regression-based yield models attempt to fit methane output as a linear function of input parameters — an approach that fundamentally cannot capture the non-linear, interdependent behavior of anaerobic digestion. A linear model trained on the same data as a properly configured neural network will achieve an R² of 0.45–0.65 at best, missing the interaction effects that drive the majority of real-world yield variation.
Traditional Process Control vs. ML-Driven Yield Optimization: A Comparison
The table below documents the operational difference between conventional digester control based on fixed setpoints and operator heuristics and iFactory's ML-driven approach that adapts to current conditions in real time. The comparison is based on side-by-side performance data from U.S. anaerobic digestion facilities that have deployed ML yield optimization alongside their existing SCADA-based control systems.
| Control Dimension | Traditional SCADA / Manual Control | iFactory ML-Driven Optimization | Yield Impact | Risk Reduction |
|---|---|---|---|---|
| Feeding Rate Decision | Fixed OLR setpoint based on design capacity; adjusted manually when yield drops | OLR recommended dynamically based on current VFA, alkalinity, and temperature trend | +15-22% methane yield through optimal loading | Feeding at capacity without exceeding stability threshold |
| Co-Substrate Selection | Fixed recipe or batch-dependent operator judgment | Co-substrate ratio optimized for current digester condition and feedstock availability | +8-14% yield through co-digestion synergy | Reduced acidification risk from wrong co-substrate mix |
| Upset Detection | Single-parameter alarm when pH < 6.8 or VFA > 4,000 mg/L | Compound risk detection from VFA-alkalinity-temperature interaction trends before upset develops | Loss prevention estimated at 12-18% annual yield | 60-72 hour advance warning of impending instability |
| HRT Management | Fixed retention time based on tank volume and average feed rate | Effective HRT adjusted for variable solids content and degradation rate predictions | +5-8% yield from retention optimization | Prevents washout during high-throughput periods |
| Temperature Regulation | Maintain ±1°C of setpoint; alarm on deviation | Temperature trajectory modeled against microbial activity optimum; preemptive adjustment | +3-6% yield from thermal optimization | Shorter recovery from temperature excursions |
| Yield Forecasting | Historical average with manual adjustment for known feed changes | 24-72 hour ML forecast with R² > 0.92 and prediction intervals | Enables proactive gas contract management | Pipeline quality forecasting reduces penalties |
Facilities transitioning from traditional control to iFactory's ML-driven optimization consistently report that the most significant operational change is not the yield improvement itself — it is the ability to make feeding decisions proactively rather than reactively. Operators shift from responding to yesterday's yield decline to implementing today's optimized feeding schedule based on tomorrow's predicted output. Book a demo
The Revenue Impact of ML Yield Optimization: From Methane Loss to Profit Recovery
The financial case for ML-driven yield optimization starts with a straightforward calculation: a facility operating at 65% of design methane potential and producing 1,500 Nm³/h of biogas at 55% methane is losing approximately 800 Nm³/h of methane — equivalent to roughly 5.7 MWh/h of lost energy value.
- 22–34% methane yield increase from ML-optimized feeding schedule and co-substrate selection
- Revenue recovered from sub-65% baseline operation common across U.S. biogas plants
- Energy value captured as pipeline injection, CHP generation, or RNG credit qualification
- Yield improvement sustained across seasonal feedstock variation through continuous model retraining
- Payback period 5–7 months from yield gain alone at typical facility throughput
- Digester upset events cost $60,000–$150,000 per event in lost production, chemicals, and disposal
- 18% reduction in upset frequency with ML-based early warning detection
- Compound risk detection identifies instability 48–72 hours before conventional single-parameter alarms
- Recovery time reduced by 40% when corrective action starts during the warning window rather than after upset
- Chemical consumption for pH adjustment and nutrient supplementation reduced by 15–25%
- Reduced laboratory analysis frequency as ML model infers digester health from online sensor data
- Lower trace element and nutrient supplementation costs through optimized dosing based on yield prediction
- Reduced mixing energy through duty cycle optimization based on VFA and solids distribution trends
- Extended time between digester cleaning events from stabilized operation and reduced solids accumulation
- Reduced overtime labor from fewer upset response and recovery events
- Continuous yield and emissions monitoring data available for RNG credit qualification audits
- Digester performance records maintained automatically for state and federal biogas program reporting
- GHG displacement documentation generated from verified methane production improvement data
- Feedstock receipt-to-yield traceability for co-digestion facility permit compliance
- Operational data export for LCFS and RIN credit documentation where applicable
Expert Review: Why Machine Learning Is the Missing Layer in Biogas Yield Optimization
I have spent 22 years designing and optimizing anaerobic digestion systems for municipal, agricultural, and industrial biogas facilities across North America. The single most consistent finding across every facility I have worked with is that the data to predict yield is already being collected — every facility monitors temperature, pH, VFA, alkalinity, gas composition, and loading rate. But that data is used to confirm what already happened, not to predict what will happen next. Operators look at yesterday's VFA trend and adjust today's feed based on experience and heuristics. The problem is that the relationship between VFA and yield is not the same at 35°C as it is at 38°C, and it is not the same at 5,000 mg/L alkalinity as it is at 3,500 mg/L. A human operator cannot hold six interacting parameters in working memory and calculate the optimal feeding rate for current conditions — no one can. That is precisely what a neural network does. I have validated iFactory's yield prediction model against three years of operating data from a 5 MW food waste AD facility, and the R² of 0.94 on the held-out test set matches or exceeds any academic model I have seen published for real-world, variable-feedstock anaerobic digestion.
Schedule a facility-specific assessment of your biogas plant's yield optimization potential. Book a demo with our team to discuss your feedstock profile and process data requirements.
Conclusion: The Data Is Already There. The Yield Prediction Model Is What Is Missing.
U.S. biogas facilities operate in an environment where every feedstock batch, every digester chemistry reading, every gas composition measurement, and every yield record is a data point that contains information about future methane output. The vast majority of that data is stored in SCADA historians and laboratory databases without being connected to a predictive model that can extract the non-linear, multi-parameter relationships that determine actual yield.
Book a demo to see iFactory's biogas yield prediction model applied to your facility's data.
Frequently Asked Questions
Conventional regression models — linear regression, polynomial regression, even random forest — assume either a linear relationship between inputs and methane yield or at best capture pairwise interactions between parameters. Anaerobic digestion is governed by higher-order interactions: the combined effect of VFA, alkalinity, temperature, and OLR on yield cannot be expressed as a sum of individual parameter effects plus pairwise cross-terms.
The minimum viable dataset for building a facility-specific yield prediction model is 12 continuous months of daily or shift-level process data covering the following categories: feedstock characteristics (total solids, volatile solids, COD, TKN, C:N ratio, and trace element concentrations per batch or per delivery), digester chemistry (temperature, pH, VFA — ideally acetate/propionate/butyrate fractionation — alkalinity, TAN, and orthophosphates at minimum daily frequency), biogas output (methane concentration, biogas flow rate, H₂S concentration, and hydrogen partial pressure if available), and operational records .
No. Feedstock variability is a feature the model is designed to handle, not a condition that breaks it. iFactory's model architecture includes a feedstock embedding layer that encodes feedstock characteristics — TS, VS, C:N ratio, carbohydrate-to-protein balance, trace element profile — as a continuous vector representation that the model incorporates as a conditional input. When a new feedstock type or a significant batch composition change occurs, the model adjusts its yield prediction based on the similarity of the new feedstock to previously observed feedstocks in the embedding space.
The model detects two classes of upset precursors. The first is single-parameter trend acceleration: VFA concentration rising at a rate above the facility's historical 90th percentile, or alkalinity declining faster than the model's learned baseline for current loading conditions. The second is compound signature detection: VFA rising simultaneously with alkalinity falling while temperature is also trending away from setpoint — a pattern that precedes 70–80% of serious upset events in the training data. patterns. Book a demo
For a single-digester biogas facility with 1–5 MW electrical equivalent capacity, existing SCADA data logging, and at least 6 months of historical process records — typical of a medium-scale food waste, agricultural, or municipal AD facility — the full ML yield prediction deployment runs $55,000 to $110,000 in total investment over an 8–12 week implementation timeline.