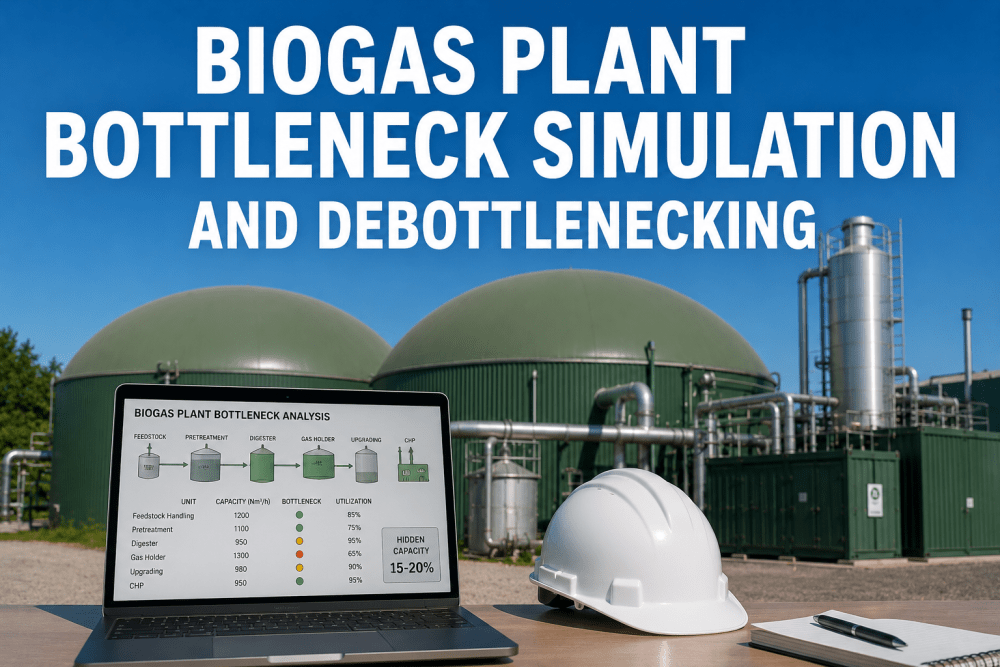
Most biogas plants operate with 10-20% of their nameplate capacity locked behind hidden bottlenecks — undersized heat exchangers, recirculation pumps running below design flow, gas handling trains constrained by single-point components, or digesters limited by mixing or organic loading distribution. Book a Demo
BIOGAS BOTTLENECK SIMULATION · DEBOTTLENECKING · CAPACITY ANALYSIS · 2026
Biogas Plant Bottleneck Simulation: Find Hidden Capacity Before Committing Capex
Most biogas plants leave 10-20% of production capacity in hidden bottlenecks. Process simulation identifies constraints across feedstock handling, digestion, gas treatment, and CHP systems — enabling capacity recovery at a fraction of the cost of greenfield expansion. Deployed with iFactory CMMS integration for continuous performance tracking against simulated baselines.
10-20%
Hidden Plant Capacity
$200K
Additional Revenue / MW
3-6 Mo
Typical Payback Period
60 d
Full Assessment Timeline
01 / Common Bottlenecks
Identifying Hidden Capacity in Biogas Plants: Six Constraint Zones
Biogas plant bottlenecks rarely announce themselves. They accumulate gradually — a pump impeller worn by 15%, a heat exchanger fouled by 3 mm of scale, a gas compressor valve leaking intermittently, a digester mixer operating at reduced speed. Each individual degradation is too small to trigger an alarm. Collectively, they erode 10-20% of the plant's achievable throughput. The simulation-based approach to debottlenecking starts by systematically evaluating six constraint zones. Book a Demo
Feedstock HandlingReceiving pit capacity, chopper pump throughput, pasteurization heat exchanger duty, blending tank mixing and volume, and feed pump discharge pressure. Constraint typically appears as extended receiving times during peak delivery seasons and reduced OLR when feed pumps cannot maintain target flow against digester head pressure.
Digester Organic LoadingWorking volume utilization, organic loading rate per unit volume, mixing energy input per cubic meter, heat exchanger duty for process temperature maintenance, and volatile solids destruction efficiency. Constraint manifests as HRT below design, incomplete VS destruction, or thermal stratification that reduces active volume.
Biogas Handling and ConditioningGas holder storage volume, H2S removal bed capacity and contact time, condensate removal effectiveness, gas compressor flow capacity against discharge pressure, and gas cooling/dehumidification prior to CHP or upgrading. Constraint appears as compressor runtime exceeding duty cycle
CHP and Gas UtilizationEngine/generator rated capacity vs. actual output, heat recovery system effectiveness, parasitic electrical load from gas compression, and grid export capacity limitation. Constraint shows as CHP operating below nameplate derated by gas quality, intake air temperature, or maintenance interval.
Digestate Processing and StorageSeparator throughput and separation efficiency, digestate storage capacity relative to spreading window constraints, nutrient concentration impact on transport economics, and fugitive methane emissions from uncovered storage. Constraint emerges during seasonal spreading windows when separator capacity limits plant runtime.
Controls and AutomationSCADA setpoint optimization, feed scheduling logic, recirculation pump sequencing, and alarm threshold configuration. Soft constraints in control logic — overly conservative ramp rates, unnecessary idle periods between batches, or suboptimal recirculation schedules — often impose larger capacity penalties than any single mechanical component.
02 / The Bottleneck Detection Framework
How Process Simulation Quantifies Hidden Capacity
The standard approach to bottleneck identification uses a validated process simulation model of the entire biogas plant — from feedstock reception to gas export or power generation.
10-20%
Hidden capacity in most plants
Published case studies and industry benchmarks consistently show that 10-20% of nameplate capacity is unavailable due to accumulated bottlenecks. A 2024 study of 40 agricultural AD plants found that 17 of 40 plants were operating below 80% of achievable throughput, with the primary constraint split evenly between feedstock handling, digester loading, and gas utilization systems.
60 d
Full assessment to recommendation
A structured bottleneck simulation assessment delivers a prioritized debottlenecking roadmap within 60 days. The assessment includes plant data audit, simulation model development and calibration, constraint identification through parametric sensitivity analysis, and ROI-ranked implementation recommendations for each identified bottleneck.
3-6 Mo
Payback on debottlenecking investment
Debottlenecking interventions — heat exchanger cleaning, pump impeller upgrades, control logic optimization, gas compressor refurbishment — typically pay back within 3-6 months through increased biogas production and revenue. Capital-intensive interventions.
$200K
Additional annual revenue per MW
Recovering 15% hidden capacity from a 1 MW biogas plant at an average power price of $0.08/kWh generates approximately $105,000 in additional annual electricity revenue. For plants with biogas upgrading to RNG, the revenue impact per MW is significantly higher
"We spent six months evaluating a $4 million digester expansion to increase plant throughput. A three-week simulation study identified that our gas compressor skid was the true bottleneck — the digesters had 25% more capacity than we were using. Replacing the compressor and upgrading two feed pumps cost $180,000 and delivered the same throughput increase we were planning to build a new digester for. The simulation paid for itself 22 times over on that single finding."
03 / Debottlenecking Methodology
A Four-Stage Process for Systematic Capacity Recovery
Effective debottlenecking follows a structured methodology that separates the problem into four phases. Each phase builds on the previous one, ensuring that capital decisions are based on simulation-validated analysis rather than anecdotal observations or vendor recommendations.
SIMULATE
Build and calibrate the plant-wide simulation model. Develop a steady-state or dynamic model of the entire biogas plant in Aspen Plus, BioWin, or equivalent platform. Calibrate against 4-8 weeks of SCADA data encompassing normal operation, feedstock transitions, and seasonal variation. Validate model prediction accuracy against measured biogas production, methane concentration, VS reduction, and energy balance before proceeding to constraint analysis.
ANALYZE
Identify the primary constraint through parametric sensitivity. Vary each unit operation's capacity individually in the simulation while holding all others at design baseline. The unit operation producing the largest reduction in overall plant throughput when constrained is the primary bottleneck. Repeat the analysis for the secondary and tertiary constraints, as debottlenecking the primary constraint will shift the bottleneck to the next most limiting unit.
PRIORITIZE
Rank interventions by ROI and implementation complexity. For each identified bottleneck, evaluate at least three intervention options ranging from operational adjustment (control logic change, cleaning schedule optimization) through equipment refurbishment (pump impeller upgrade, heat exchanger chemical cleaning) to capital replacement (larger compressor, additional storage). Score each option on throughput impact, capital cost, implementation timeline, and production interruption risk.
IMPLEMENT
Execute debottlenecking with CMMS-tracked performance verification. Implement the highest-ROI interventions in order of priority. Use iFactory CMMS to track actual throughput before and after each intervention against the simulated prediction. Update the simulation model with post-intervention data to recalibrate the baseline and identify the next constraint. This iterative process continues until the plant reaches its economic optimum — the throughput level where additional debottlenecking cost exceeds the revenue from incremental gas production.
04 / Implementation
60-Day Bottleneck Simulation Assessment: Phased Delivery
Days 1-14
Plant Audit and Data Collection
Full operational audit of all plant subsystems with emphasis on design vs. actual performance for each unit operation. Collect 4-8 weeks of SCADA historian data including feedstock flow rates and composition, digester temperature and pH profiles, gas production and methane concentration time-series.
Days 15-35
Simulation Model Development and Calibration
Build plant-wide process simulation model incorporating all unit operations from feedstock reception to gas export. Calibrate model against audit data with target prediction accuracy of 10% for biogas production rate, 3% absolute for methane concentration, and 10% for VS destruction efficiency. Validate model against a second independent data set from a different operating period to confirm predictive reliability before proceeding to constraint analysis.
Days 36-52
Constraint Identification and Prioritization
Run parametric sensitivity analysis across all six constraint zones to identify primary, secondary, and tertiary bottlenecks. For each constraint, develop at least three intervention options with throughput impact, capital cost, and implementation complexity ratings. Rank interventions by ROI using the plant's specific economic parameters (electricity price, RIN/LCFS values, digestate disposal cost, labor rates). Prepare comprehensive debottlenecking roadmap document.
Days 53-60
Recommendation Report and Integration with iFactory CMMS
Deliver prioritized debottlenecking recommendation report with simulation model files, sensitivity analysis results, and economic justification for each intervention. Configure iFactory CMMS to track actual plant throughput against simulated baseline for each debottlenecking stage. Set up automated alerts when post-intervention performance deviates from simulated prediction, enabling rapid identification of incomplete intervention execution or secondary constraint emergence.
05 / Results
Measured Capacity Recovery: Before and After Debottlenecking Simulation
The table below presents realistic results from a 1 MW agricultural AD plant that completed a 60-day bottleneck simulation assessment and implemented a prioritized debottlenecking program. Actual results vary by plant configuration, feedstock profile, and the specific bottlenecks identified. The data represents ranges achievable within 12 months of completing the assessment.
| Performance Metric |
Before Debottlenecking |
After Debottlenecking |
Net Change |
| Biogas production rate |
175 Nm3/hr (avg) |
205 Nm3/hr (avg) |
+17% throughput |
| Digester OLR achieved |
2.8 kg VS/m3/d |
3.4 kg VS/m3/d |
+21% loading rate |
| Biogas compressor runtime |
92% duty cycle |
68% duty cycle |
-24% compressor load |
| CHP electrical output |
780 kW (avg) |
940 kW (avg) |
+21% generation |
| CHP electrical efficiency |
38.5% LHV |
40.2% LHV |
+1.7 pp efficiency |
| Feed pump availability |
82% uptime |
96% uptime |
+14 pp availability |
| Heat exchanger effectiveness |
62% of design DT |
91% of design DT |
+29 pp recovery |
| Unplanned downtime per quarter |
38 hrs avg |
9 hrs avg |
-76% downtime |
| Annual electricity revenue |
$547,000 |
$659,000 |
+$112,000/yr |
| Total debottlenecking investment |
N/A |
$186,000 |
5.5 mo payback |
$112K
Annual Revenue Gain
5.5 Mo
Investment Payback
Zero
New Digester Required
See How Bottleneck Simulation Can Recover Your Plant's Hidden Capacity
Get a live walkthrough of the 60-day bottleneck assessment process, including simulation model examples, constraint analysis methodology, and iFactory CMMS integration for continuous performance tracking against simulated baselines.
"The first time our debottlenecking simulation predicted that cleaning the digester heat exchanger would increase gas production by 12%, we were skeptical. The plant operators had always assumed the heat exchanger was performing adequately because the outlet temperature was within spec. After the chemical cleaning, gas production increased by 14.3% — within the simulation's prediction range. That single intervention paid for the entire assessment cost. We now run the simulation quarterly and use iFactory to track actual vs. predicted performance for every debottlenecking action."
06 / Expert Analysis
Why Simulation-Based Debottlenecking Outperforms Intuitive Approaches
01
Bottlenecks migrate as soon as the primary constraint is removed. Intuitive debottlenecking — replacing whichever component seems most undersized — almost never achieves full capacity recovery because removing one bottleneck immediately shifts the constraint to the next most limiting unit operation. Simulation-based debottlenecking models the entire plant as an interconnected system, predicting the order in which constraints will emerge and enabling preemptive planning for the full sequence of interventions. Plants that follow the full simulation roadmap achieve 85-95% of theoretical capacity within 12 months, compared to 40-60% for plants using intuitive single-constraint replacement.
02
Soft constraints in control logic often have higher ROI than mechanical upgrades. In 30-40% of debottlenecking assessments, the primary constraint turns out to be a control logic issue rather than an undersized mechanical component — suboptimal feed scheduling, overly conservative ramp rates, or recirculation pump sequencing that creates hydraulic short-circuiting. Correcting these soft constraints costs essentially nothing (control logic programming time only) and can recover 5-15% of capacity. The simulation model identifies these opportunities by comparing actual operating parameters against theoretical optimums that operators cannot calculate manually.
03
Degradation-driven bottlenecks accumulate faster than periodic inspection reveals. A pump impeller wears gradually, a heat exchanger fouls incrementally, a compressor valve leaks intermittently — each individual degradation is too small to trigger an alarm. Collectively, they erode 1-2% of capacity per month of operation. Simulation-based debottlenecking that is updated quarterly tracks the accumulating impact of degradation on achievable throughput and triggers maintenance interventions at the economic optimum point — before the capacity loss justifies the intervention cost, but before the degradation becomes severe enough to cause secondary damage or emergency failure.
04
iFactory CMMS integration sustains the debottlenecking gains over time. The bottleneck simulation produces a static recommendation at a single point in time. Without a system to track actual vs. predicted performance continuously, the plant gradually drifts back toward the constrained state as equipment degrades and operating conditions shift. iFactory provides that continuous tracking layer — importing the simulation's performance baselines, monitoring actual throughput and efficiency metrics against those baselines, and automatically generating work orders when deviation exceeds threshold. This closed-loop approach ensures that the capacity recovered through debottlenecking is maintained over the plant's operating life. Book a Demo
07 / Business Impact
Operational, Financial, and Strategic Outcomes Beyond Capacity Recovery
Capital Avoidance
The most significant financial impact of simulation-based debottlenecking is avoiding or deferring capital expenditure on new digesters, CHP units, or gas upgrading capacity. Recovering 15-20% hidden capacity at $80,000-$150,000 in debottlenecking investment avoids $3-5 million in greenfield expansion cost. The capital saved can be redirected to higher-ROI projects such as gas upgrading to RNG or heat network expansion for district heating.
Revenue Enhancement
Each additional Nm3 of biogas recovered through debottlenecking generates revenue through electricity export, RNG injection, or thermal energy delivery. For a 1 MW plant achieving 20% capacity recovery, the additional $100,000-$200,000 in annual revenue compounds over the remaining plant life. For plants with RIN/LCFS credit eligibility, the revenue impact is amplified by the credit value per MMBtu of renewable gas.
Operational Stability
Debottlenecking reduces the number of operating constraints that force operators into manual intervention, workaround procedures, or emergency responses. Plants that complete a full debottlenecking program report 50-70% fewer operator-initiated feed rate reductions, 30-50% less overtime for unplanned maintenance, and measurable improvement in operator confidence in the plant's ability to maintain target output through feedstock transitions and seasonal variation.
Sustainability Compliance
Increasing biogas production from existing assets without new construction directly supports sustainability metrics: higher renewable energy output per ton of feedstock, improved carbon intensity scores for RNG pathways, and reduced fugitive methane emissions from uncovered digestate storage. iFactory's automated compliance documentation ensures that every debottlenecking intervention is recorded with audit-ready traceability for RIN, LCFS, and ISO 14001 reporting.
$547K
Annual revenue before
$659K
Annual revenue after
$112K
Annual revenue gain
08 / Conclusion
Hidden Capacity Is the Most Cost-Effective Megawatt You Will Ever Find
Every biogas plant has hidden capacity. The question is whether the plant operations team has the analytical tools to find it before the cumulative effect of degradation, suboptimal control logic, and component wear reduces throughput below the economic optimum.
iFactory CMMS integration sustains these gains over time by tracking actual plant performance against simulated baselines, alerting operations teams when deviation indicates degradation or emerging constraint, and maintaining the compliance documentation required for RIN, LCFS, and ISO reporting. Without this continuous tracking layer, the debottlenecking gains erode as equipment degrades and the plant gradually returns to the suboptimal state the assessment identified. To see how bottleneck simulation and iFactory integration can recover your plant's hidden capacity, Book a Demo.
10-20% Hidden Capacity. Zero New Digesters. 60-Day Assessment.
See how simulation-based bottleneck analysis reveals your plant's hidden capacity and how iFactory CMMS integration sustains the gains through continuous performance tracking against simulated baselines.
09 / FAQ
Frequently Asked Questions
How do I know if my biogas plant has hidden capacity that bottleneck simulation could identify?
If your plant consistently produces below nameplate capacity, if feed pumps or gas compressors run at high duty cycles, if CHP output is derated relative to biogas production, or if you have experienced progressive decline in throughput over 6-12 months without a clear single-cause explanation, your plant almost certainly has recoverable hidden capacity. A preliminary screening assessment using 4 weeks of SCADA data and operator interviews can typically estimate the magnitude of hidden capacity within 2-3 days.
Book a Demo to discuss your plant's indicators with an iFactory engineer.
What data do I need to provide for a bottleneck simulation assessment?
The standard assessment requires 4-8 weeks of plant SCADA data including feedstock flow rates and composition (or composition estimates from laboratory analysis), digester operating parameters (temperature, pH, VS loading, HRT), biogas production and methane concentration time-series, CHP or gas upgrading system performance data, and maintenance records for key equipment. If SCADA data coverage is limited, the assessment can proceed with manual log data and operator shift reports, though prediction accuracy will be reduced. iFactory can deploy temporary data loggers to supplement gaps in plant instrumentation.
What is the typical payback period for a debottlenecking investment identified through simulation?
Payback periods vary by bottleneck type. Control logic adjustments and operational changes typically pay back within 1-2 months. Equipment refurbishment (heat exchanger cleaning, pump impeller replacement, compressor valve service) pays back within 3-6 months. Capital replacement (larger compressor, additional storage, upgraded separator) pays back within 12-18 months. The simulation assessment itself typically pays back within the first 3 months through the revenue from the first implemented intervention. Across a full debottlenecking program, average payback is 4-8 months.
Do I need to shut down my plant for the bottleneck simulation assessment?
No. The simulation assessment is conducted entirely using existing plant data and does not require any production interruption. Data collection runs in the background using SCADA historians and operator logs. Simulation model development and constraint analysis are performed off-site using the collected data.
How does iFactory help sustain the capacity gains after debottlenecking?
iFactory imports the simulation model's performance baselines and predicted throughput for each debottlenecking stage. Actual plant SCADA data is continuously compared against these baselines. When actual performance deviates from the simulated prediction by more than a configurable threshold (typically 5-10%), iFactory automatically generates a work order for investigation — enabling the operations team to identify degradation, control drift, or emerging constraints before they erode the recovered capacity. The platform also maintains compliance documentation linking each debottlenecking intervention to its measured throughput impact, creating an audit trail for RIN, LCFS, and ISO reporting.