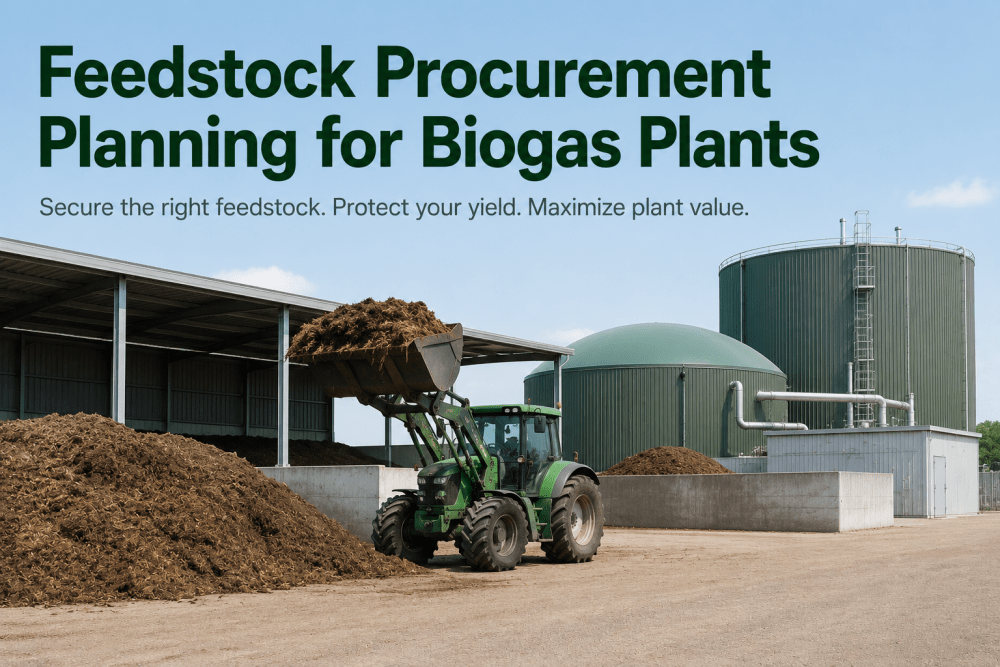
Feedstock procurement represents 40 to 60 percent of total operating expenditure for any biogas plant, yet most facilities still manage it as a fixed input rather than a dynamic variable that can be actively optimized. Between corn silage, dairy manure, food waste, and fats-oils-greases, each substrate carries a fundamentally different cost per Nm3 of methane potential, and the spread between the cheapest and most expensive feedstock can exceed 300 percent on an energy-equivalent basis. Organizations that Book a demo of iFactory see how machine learning models can recommend optimal feedstock blends based on current pricing, inventory levels, and historical digester response.
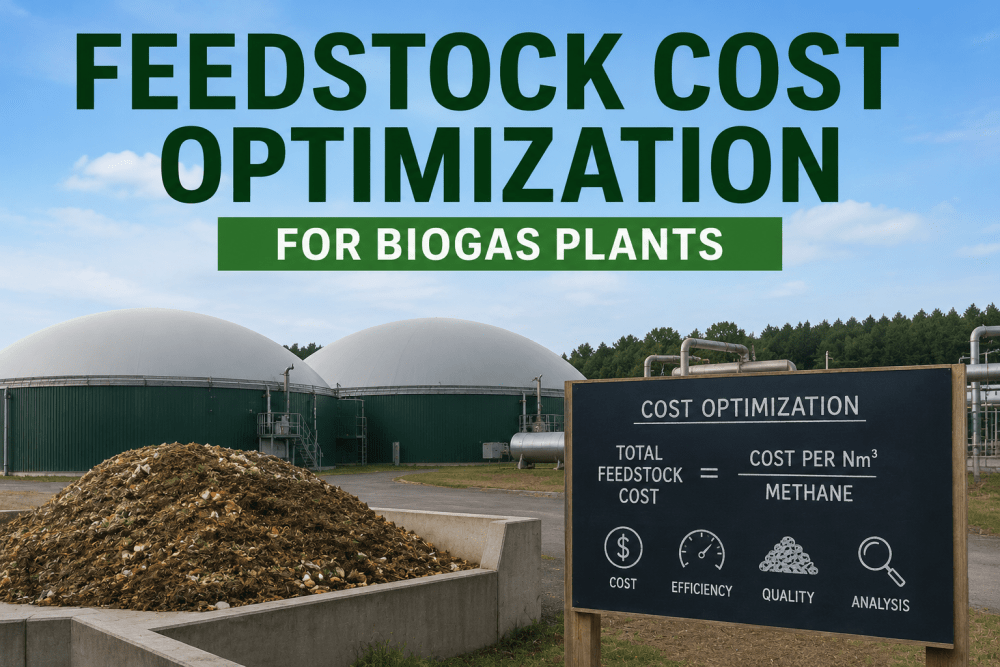
The True Cost Drivers in Biogas Feedstock Procurement
Feedstock cost cannot be evaluated on price per ton alone. The true economic metric is cost per Nm3 of methane—a calculation that depends on organic dry matter content, methane yield potential, and the biological conversion efficiency achieved in the digester. Operators who Book a demo of iFactory's feedstock analytics module discover how the platform calculates true energy-equivalent costs across their entire substrate portfolio in real time, eliminating the guesswork from procurement decisions.
Energy Crops
Corn silage offers 180–220 Nm3 CH4 per ton with consistent quality but carries high production cost, price volatility tied to commodity markets, and seasonal availability that requires ensiled storage with dry matter losses of 8–15 percent.
Agricultural Residues
Manure and straw have low or negative feedstock cost (gate fees) but deliver only 50–100 Nm3 CH4 per ton with high fiber content, requiring longer retention times and larger digester volume per unit of gas output.
Organic Waste Streams
Food waste and industrial organics generate gate fee revenue of $25–55 per ton while delivering 120–160 Nm3 CH4. However, contamination risk, seasonal composition shifts, and pretreatment requirements add operational complexity.
Fats and Greases
FOG delivers the highest methane potential at 350–500 Nm3 CH4 per ton but requires careful feed rate management to avoid LCFA inhibition, acidification, and foaming events that can destabilize the entire digester.
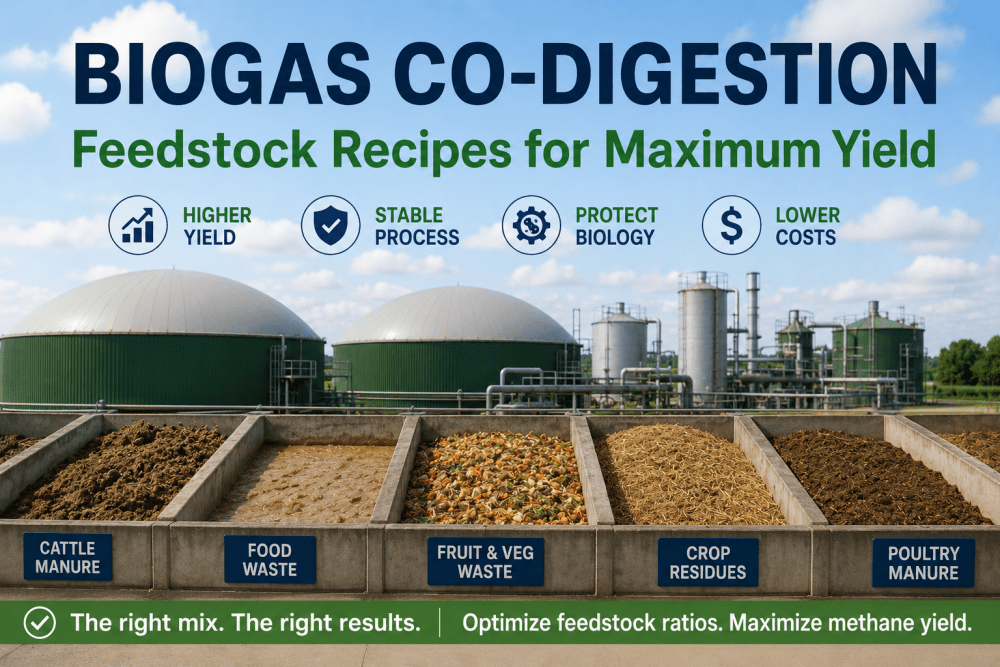
Comparative Cost Analysis of Biogas Feedstock Options
Understanding the true economics of each feedstock requires a multi-dimensional comparison that accounts for delivered cost, methane yield, digestate value, and operational impact. The table below presents a standardized cost comparison across the most commonly used biogas substrates, calculated on a cost-per-Nm3-methane basis using typical U.S. midwest pricing as of late 2025. Procurement managers who Book a demo gain access to iFactory's live feedstock cost benchmarking tool, which updates these figures with regional pricing data and plant-specific digester performance curves.
| Feedstock Type | Delivered Cost ($/ton) | Methane Yield (Nm3 CH4/ton) | Cost per Nm3 ($) | Biological Risk Level | iFactory Optimization Lever |
|---|---|---|---|---|---|
| Corn Silage | $55–70 | 200–220 | $0.28–$0.35 | Low | Dry matter preservation through moisture analytics |
| Dairy Manure | $0–15 (incl. gate fee) | 50–80 | $0.00–$0.19 | Low | Co-substrate ratio optimization for yield uplift |
| Food Waste (source-separated) | $25–55 (gate fee negative) | 130–160 | Negative cost | Medium | Contamination detection via AI vision sorting |
| Industrial Organics | $30–60 (gate fee negative) | 140–180 | Negative cost | Medium | Composition analysis for feed rate optimization |
| Fats, Oils & Greases | $0–20 | 350–500 | $0.00–$0.06 | High | LCFA inhibition prediction via causal AI models |
| Straw / Corn Stover | $35–50 | 90–110 | $0.35–$0.56 | Low | Pretreatment optimization for fiber breakdown |
"Before iFactory, our feedstock procurement was driven by gut feel and the cheapest delivered price per ton. We were optimizing the wrong metric. Once we started tracking cost per Nm3 of methane—with the platform automatically calculating energy-equivalent costs across all six of our substrates—we shifted our entire procurement strategy. In eighteen months, we reduced our average feedstock cost by 22 percent while actually increasing total gas output by 8 percent. The blend optimization recommendations alone paid for the platform in the first year."
Critical KPIs for Feedstock Cost Optimization Programs
Effective feedstock cost optimization requires tracking a specific set of leading indicators that correlate directly with plant profitability. These metrics shift the focus from procurement cost alone to the full economic equation of feedstock-to-methane conversion. Engineering and operations teams consistently report that having these KPIs available in a single dashboard transforms weekly procurement meetings from reactive price discussions into strategic blend optimization sessions.
Phased Approach to Feedstock Cost Optimization
Implementing a structured feedstock optimization program requires building capabilities in stages, with each phase delivering standalone savings while laying the foundation for the next level of sophistication. Operators who Book a demo receive a tailored implementation plan mapped to their current data infrastructure and operational maturity.
Cost Visibility and Tracking
For: Procurement Managers
- Real-time feedstock cost per ton tracking
- Energy-equivalent cost calculation (per Nm3 CH4)
- Supplier performance scorecards
- Basic blend cost optimization models
AI-Driven Blend Optimization
For: Operations Engineers
- Machine learning yield prediction models
- Dynamic blend recommendations based on pricing
- Digester health correlation and inhibition alerts
- Automated procurement decision support
Autonomous Feedstock Management
For: Plant Managers
- Closed-loop inventory replenishment triggers
- Multi-site feedstock portfolio optimization
- Market price forecasting integration
- Full gate fee revenue maximization engine
Measurable Cost Impact of Feedstock Optimization Programs
Biogas facilities implementing structured feedstock optimization programs report significant improvements across all core financial and operational KPIs. The results below reflect outcomes measured across iFactory-supported RNG and biogas plants over a 12-month post-implementation period. These figures represent the compounding effect of better procurement decisions, optimized blends, and reduced biological risk.
Reduce Feedstock Cost Per Nm3 with AI-Driven Optimization
iFactory's AI platform delivers continuous feedstock cost tracking, energy-equivalent cost calculations, and machine learning blend recommendations — purpose-built for biogas and RNG facilities.
Biogas Feedstock Cost Optimization — Frequently Asked Questions
What is the single most important metric for feedstock cost optimization?
The most important metric is cost per Nm3 of methane produced, not cost per ton delivered. A feedstock that appears expensive on a per-ton basis may actually be the most cost-effective when its methane yield and digestate value are factored in. iFactory's platform automatically calculates this energy-equivalent cost for every substrate in your portfolio, updating the calculation in real time as prices and digester performance fluctuate.
How much can AI-driven blend optimization reduce feedstock costs?
Plants using iFactory's AI-driven blend optimization typically see a 15–25 percent reduction in average feedstock cost per Nm3 within the first 12 months. The savings come from three primary sources: strategic substitution of expensive energy crops with lower-cost waste streams, improved methane yield through optimized co-substrate ratios, and reduced biological inhibition events that otherwise force expensive rebalancing cycles.
Can the platform help with gate fee negotiations for waste-derived feedstocks?
Yes. iFactory's feedstock analytics module includes a gate fee optimization tool that models the maximum gate fee you can accept for a given waste stream while maintaining target cost per Nm3. The platform factors in methane yield variability, contamination risk, pretreatment costs, and digestate impact, giving procurement teams a data-backed negotiation position with waste suppliers.
What data infrastructure is required to start tracking feedstock cost per Nm3?
The foundational requirement is basic feedstock receiving data—tonnage, cost, and type—which most plants already track in spreadsheets or ERP systems. iFactory's platform integrates with existing weighbridge software, inventory management systems, and SCADA historians. No new sensors are required for Tier 1 deployment, though adding feedstock moisture and composition sensors unlocks more advanced optimization capabilities at Tier 2.
How does the platform handle seasonal feedstock availability and price volatility?
iFactory's causal AI models incorporate seasonal patterns and historical price data to recommend forward procurement strategies. The platform can suggest building silage inventory when harvest prices are low, increasing waste stream throughput when energy crop prices spike, and maintaining minimum inventory buffers calibrated to each feedstock's supply reliability. This dynamic approach typically reduces annual feedstock spend by an additional 5–8 percent beyond static optimization alone.
The Future of Biogas Profitability Starts with Feedstock Intelligence
A 20 percent reduction in feedstock cost per Nm3 can improve plant EBITDA by 30 percent or more. iFactory's platform delivers the continuous feedstock intelligence needed to reduce cost per Nm3, maximize gate fee revenue, and stabilize digester performance — purpose-built for biogas and RNG producers ready to move from reactive procurement to strategic feedstock optimization. Book a demo to see how AI-driven feedstock analytics can transform your plant's cost structure.