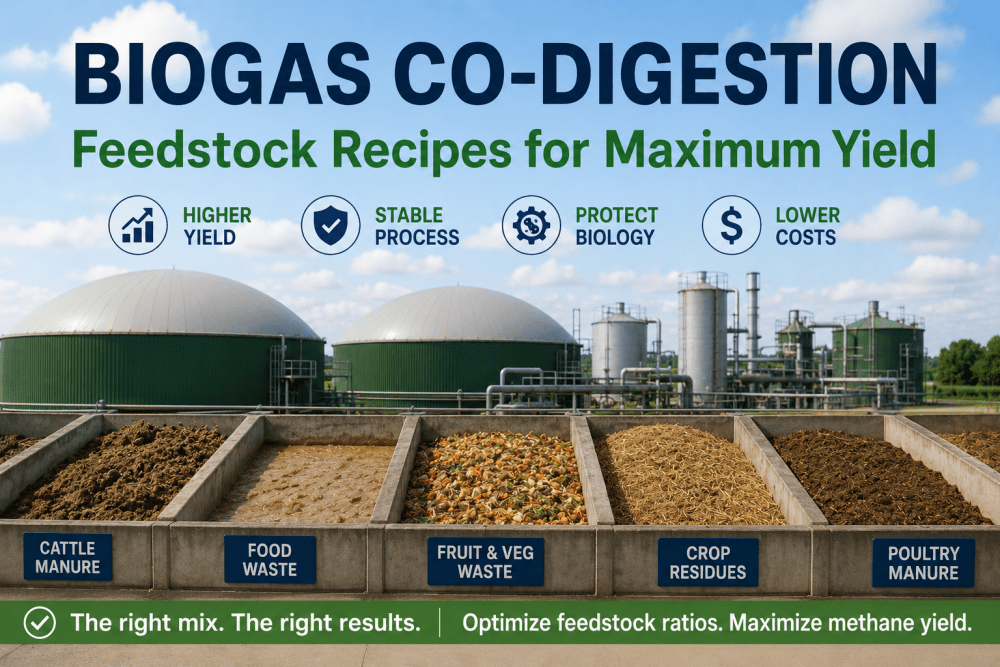
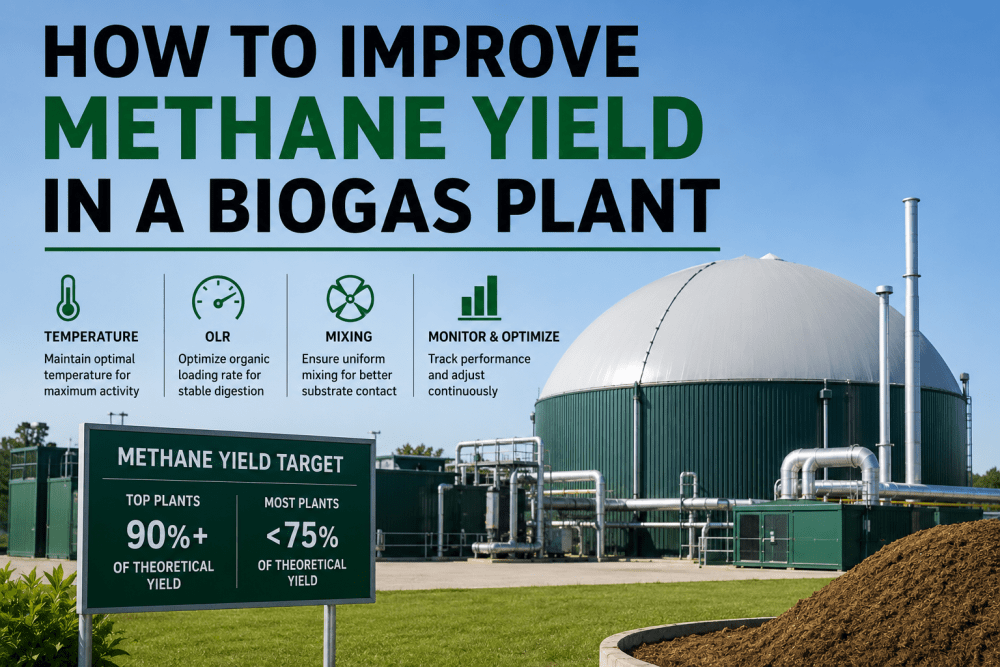
Feedstock variability is the single largest controllable driver of biogas yield loss. A C:N ratio pushed above 30:1 by an unmonitored high-carbon batch suppresses methanogen activity for 7–10 days before any operator notices reduced gas output. An OLR spike from overfeeding drives VFA accumulation that takes 2–3 weeks to correct. A low-BMP substrate substitution that looks identical by weight delivers 25–35% less methane per tonne — invisible until the weekly yield report. iFactory's feedstock optimization AI monitors every substrate input, calculates the optimal daily blend, and forecasts methane output 48 hours ahead — turning feedstock management from guesswork into a precision operation. Book a free feedstock optimization assessment.
iFactory tracks C:N ratio, volatile solids content, BMP, and ammonia inhibition risk for every substrate in your feedstock library — generating a daily blend schedule that maximizes methane yield per tonne VS while keeping OLR and digester biology within safe operating limits. Average result: 22% increase in specific methane yield, 40% reduction in inhibition events.
Feedstock Problems iFactory Detects & Corrects
Every card below represents a real yield loss that biogas plants absorb silently — because without substrate-level analytics, there is no visibility until gas output drops. Book a demo to see feedstock analytics applied to your substrate mix.
iFactory solution: Tracks incoming C:N per substrate batch, flags imbalance risk before feeding, and recommends a corrective co-substrate blend to restore the 20–30:1 optimal window.
iFactory solution: Calculates safe OLR ceiling from digester volume and current biological state, generates a daily feed schedule in tonnes per substrate type that stays within biological limits regardless of available feedstock volume.
iFactory solution: Maintains a BMP library per substrate type and supplier, correlates actual methane output to predicted BMP to flag underperforming batches, and adjusts feed volume to compensate for quality variation.
iFactory solution: Flags incoming high-nitrogen substrates before they enter the digester, calculates the safe inclusion rate, and recommends carbon-rich co-substrate additions (straw, maize silage) to dilute ammonia load.
iFactory solution: Recalculates the optimal blend each day based on available substrate inventory, price per tonne VS, and BMP data — outputting a prioritised feed schedule that maximises yield within available inputs.
iFactory solution: Calculates cost-per-kWh for every substrate type by correlating purchase price, VS content, and actual methane yield — ranking substrates by economic value and flagging procurement decisions that reduce margin per tonne of input.
iFactory connects to your weighbridge, lab systems, and SCADA to build a complete substrate intelligence layer — BMP per batch, C:N per delivery, OLR per day. Active within 4 weeks.
iFactory Feedstock Optimisation Deployment Roadmap
iFactory builds your feedstock intelligence layer in four structured phases — each delivering value before the next begins.
iFactory catalogues every substrate type in your feedstock mix — VS content, C:N ratio, BMP, ammonia risk, and historical purchase price. Existing lab data and SCADA feeding records are used to build plant-specific baseline models.
Daily blend recommendations go live — calculated from current substrate inventory, digester biological state, and OLR ceiling. Operators receive a feed schedule in tonnes per substrate type, updated each morning.
Actual methane output is correlated to predicted BMP per batch — identifying underperforming substrates and suppliers. 48-hour methane yield forecast enables CHP dispatch planning and grid export scheduling.
Cost-per-kWh ranking drives procurement decisions — substrates scored by economic yield value, not purchase price per tonne. Monthly reports track yield improvement per substrate type and identify the highest-value input streams for your specific plant.
Platform Capability Comparison — Feedstock Optimisation
Evonik Cedigaz, Agraferm, BioGasViewer, and generic SCADA historian platforms offer substrate logging and manual input tracking. iFactory differentiates on AI-driven blend optimisation, BMP-to-actual correlation, ammonia inhibition prediction, and economic yield ranking — capabilities that require multi-parameter substrate intelligence, not spreadsheet management. Book a comparison demo.
| Capability | iFactory | Agraferm | BioGasViewer | Evonik Cedigaz | Generic SCADA |
|---|---|---|---|---|---|
| Substrate Intelligence | |||||
| C:N ratio tracking per batch | Per delivery, auto-flagged | Manual entry only | Manual input | Not available | Not available |
| BMP library + actual yield correlation | Per batch, auto-updated | Static BMP table | Not available | Lab data input | Not available |
| Ammonia inhibition prediction | Pre-feed risk flag | Not available | Not available | Not available | Not available |
| Blend & OLR Optimisation | |||||
| Daily AI blend recommendation | Tonnes per substrate, daily | Manual calculation | Not available | Not available | Not available |
| OLR ceiling enforcement | Dynamic, biology-linked | Fixed threshold only | Not available | Not available | Not available |
| 48 hr methane yield forecast | Biological state model | Not available | Not available | Not available | Not available |
| Economic Intelligence | |||||
| Cost per kWh per substrate type | Auto-calculated, ranked | Not available | Not available | Not available | Not available |
| Procurement ROI ranking | Monthly report, per supplier | Not available | Not available | Not available | Not available |
Based on publicly available product documentation as of Q1 2025. Verify current capabilities with each vendor before procurement decisions.
Measured Outcomes Across Deployed Plants
iFactory's pre-deployment assessment reviews your existing feeding records, lab data, and gas output history to identify the feedstock decisions currently reducing your margin — before any software is installed.
From the Field
Frequently Asked Questions
Continue Reading
iFactory tracks every substrate batch by C:N ratio, BMP, OLR impact, and cost-per-kWh — generating daily blend schedules that maximise methane yield within your biological and economic constraints.