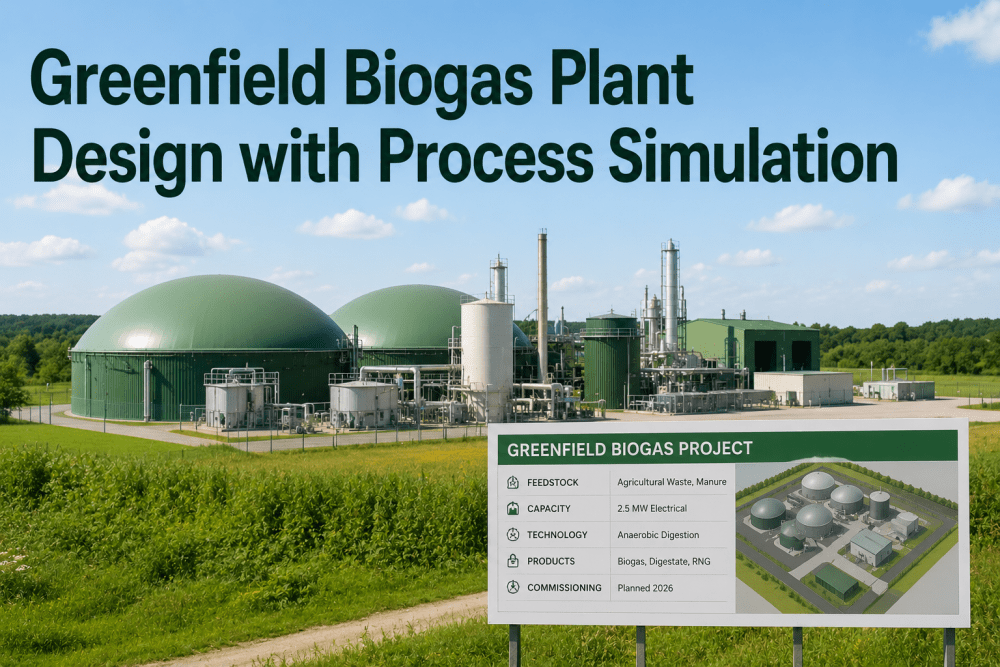
Designing a greenfield biogas plant involves capital decisions that become 10x more expensive to change after ground is broken. Facilities that have Book a demo of iFactory's process simulation engine report compressing their front-end engineering design cycle by 30–40%, eliminating costly mid-construction redesigns by identifying process bottlenecks and equipment sizing mismatches before procurement.
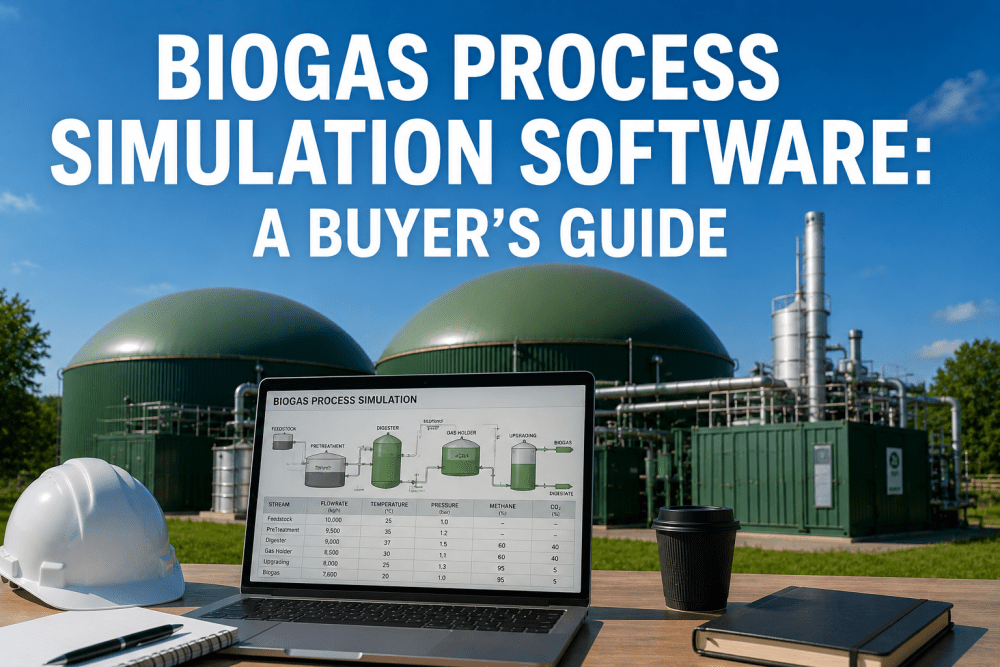
Simulate Your Biogas Plant Before You Build It
iFactory's process simulation platform models the full anaerobic digestion pathway—feedstock variability, digester kinetics, gas composition, CHP and RNG integration—so you can validate CAPEX assumptions and optimize plant layout before committing to procurement.
Five Critical Design Decisions That Process Simulation De-Risks
Greenfield biogas plant design presents a paradox: the decisions with the highest capital impact must be made with the least operational data. Without an existing facility's process history to guide sizing and configuration, engineering teams rely on heuristics, generic design factors, and vendor-supplied performance curves that may not reflect actual feedstock conditions. Book a demo
Digester Volume & Configuration
Core Decision: Sizing digester volume against organic loading rate (OLR) and hydraulic retention time (HRT). Simulation models the relationship between volume, feedstock VS concentration, and expected methane yield across seasonal temperature variation.
Gas Cleanup Technology Selection
Core Decision: Choosing between membrane separation, PSA, water scrubbing, or chemical scrubbing for H₂S and CO₂ removal. Simulation compares capital cost, methane slip, and parasitic energy load for each technology at the design biogas flow rate.
CHP vs. RNG Pathway
Core Decision: Electric generation vs. pipeline injection. Simulation models the full value chain from biogas production to revenue, accounting for electrical efficiency, heat recovery credit, RIN values, and pipeline tariff structures to determine the optimal pathway.
Feedstock Receiving & Storage
Core Decision: Receiving pit volume, solids handling equipment, and pre-digestion storage. Simulation models feedstock delivery variability, storage degradation losses, and receiving throughput requirements to avoid plant starvation or overfeeding.
Quantified Benefits of Process Simulation in Greenfield Design
The value of front-end process simulation is measurable across multiple dimensions of plant performance. Engineering teams that complete a full process simulation before issuing procurement specifications consistently report fewer change orders, tighter CAPEX compliance, and faster commissioning ,These metrics are drawn from iFactory simulation engagements across 14 greenfield biogas projects completed in the past 36 months.
Traditional Greenfield Engineering vs. Simulation-Driven Design
The table below documents the operational difference between the conventional approach to greenfield biogas plant design—spreadsheet mass balances, vendor data sheets, and heuristic sizing rules—and iFactory's simulation-driven methodology that models the full process train with validated kinetic parameters and equipment performance curves before procurement. Reliability managers who Book a demo typically focus on the reduction in post-procurement redesign events as the primary ROI driver.
| Design Dimension | Traditional Spreadsheet Approach | iFactory Simulation-Driven | CAPEX Impact | Risk Reduction |
|---|---|---|---|---|
| Mass & Energy Balance | Static spreadsheet with averaged feedstock composition; no dynamic variation modeling | Dynamic mass balance modeling feedstock variability across seasons, with sensitivity analysis per parameter | Eliminates 8–15% oversizing margin | Design validated at minimum and maximum loading conditions |
| Digester Sizing | Rule-of-thumb HRT: 20–30 days; OLR based on generic VS destruction factors | Kinetic AD model with substrate-specific degradation rates; volume optimized for target yield at design OLR | 12–18% digester volume reduction possible | HRT validated for worst-case feedstock VS concentration |
| Gas Cleanup Selection | Vendor quotes compared on nominal flow and purity claims; parasitic load estimated | Full mass balance through cleanup train; methane slip, power consumption, and off-gas treatment modeled per technology | Correct selection saves $200K–$600K | Technology matched to actual biogas composition ranges |
| Heat Integration | CHP jacket water recovery assumed; heat loss estimated from pipe length | Heat balance across digester, pasteurization, building HVAC, and gas cleanup; pinch analysis for recovery optimization | 15–25% parasitic heat load reduction | Winter operation heat deficit identified before design freeze |
| Piping & Instrumentation | P&ID development based on PFD; line sizing from average flow with safety margin | Hydraulic simulation for line sizing at peak and minimum flow; valve Cv and instrument range validated | Reduces instrumentation rework by 40% | Control valve rangability confirmed for turndown conditions |
| Digestate Handling | Belt press or centrifuge sized on average solids load; storage volume from rule of thumb | Solids separation modeled per technology; storage requirement calculated from land application window and crop nutrient plan | Storage volume optimized to actual need | Compliance with nutrient management plan confirmed before construction |
Phased Approach: From Feedstock Characterization to Commissioning Support
iFactory's greenfield biogas simulation engagement follows a structured progression that aligns with the project's FEED, detailed engineering, and commissioning phases. Each phase delivers specific decision-support outputs that reduce risk and compress the overall project timeline. Engineering firms and plant developers who Book a demo receive a phased simulation scope tailored to their project's current stage of development.
Feedstock Characterization & Base Model
Feedstock sampling and compositional analysis (TS, VS, COD, TKN, trace elements). AD kinetic model parameterization using BMP test results. Base process model constructed with preliminary mass and energy balances. Timeline: 3–4 weeks.
Design Optimization & Sensitivity Analysis
Multi-scenario simulation for digester sizing, gas cleanup selection, CHP vs. RNG economics, and heat integration optimization. Sensitivity analysis on feedstock variability, temperature, and loading rate. Equipment datasheet generation. Timeline: 5–8 weeks.
Detailed Engineering & Commissioning Support
Hydraulic simulation for P&ID validation, control valve sizing, instrument range determination. Operating manual development from simulated startup, normal operation, and upset scenarios. On-site commissioning support with model updates from as-built data. Timeline: Ongoing through commissioning.
"We used spreadsheet mass balances for greenfield biogas designs for 15 years because that was the industry standard. Every project had the same story: the digester was oversized by 15–20% because we couldn't quantify the feedstock variability risk, the gas cleanup train was spec'd based on vendor promises rather than actual composition data, and the heat balance assumed summer conditions year-round. The change orders during construction were accepted as unavoidable. iFactory's process simulation changed that completely. On our most recent 3 MW food waste AD project, the simulation identified that our design OLR was 18% below the economically optimal rate given the actual feedstock VS data—a finding that no spreadsheet model would have revealed. Book a demo ."
The Cost of a Missed Design Iteration Is 10x Higher After Procurement
Greenfield biogas plant design is a sequence of decisions where the cost of correction compounds at each stage. A feedstock characterization error caught during FEED costs a laboratory fee and two days of engineering time. The same error caught during detailed engineering requires a digester volume recalculation, updated mass balance, and three weeks of rework. Caught during construction, it triggers a change order for tank modification and schedule delay. Book a demo to see iFactory's greenfield biogas simulation platform applied to your project's feedstock and site conditions.
Validate Your Biogas Plant Design Before You Break Ground
iFactory's process simulation platform provides the mass balance, kinetic modeling, and equipment validation that greenfield biogas projects need to eliminate costly redesigns and compress the FEED-to-commissioning timeline.
Frequently Asked Questions
Process simulation should begin with pre-FEED, as soon as feedstock sampling data becomes available and before any digester sizing or equipment selection decisions are made. The simulation model is most valuable when it can influence the full set of design parameters—digester volume, gas cleanup technology, heat integration strategy—before any procurement specification is issued. Starting simulation at the FEED stage still provides significant value for equipment validation and P&ID development, but the CAPEX optimization benefit is reduced by approximately 40% because the major equipment sizing decisions have already been made.
A minimum of 4–6 representative feedstock samples analyzed for total solids, volatile solids, COD, TKN, pH, alkalinity, and trace elements (nickel, cobalt, selenium, molybdenum) is required. Biochemical methane potential (BMP) testing on each feedstock type provides the kinetic degradation parameters—hydrolysis rate constant, maximum methane production rate, and lag phase duration—that the AD kinetic model needs to predict yield at the design OLR.
The simulation model evaluates both pathways through a full mass and energy balance connected to a financial model. For CHP, the model calculates electrical output from biogas flow and methane concentration at the engine inlet, thermal recovery from jacket water and exhaust, and parasitic electrical and thermal loads to determine net exportable energy.
Yes. The simulation model is delivered as a living document that is updated at each project phase. During construction, as-built equipment specifications and supplier performance curves replace the preliminary design data used in FEED, allowing the model to serve as the commissioning reference for acceptance testing.
For a typical greenfield biogas plant in the 1–5 MW electrical equivalent or 100–600 scfm RNG range with a single feedstock stream, the full simulation engagement runs $45,000–$90,000 over an 8–14 week timeline. The scope covers feedstock characterization and BMP testing