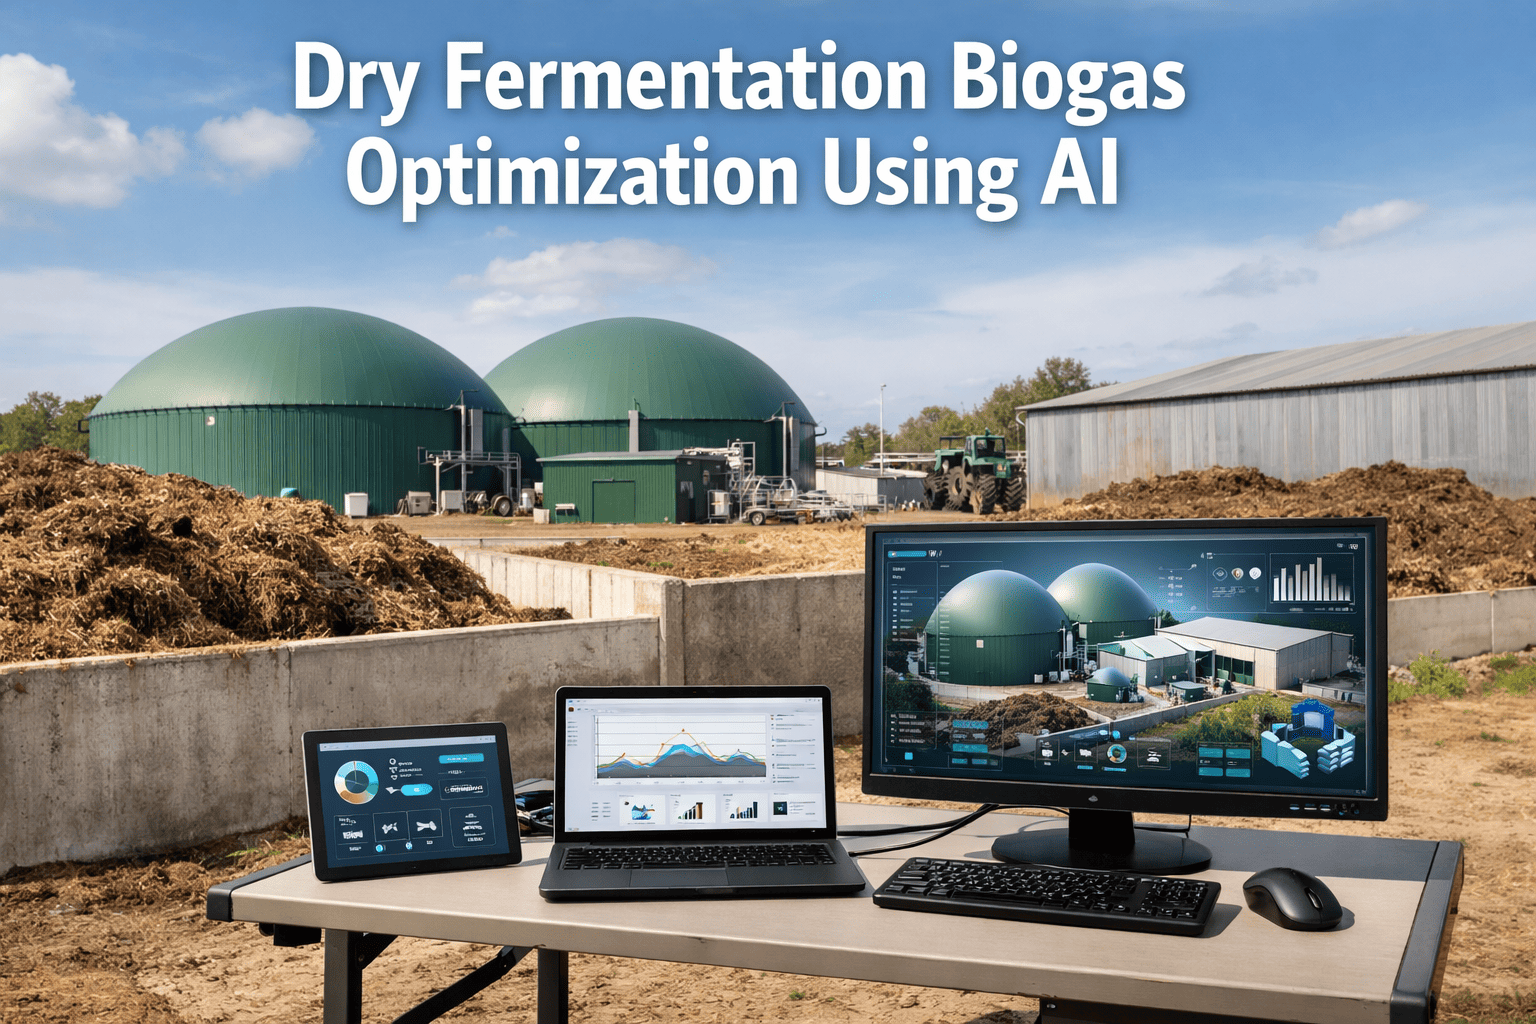
Dry fermentation biogas systems — garage-type batch reactors, tunnel digesters, and plug-flow systems processing straw, green waste, food scraps, and agricultural residues at 20–45% total solids — operate at the extreme edge of anaerobic digestion process stability, where feedstock heterogeneity, percolate distribution failures, and temperature stratification create volatile fatty acid accumulation events that crash biological activity silently over 2–4 weeks before operators detect any visible process upset. A single inhibition event in a dry fermentation system costs $22,000–$41,000 in lost biogas production during the 3–6 week biological recovery period, $8,000–$14,000 in remediation inputs (buffer additives, inoculum reintroduction, percolate recirculation adjustments), and 45–90 days of reduced throughput capacity while biological populations restabilize on high-solids substrate.Book a demo to see dry fermentation optimization for your reactor configuration.
Quick Answer
iFactory's AI dry fermentation optimization analyzes real-time biogas production curves (monitoring hourly production rate deviations from expected batch progression curves), percolate recirculation chemistry (pH, VFA concentration inferred from conductivity, alkalinity ratios), temperature distribution across reactor zones (detecting stratification events that create anaerobic dead zones), and feedstock loading composition to identify biological instability before inhibition develops. When process deviation is detected, the system auto-generates intervention recommendations — percolate pH buffering quantities, recirculation rate adjustments, temperature setpoint corrections — that restore optimal methanogenic conditions before VFA accumulation crosses inhibitory thresholds. Result: 84% reduction in unplanned batch terminations, 38% extension of stable reactor run-time per batch, 22% improvement in specific biogas yield (m³ per tonne feedstock), and $520,000 average savings per dry fermentation facility over 36-month deployment from eliminated process failures and optimized feedstock utilization.
How AI Dry Fermentation Optimization Works
The workflow below shows the five-stage monitoring and intervention process iFactory applies continuously across every batch reactor, garage digester, and tunnel fermentation system handling high-solids organic feedstocks where traditional wet digestion monitoring approaches fail.
1
Feedstock Characterization & Batch Baseline
System establishes expected production profile for each batch based on feedstock composition: total solids content (20–45% TS), volatile solids fraction (biological conversion potential), C:N ratio (nitrogen balance predicting ammonia inhibition risk), and inoculum ratio (digestate recycled per tonne fresh feedstock). Expected biogas production curve generated for full 28–56 day batch duration — showing daily production targets, methane percentage trajectory, and cumulative yield milestones at day 7, 14, 21, and batch end. Baseline accounts for seasonal temperature impacts on hydrolysis rate and feedstock variability between deliveries.
TS: 32% measuredVS: 88% of TSExpected: 142 m³/tonne VS
2
Process Deviation Detection
AI monitors for instability indicators across four data streams: biogas production rate falling more than 18% below expected batch curve for 24+ consecutive hours (hydrolysis inhibition or methanogen suppression), percolate pH dropping below 7.0 (VFA accumulation acidifying system), temperature deviation exceeding ±3°C from setpoint in any reactor zone (stratification creating cold dead zones), and methane percentage declining from typical 52–58% range toward 44% or below (methanogenic activity disruption). Batch day-14 alert: production rate 24% below curve, percolate pH 6.8 (dropping from 7.4 over 72 hours).
Production: −24% vs curvePercolate pH: 6.8 (falling)CH₄: 49% (declining)
3
Root Cause Diagnosis
System correlates deviation patterns with probable causes: VFA accumulation from overloaded hydrolysis (feedstock TS too high for current inoculum ratio), ammonia inhibition from nitrogen-rich feedstock (poultry manure, food waste protein content causing free ammonia above 3.0 g/L NH₃-N), temperature failure in heating system causing metabolic rate collapse, or percolate distribution blockage creating dry zones with no biological activity. Batch diagnosis: feedstock batch contained 34% poultry litter versus standard 18% — elevated nitrogen loading driving ammonia accumulation, percolate pH drop confirming VFA imbalance secondary to NH₃ inhibition. Reactor temperature: uniform, no stratification. Percolate distribution: operating normally.
Temperature: Uniform ✓Percolate Flow: Normal ✓NH₃ Loading: Elevated
4
Targeted Intervention Recommendation
AI calculates minimum corrective intervention to restore biological equilibrium. Ammonia inhibition protocol: increase percolate recirculation volume by 40% to dilute free ammonia concentration, add 180 kg lime per 1,000 m³ reactor volume to percolate tank to raise pH toward 7.6–7.8 and precipitate ammonium, reduce percolate temperature setpoint from 38°C to 35°C (lower temperature reduces free ammonia fraction from total ammoniacal nitrogen). Alert delivered to operator: recommended interventions, predicted pH recovery timeline (5–8 days), expected production rate return to normal batch curve by day 22–24. No batch termination required if intervention implemented within 48 hours.
+40% Percolate Volume180 kg Lime / 1,000 m³Temp: 38°C → 35°C
5
Recovery Verification & Batch Completion
Operator implements interventions. System monitors recovery trajectory: percolate pH climbs from 6.8 to 7.3 over 6 days, biogas production rate returns to within 8% of expected batch curve by day 23, methane content recovers to 53% by day 26. Batch continues to day 52 (extended from original 42-day plan to compensate for production deficit during inhibition period). Final cumulative yield: 128 m³/tonne VS versus 142 m³/tonne VS target — 10% below optimal due to early inhibition period, but 67% better outcome than typical undetected ammonia crash requiring full batch termination at day 16. Next batch: AI recommends reducing poultry litter fraction to 20% maximum, increasing inoculum ratio 15% to buffer nitrogen loading.
Intervention implemented day 14. pH recovered to 7.3 by day 20. Production resumed normal trajectory day 23. Batch completed day 52 — 128 m³/tonne VS yield. Batch termination avoided. $38,000 loss prevented. Feedstock recommendations updated for next loading.
AI Dry Fermentation Optimization
Stop Losing Batches to Silent Process Failures — AI Detects Instability Before Biological Crash
See how iFactory analyzes biogas production curves, percolate chemistry, temperature distribution, and feedstock composition to identify dry fermentation instability — triggering targeted interventions that restore biological equilibrium before VFA accumulation reaches inhibitory thresholds.
84%
Fewer Unplanned Batch Terminations
38%
Stable Run-Time Extension per Batch
Six Process Failure Modes AI Optimization Prevents
Each card represents a real dry fermentation failure scenario that causes batch termination, biological process loss, and reactor downtime in biogas plants. These failures occur because traditional monitoring — periodic percolate pH checks, manual biogas spot measurements, visual feedstock inspection — cannot detect instability until biological damage is severe and batch recovery is impossible. Talk to an expert about your current process challenges.
VFA Accumulation — Hydrolysis-Methanogenesis Imbalance
High-TS feedstock batch (38% total solids, agricultural straw mixed with food waste) loaded at inoculum ratio of 1:1.8 (digestate:fresh feedstock by weight). Hydrolysis bacteria degrade solids rapidly in first 7 days, generating volatile fatty acids faster than methanogenic archaea can convert them to biogas. VFA accumulation begins — acetic acid, propionic acid build up in percolate, driving pH from 7.6 to 6.4 over 10 days. Operators check pH weekly — by the time pH drop is measured at day 14, VFA concentration has reached 8,200 mg/L (inhibitory threshold approximately 4,000 mg/L). Methanogens severely suppressed — biogas production collapses from 420 m³/day to 85 m³/day. Batch terminated at day 18, $44,000 lost in production and remediation.
Ammonia Inhibition — Nitrogen-Rich Feedstock Overloading
Dry fermentation plant accepts poultry litter opportunistically — available at low cost when conventional agricultural customer cancels contract. Operator loads 3 of 6 garage reactors with 45% poultry litter blend (versus standard 15% maximum). Free ammonia concentration in reactors climbs to 4.2 g NH₃-N/L at 37°C operating temperature — well above 3.0 g/L inhibitory threshold for acetoclastic methanogens. Biogas methane content drops from 55% to 41% as CO₂ production continues but methane formation is inhibited. Operators notice "lower biogas quality" but attribute it to feedstock variation, make no intervention. After 3 weeks of ammonia inhibition, methanogenic populations severely depleted — even after ammonia levels normalize, biological recovery takes 6–8 weeks. Three reactors produce 60% below target yield for entire batch cycle, $67,000 total losses.
Percolate Distribution Failure — Dry Zone Formation
Tunnel reactor (52m long, 6m wide, 4m tall) operates percolate sprinkler system on 4×/day automatic cycle. Sprinkler nozzle at position 38m from entrance becomes partially blocked with fibrous material from straw feedstock — reducing spray coverage by 70% in the rear 14 meters of tunnel. Operators cannot observe interior during active fermentation (gas-tight sealed). Dry zone develops over 10 days: feedstock in rear section loses biological activity as percolate (carrying moisture, nutrients, and buffering capacity) no longer reaches this zone. Biogas production drops 28% from expected — operators increase heating to compensate, unknowingly accelerating moisture evaporation in the dry zone. After 3 weeks, 14-meter dry zone completely inactive — 27% of reactor volume producing zero biogas. Batch terminates at 68% of target yield. Nozzle blockage only discovered during post-batch inspection.
Temperature Stratification — Heating System Partial Failure
Garage reactor (22m × 8m footprint) heated via floor heating pipes circulating hot water at 42°C. One of three floor heating zones develops partial blockage — circulation pump still operates but flow rate reduced 65% in zone 2 (middle third of reactor floor). Average reactor temperature measured at single wall-mounted sensor remains 37°C — operators see no alarm. Zone 2 floor temperature drops to 28°C over 4 days as reduced flow delivers insufficient heat through substrate depth of 2.5 meters. Biological activity in middle zone slows — at 28°C, methanogenic activity is 40% of optimum compared to 37°C. Biogas production declining across days 11–18 attributed to normal "mid-batch curve plateau." By day 21, temperature-induced biological stratification has created 3 distinct zones with different conversion rates, overall production 31% below target. Floor heating blockage only found during annual maintenance inspection 4 months later.
Inoculum Insufficiency — Low Methanogen Population at Batch Start
Plant expands capacity — adds two new garage reactors (reactors 7 and 8) while existing reactors 1–6 are fully loaded mid-batch. Available digestate inoculum limited — operators reduce inoculum ratio from standard 1:2.0 to 1:3.5 (digestate:fresh feedstock) to stretch available material across new reactors. Methanogenic population in new reactors insufficient to handle hydrolysis products from day 3 onward — VFA accumulates immediately as small methanogen population cannot keep pace. Reactors 7 and 8 enter acidification within 8 days of loading: pH drops to 6.2, biogas production negligible, methane content only 28% (mostly CO₂ from acid-forming bacteria). Emergency remediation requires sourcing 180 m³ additional digestate inoculum from neighboring facility at €4,200 transport cost, plus 3-week biological recovery period, $51,000 total batch losses across both reactors.
Late-Batch Desiccation — Moisture Loss in Extended Runs
Tunnel digester batch extended beyond planned 42-day duration — biogas production still active at day 40 (good yield batch), operators decide to continue to day 56 to maximize extraction. Percolate recirculation rate maintained at standard 42-day program volume — not adjusted upward to compensate for additional evaporation losses over extended run. By day 48, substrate moisture content in upper layers drops below 40% (minimum biological activity threshold), reducing to 32% in exposed top 0.6 meters by day 52. Biological activity in upper substrate layer ceases — feedstock desiccated in place. Lower layers retain adequate moisture and continue producing but overall batch efficiency drops 22% in final 12 days. Extended run delivers only 8% more total biogas than 42-day termination would have produced — not worth operational cost or feedstock retained in reactor. Desiccation damage (dead biological material in upper layer) reduces next batch inoculation effectiveness.
Monitoring Parameters & Process Signatures
iFactory tracks four primary data streams to distinguish dry fermentation process states — normal progression, early instability, active inhibition, and recovery — and identify the specific failure mode (VFA accumulation, ammonia inhibition, temperature failure, distribution blockage, inoculum insufficiency) for accurate, targeted intervention recommendations.
Gas meter logs daily production volumes and compares against expected batch progression curve (bell-curve profile: rising days 1–8, peak days 9–18, gradual decline days 19–batch end for typical agricultural dry fermentation). AI identifies: early-peak deviation (VFA accumulation causing premature rate spike then crash), flat-line period (temperature or distribution failure creating dead zones), and extended-tail patterns (moisture-limited late-batch extraction). Methane percentage monitored separately — declining CH₄% with stable total biogas volume indicates methanogen suppression, rising CO₂ fraction confirms acidification. Alert threshold: 18%+ deviation from expected curve sustained for 24+ hours.
Normal: ±12% of curveAlert: −18% sustained 24hrCritical: −35% or CH₄ <44%
pH sensors in percolate collection sump log continuous readings (target range 7.2–8.2 for dry fermentation). Electrical conductivity sensor provides indirect VFA indicator — conductivity rising above baseline correlates with organic acid accumulation before pH is affected (methane production's alkalinity buffering masks early VFA increases). Alkalinity consumption rate calculated from pH trend velocity — rapid pH decline rate (more than 0.3 pH units per 48 hours) indicates buffer capacity depleted, active inhibition underway. Temperature-adjusted free ammonia calculated from total ammoniacal nitrogen (if sampled weekly) and pH/temperature data — predicts inhibition risk without continuous NH₃ sensor.
Target pH: 7.2–8.2Alert: pH <7.0 or >8.5Critical: pH <6.5 or drop >0.3/48hr
Distributed temperature sensors (4–8 per reactor depending on size) at substrate mid-depth and floor level track spatial temperature distribution. Exothermic fermentation biology generates +1.5–3.0°C above ambient in active zones — temperature uniformity confirms even biological activity across reactor volume. Zone temperature deviating more than 3°C from reactor average indicates: heating system partial failure (zone colder than average), percolate distribution blockage (exothermic activity absent in dry zone), or biological inhibition in localized area. Temperature-time integration calculates cumulative thermal exposure — predicts residual biological activity and optimal batch termination timing based on remaining methanogen population health.
Target: 35–40°C mesophilicStratification Alert: ±3°C zone deviationBiological Indicator: +1.5–3°C exotherm
Feedstock characterization data entered at batch loading (TS%, VS%, C:N ratio, feedstock type mix) feeds predictive model that calculates: expected biogas yield (m³/tonne VS), ammonia inhibition risk score (0–10 scale based on nitrogen content and planned reactor temperature), optimal inoculum ratio for stable start-up, and VFA accumulation risk during peak hydrolysis phase (days 5–12). Model compares actual batch inputs against historical performance database — identifies batches with unusual feedstock combinations that require modified operating protocols before biological problems develop. Seasonal feedstock composition tracking predicts quality shifts 3–6 weeks ahead from historical supplier patterns.
Yield Model: ±8% accuracyNH₃ Risk: 0–10 pre-load scoreVFA Risk: Predicted peak day
Intervention Strategy & Process Stabilization
When process deviation is detected, iFactory calculates minimum-cost interventions targeting the specific root cause — buffering additive quantities, recirculation adjustments, temperature corrections — with predicted outcome timelines so operators can make informed decisions without process chemistry expertise.
1
VFA Accumulation — Alkalinity Buffering Calculation
Percolate pH dropping at rate indicating buffer capacity depletion: system calculates bicarbonate demand from pH trend, percolate volume, and estimated VFA load. Example: pH 6.9, dropping 0.15 units/day, percolate tank 85 m³ — system calculates 240 kg sodium bicarbonate or 180 kg lime required to restore pH 7.4–7.6 and provide 14-day buffer capacity. Intervention also includes increasing recirculation frequency from 3×/day to 5×/day to distribute buffering agent throughout substrate mass.
2
Ammonia Inhibition — Temperature & Dilution Protocol
Free ammonia concentration is temperature and pH dependent: NH₃ = TAN × [1 / (1 + 10^(pKa−pH))] where pKa decreases with temperature. Reducing reactor temperature from 38°C to 33°C can decrease free ammonia fraction by 30–38% with no feedstock changes. System calculates: "Temperature reduction 5°C → NH₃ reduction from 3.8 to 2.4 g/L. Heating energy saving: 18%. Biological activity reduction: 12% (acceptable). Implement immediately to prevent further inhibition." Simultaneously recommends increased percolate recirculation to dilute ammoniacal nitrogen concentration in pore water.
3
Dry Zone Recovery — Targeted Percolate Redistribution
When spatial temperature anomaly identifies probable dry zone, system recommends targeted intervention: "Increase percolate application to zones 7–9 by 150% for 72 hours to restore moisture to biological activity threshold (minimum 55% substrate moisture). If sprinkler system allows zone control, redirect volume from zones 1–3 (adequately moist) to zones 7–9. After 72 hours, confirm temperature signature normalization in affected zones before returning to standard distribution program." Biological activity recovery expected within 4–7 days of moisture restoration.
4
Batch Extension Optimization — Yield vs Duration Modeling
As batch approaches planned termination date, system models remaining production potential: "Current batch day 40 of 42 planned. Biogas production rate 68 m³/day (above 45 m³/day economic threshold). Projected production days 43–50: 380 m³ total additional. Estimated reactor opportunity cost of 8-day extension: 0.62 batches foregone. Recommendation: extend to day 48, terminate when daily rate falls below 45 m³/day threshold. Increase percolate 28% to prevent late-batch desiccation. Estimated additional yield value: €2,840 versus €380 additional operating cost — net benefit €2,460." Operator approves extension with automatic termination trigger set.
Predictive Process Protection
Maximize Every Batch — Detect Dry Fermentation Instability 30 Days Before Process Failure
iFactory's dry fermentation optimization analyzes biogas curves, percolate chemistry, temperature distribution, and feedstock composition in real-time — identifying process deviation within 72–120 hours and recommending targeted interventions that restore biological equilibrium before irreversible inhibition occurs.
$520K
Avg Savings per Facility (36mo)
84%
Reduction in Batch Terminations
Platform Comparison — Dry Fermentation Process Monitoring
Generic SCADA systems log temperature and gas meter totals but provide no batch curve comparison, no root cause analysis for production deviations, and no intervention recommendations. Agricultural biogas platforms designed for wet digestion (CSTR reactors) lack batch-mode modeling and high-solids process signatures unique to dry fermentation. iFactory differentiates on dry fermentation-specific batch curve modeling, multi-parameter instability detection, feedstock composition risk scoring, and intervention quantification for non-expert operators.
| Capability |
iFactory |
Generic SCADA |
Wet Digestion Platform |
CMMS Only |
| Process Monitoring |
| Batch curve deviation detection | AI batch progression model | Raw totals only | Continuous-mode only | Not available |
| Percolate chemistry trending | pH + conductivity + alkalinity | pH logging only | pH + basic chemistry | Not available |
| Multi-zone temperature analysis | Spatial distribution mapping | Single point average | Single point average | Not available |
| Root Cause Analysis |
| VFA accumulation detection | Conductivity proxy + pH trend rate | Not available | pH only, no trend rate | Not available |
| Ammonia inhibition risk scoring | Pre-load predictive model | Not available | Not available | Not available |
| Feedstock composition impact | C:N, TS, VS modeling | Not available | Basic loading calculation | Not available |
| Intervention & Optimization |
| Buffering additive quantity calculation | Automated from pH trend | Manual calculation | Manual calculation | Not available |
| Batch extension yield modeling | Economic optimization model | Not available | Not applicable | Not available |
| Post-intervention recovery tracking | Automated confirmation | Manual monitoring | Manual monitoring | Not available |
Regional Compliance & Safety Standards
iFactory's dry fermentation monitoring system provides documentation and alert configurations aligned with regional environmental, operational safety, and digestate quality standards governing dry fermentation biogas facilities in primary markets.
| Region |
Compliance Framework |
iFactory Coverage |
| Germany |
EEG renewable energy feed-in requirements, BioAbfV biowaste ordinance for feedstock traceability, Gärrestqualität digestate quality standards, TA Luft emissions limits for biogas facilities, ATEX equipment certification for classified zones |
Batch production records for EEG compliance documentation, feedstock composition logging for BioAbfV traceability, process stability data supporting digestate quality certification, ATEX-rated sensors available for gas-zone installations, continuous emissions-relevant data logging |
| United Kingdom |
Environment Agency permits for dry fermentation facilities, Anaerobic Digestion Quality Protocol for digestate certification, HSE PUWER equipment safety regulations, Permitted Development rights for agricultural biogas, PAS 110 digestate standard compliance |
Process stability documentation supporting PAS 110 digestate quality certification, equipment monitoring records for PUWER compliance, batch production data for EA permit reporting, automated alerts preventing permit condition violations from process upsets |
| United States |
EPA Clean Air Act permits for biogas facilities, state-level solid waste handling permits for high-TS feedstocks, OSHA 1910.119 PSM requirements where applicable, state renewable energy portfolio standard documentation requirements |
Process monitoring data for air quality permit compliance, automated feedstock and production records for state solid waste requirements, PSM-relevant process documentation, batch yield data for renewable energy credit documentation |
| Netherlands / Benelux |
SDE+ renewable energy subsidy documentation requirements, Activiteitenbesluit environmental activity decree, NTA 8003 biogasstandaard, provincial environmental permits for dry fermentation installations, EU Nitrates Directive for digestate land application |
Automated production logging for SDE+ subsidy documentation, continuous process records for Activiteitenbesluit compliance, digestate quality data supporting NTA 8003 certification, nitrogen balance tracking for Nitrates Directive compliance |
| European Union |
EU Taxonomy Regulation requirements for sustainable biogas operations, Industrial Emissions Directive for qualifying facilities, EU Organic Regulation for organic waste digestate certification, ATEX Directive for equipment in explosive atmospheres, CE marking requirements |
Taxonomy-compliant sustainability documentation from process data, IED permit condition monitoring and reporting, organic certification process data, ATEX-compliant monitoring hardware, GDPR-compliant data handling across all EU member state deployments |
Implementation Roadmap — 4 Phases to Full Deployment
Most dry fermentation facilities achieve complete process monitoring coverage across all reactors within 14–22 days from initial sensor installation to live AI batch monitoring with automated intervention recommendations.
Phase 1
Reactor Survey & Sensor Installation
Site survey maps all active reactors (garage, tunnel, or plug-flow), percolate systems, gas collection infrastructure, and heating circuits requiring monitoring. Sensors installed: temperature probes at substrate mid-depth and floor level (4–8 per reactor), pH and conductivity sensors in percolate collection sumps, gas flow meters on each reactor gas outlet, heating circuit flow sensors. Installation completed on empty reactors between batches — zero production interruption for existing active batches. Sensor cabling routed to weatherproof data acquisition enclosures mounted at reactor exterior.
Duration: 3–6 days including site survey
Phase 2
Baseline & Historical Calibration
AI batch models calibrated using two inputs: historical batch data (if available — production totals, pH logs, batch duration records from previous 6–18 months), and feedstock characterization data for typical inputs (TS%, VS%, C:N ratio for each feedstock type received). If historical data available, system validates model predictions against actual outcomes before going live — adjusting yield coefficients and instability thresholds to match specific plant biology and feedstock mix. Plants without historical data begin live monitoring on next batch, with models self-calibrating over first 2–3 complete batch cycles.
Duration: 3–5 days calibration + first batch learning
Phase 3
Alert Configuration & Operator Training
Alert thresholds configured per reactor type and feedstock profile: garage reactors with stable feedstock get standard sensitivity thresholds; reactors handling variable mixed waste streams get higher sensitivity with earlier warning windows. Operator notification routes configured (SMS to on-call mobile, email to plant manager, dashboard alert on control room display). Intervention recommendation format customized — additive quantities displayed in units operators use (kg, bags, tank fill levels), not chemistry calculations. Training: 3-hour session covering batch curve interpretation, alert escalation workflow, intervention implementation procedures, and system dashboard navigation.
Duration: 2–4 days including operator training
Phase 4
Live Monitoring & Continuous Improvement
System enters production monitoring across all reactors: continuous batch curve tracking, percolate chemistry trending, temperature distribution analysis, and feedstock composition modeling at batch loading. First intervention recommendation typically occurs within first 2–3 batch cycles — either a process deviation on an active batch or a pre-load feedstock composition warning before next loading. Operators implement recommendations, system verifies biological response, model accuracy improves. After 6 months, system has batch-specific performance history for each reactor and feedstock combination — enabling increasingly precise predictions and earlier detection of facility-specific instability patterns.
Ongoing: Continuous batch monitoring & model refinement
Measured Outcomes — Dry Fermentation Facilities with AI Optimization
84%
Reduction in Unplanned Batch Terminations
38%
Stable Run-Time Extension per Batch
72 hrs
Average Early Detection Window
22%
Specific Biogas Yield Improvement
$520K
Avg Savings per Facility (36 months)
42–58 days
Stable Batch Run vs 28–35 Day Baseline
"We had a 6-garage dry fermentation plant that was losing one complete batch every 4–5 months to acidification crashes — we just accepted it as the cost of processing variable mixed green waste. After iFactory deployment, the system caught a developing VFA accumulation event in garage 4 on day 9 — biogas curve deviation we never would have noticed until the pH crash at day 16 or later. The alert recommended bicarbonate addition and increased percolate frequency, we implemented it immediately, and the batch not only recovered but ran 11 days longer than our standard cycle with excellent yield in the final week. More valuable was the pre-load ammonia risk scoring — it flagged a high-nitrogen poultry litter delivery before we loaded it at full proportion, saved us from what would have been an almost certain inhibition event in 3 reactors. We have not terminated a batch early in 26 months. The system paid back its full cost in the first prevented crash."
Plant Director
2.4 MW Dry Fermentation Biogas Facility — Mixed Green & Agricultural Waste — Netherlands
Frequently Asked Questions
QHow does iFactory distinguish VFA accumulation from normal batch-phase production variation in dry fermentation systems?
VFA accumulation produces a specific combination signature: biogas production rate above expected batch curve (accelerated hydrolysis generating excess acids) followed by rapid decline, concurrent percolate pH drop, and conductivity increase — all three deviating simultaneously. Normal batch variation shows production deviations without pH or conductivity changes. The multi-parameter correlation eliminates false positives from single-sensor noise.
See signature differentiation in a demo.
QCan the system handle the feedstock variability typical in dry fermentation — different waste streams, seasonal composition changes, variable moisture content?
Yes. The batch model is rebuilt for each loading event based on feedstock characterization data entered at batch start. System maintains separate performance histories for each feedstock combination — green waste batches, agricultural residue batches, and mixed food waste batches each have their own baseline models. Seasonal composition variations are tracked over multiple batch cycles and incorporated into expected curve adjustments automatically.
QWhat happens if we don't have historical batch data — can the system still provide value from day one?
Yes. For plants without historical data, the system uses published dry fermentation literature models for the relevant feedstock types as starting baselines, then refines these with actual plant data over 2–3 complete batch cycles. Most interventions remain valid even on first-batch monitoring — temperature distribution failures, percolate pH crashes, and distribution blockages are detected from sensor patterns regardless of historical data availability.
Book a demo to discuss your specific feedstock situation.
QHow does the system handle the sealed, gas-tight nature of dry fermentation reactors — can sensors actually be installed without breaking containment?
Sensors are installed through purpose-designed pressure-rated penetrations at reactor walls — industry-standard practice for temperature probes, pressure transmitters, and gas sampling lines in dry fermentation. Percolate chemistry sensors install in the external percolate sump (accessible without reactor entry). All sensor entry points meet ATEX requirements for gas-tight installations in classified zones. Existing penetrations often sufficient — survey identifies available access points before installation design is finalized.
QCan iFactory integrate with our existing SCADA or plant control system to avoid separate dashboards?
Yes, via standard protocols including Modbus TCP/IP, OPC-UA, and MQTT for data exchange with existing SCADA, DCS, or building management systems. iFactory can both receive data from existing plant sensors (avoiding duplicate hardware) and push alert signals back to SCADA alarm systems for integration with existing operator notification workflows. API access available for custom integrations.
Talk to an integration specialist about your current system.
QWhat is the typical cost saving from preventing one complete batch termination in a dry fermentation system?
Single batch termination: $22,000–$41,000 lost biogas production during 35–56 day batch + $8,000–$14,000 remediation costs (buffering additives, external inoculum sourcing, extended percolate treatment) + $6,000–$12,000 reactor downtime during restabilization = $36,000–$67,000 total per event. Plants typically prevent 2–4 such terminations per year across a 4–8 reactor facility. Additionally, 22% yield improvement from optimized batch management contributes ongoing revenue improvement independent of failure prevention.
Eliminate Batch Failures Before They Destroy Your Production — Deploy AI Dry Fermentation Monitoring in 22 Days
iFactory's dry fermentation optimization analyzes biogas production curves, percolate chemistry, temperature distribution, and feedstock composition in real-time across all reactors — detecting process instability within 72 hours and recommending targeted interventions that restore biological equilibrium before VFA accumulation or ammonia inhibition causes irreversible batch losses. 84% reduction in unplanned batch terminations, 38% stable run-time extension, 22% biogas yield improvement.
Batch Curve Analysis
VFA Early Detection
Ammonia Risk Scoring
Temperature Mapping
72-Hour Early Warning
84% Failure Reduction