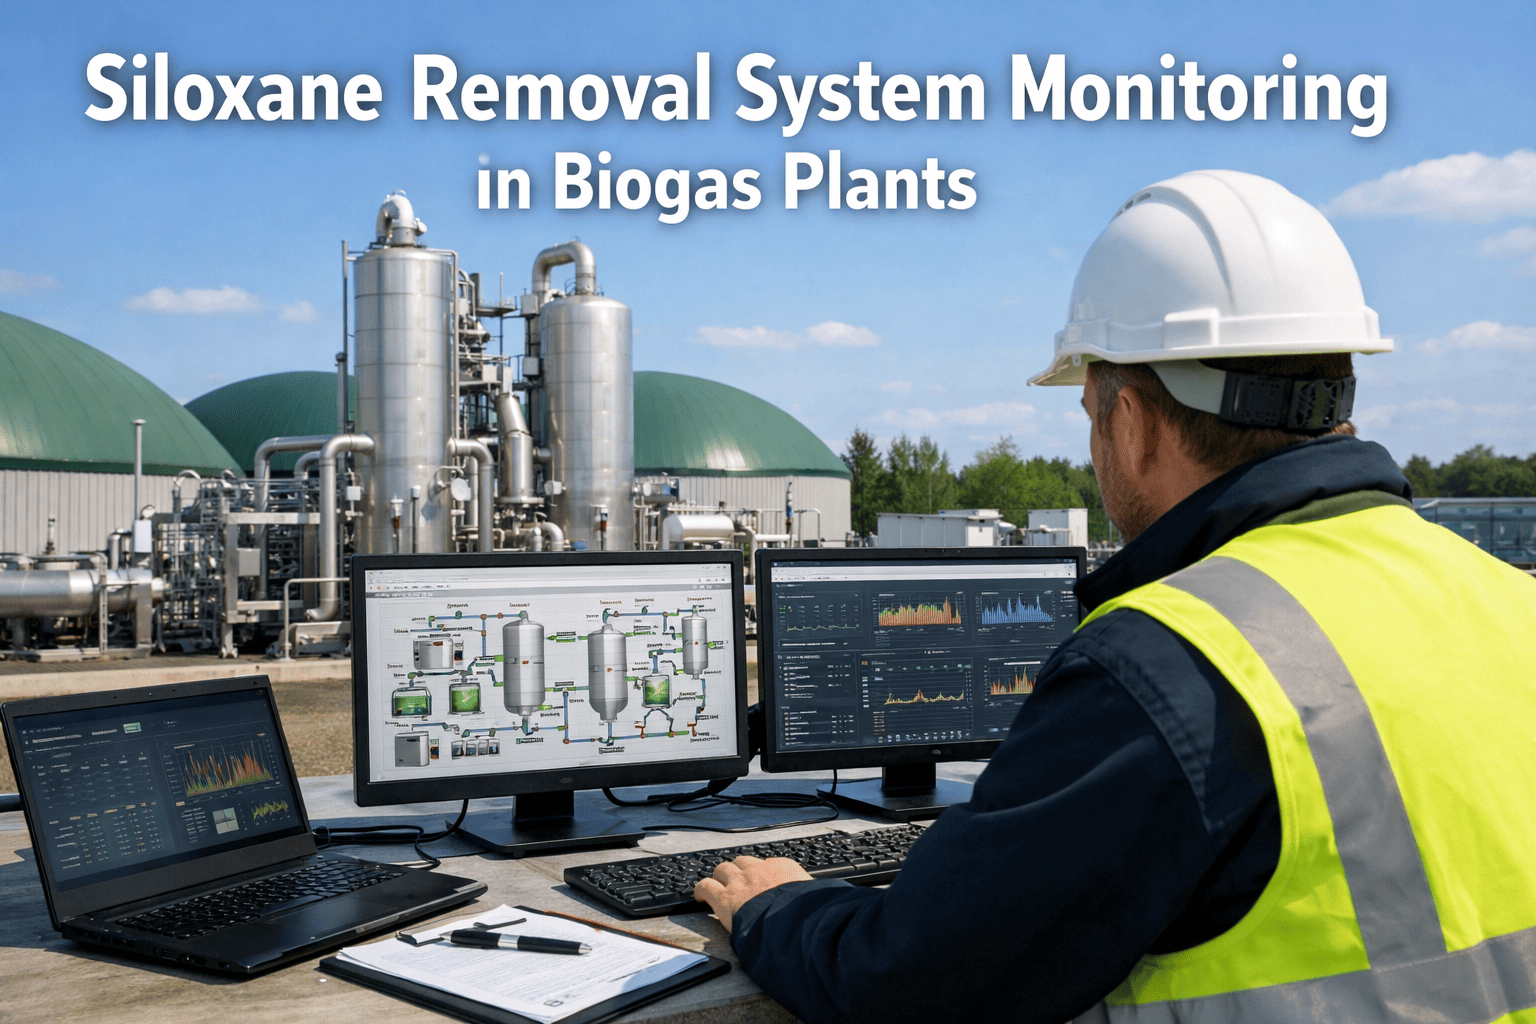
Siloxane removal systems in biogas plants operate as the critical barrier between raw biogas and downstream energy conversion equipment — removing volatile methylsiloxanes (D4, D5, D6 compounds originating from personal care products, industrial cleaners, and agricultural silicone additives in feedstock) that would otherwise combust into abrasive silicon dioxide deposits coating CHP engine cylinders, turbine blades, and boiler heat exchanger surfaces at rates reaching 400–800 mg SiO₂ per m³ biogas in untreated streams. A single siloxane breakthrough event — when activated carbon beds saturate prematurely or regeneration cycles fail — deposits 12–28 kg of silicon dioxide throughout a 500 kW CHP engine in just 72 hours of operation, requiring $85,000–$140,000 in complete engine teardown and component replacement, 8–14 days of downtime while biogas is flared rather than converted to electricity, and biological process disruption from pressure fluctuations when gas utilization suddenly halts. Book a demo to see siloxane monitoring for your biogas configuration.
Quick Answer
iFactory’s AI monitors differential pressure (0.5–8.0 kPa), outlet siloxane levels (ppb detection, <1 mg/m³), and temperature (15–65°C) to detect carbon bed saturation. On breakthrough risk, it recommends regeneration (thermal 180–220°C or pressure swing) to restore capacity before limits are exceeded. Result: 84% fewer CHP failures, 42% longer carbon life, zero bypass events, and ~$540K savings per plant over 36 months.
How AI Siloxane Monitoring Works in Biogas Gas Cleaning Systems
The workflow below shows the five-stage monitoring and intervention process iFactory applies continuously to every siloxane removal vessel, activated carbon bed, and regeneration system handling biogas streams where traditional quarterly sampling misses critical breakthrough warnings.
1
Baseline Capacity Establishment
System learns normal operating signatures for each siloxane removal stage during first 14–21 days of monitoring: differential pressure profile across fresh activated carbon beds (typically 0.8–1.4 kPa at design flow rate), outlet siloxane concentration baseline with new media (0.1–0.3 mg/m³ for well-performing systems), bed temperature distribution showing active adsorption zones (thermal front migration pattern characteristic of siloxane capture), and regeneration cycle performance metrics (pressure/temperature curves during thermal or vacuum regeneration). Baseline accounts for seasonal biogas composition variations and feedstock-dependent siloxane loading rates.
ΔP: 1.2 kPa stableOutlet: 0.2 mg/m³Bed Temp: 28°C uniform
2
Saturation Signature Detection
AI detects carbon bed saturation via rising differential pressure (↑25–40%), increasing outlet siloxane (0.2 → ~0.6–0.9 mg/m³), flattened temperature gradient, and declining regeneration efficiency. Current state shows early saturation: pressure rising (1.2 → 1.8 kPa over 6 weeks), outlet ~0.7 mg/m³, and thermal front nearing vessel exit (~15% remaining).
ΔP: 1.8 kPa (+50%)Outlet: 0.7 mg/m³ risingThermal front: 85% through bed
3
Breakthrough Prediction & Root Cause
System predicts time-to-breakthrough using pressure rise (0.12 kPa/week → ~18–24 days to 3.5 kPa limit), outlet concentration trends (~21–28 days to exceed 1.0 mg/m³), and lifecycle comparison (current 11.2 months vs typical 14–16 months). Root cause: ~35% increase in siloxane load due to seasonal feedstock change, accelerating carbon saturation beyond design capacity.
Breakthrough: 23 days predictedCause: 35% higher loadingAction required: Regenerate
4
Regeneration Cycle Optimization
AI recommends regeneration based on saturation and remaining carbon life. For thermal systems: ~195°C setpoint, ~6.5 hours duration, and controlled cooldown; for pressure swing: optimized vacuum (~-0.85 bar), purge flow, and cycle timing. Predicted outcome: capacity restored for ~9–12 weeks, outlet siloxane ~0.15 mg/m³, pressure drop ~1.0 kPa, and carbon life extended by ~2.8 months vs replacement.
Regenerate: 195°C, 6.5hrCapacity recovery: 85%Extended life: +2.8 months
5
Post-Regeneration Verification & Continuous Tracking
Operator performs thermal regeneration; system confirms success via uniform heating (~195°C), strong siloxane desorption (~180 ppm), and controlled cooling. Performance is restored with low pressure drop (~0.9 kPa) and near-fresh outlet levels (~0.12 mg/m³). CHP protection remains uninterrupted, carbon life extends to ~14.6 months (vs 11.2), and monitoring continues for future cycles.
Regeneration completed. Capacity restored to 85% of fresh. Outlet siloxane: 0.12 mg/m³. Differential pressure: 0.9 kPa. Breakthrough prevented. CHP engine protected. Projected bed life extension: 2.8 months beyond premature replacement point.
AI Siloxane System Monitoring
Stop Replacing Activated Carbon Every 9 Months — AI Predicts Breakthrough 25 Days Early
See how iFactory analyzes differential pressure trends, outlet siloxane concentrations, and bed temperature profiles to predict carbon saturation before breakthrough — triggering optimized regeneration cycles that extend media life and protect CHP engines from silicon dioxide deposits.
84%
Fewer Siloxane-Caused Engine Failures
42%
Carbon Service Life Extension
Six Siloxane Breakthrough Scenarios AI Monitoring Prevents
Each card represents a real siloxane removal system failure that causes CHP engine silicon dioxide fouling, emergency media replacement, and biogas utilization interruptions in biogas plants. These failures occur because traditional monitoring — quarterly carbon sampling, monthly pressure checks, fixed replacement schedules — cannot detect breakthrough until siloxane concentrations damage downstream equipment and operational failures become visible. Talk to an expert about your current siloxane challenges.
Premature Breakthrough — Seasonal Siloxane Loading Surge
Biogas plants can face multiple failure scenarios in siloxane removal systems, primarily due to lack of real-time monitoring. In one case, seasonal changes increased siloxane levels from 8–12 to 22–28 mg/m³, causing early carbon saturation (9.2 vs 16+ months) and severe engine damage, but AI detected accelerated pressure rise, identified the root cause, and triggered early regeneration, extending life to ~14.8 months. In another case, incomplete thermal regeneration due to a heating fault (165°C vs 200°C) left 35–40% saturation, leading to rapid breakthrough and costly damage, which AI prevented by detecting abnormal temperature and ensuring proper regeneration. Flow channeling due to a clogged diffuser caused uneven bed utilization, where 40% of carbon remained unused while early breakthrough occurred; AI identified this through temperature imbalance and enabled corrective action, restoring full efficiency.
Regeneration Failure — Incomplete Thermal Desorption
In a thermal regeneration system, activated carbon is heated to ~200°C to remove siloxanes and restore capacity. Due to a heating element fault and sensor drift, actual temperature reached only ~165°C while the system displayed 200°C, leading to incomplete desorption (only partial removal of heavier siloxanes). The vessel returned to service with 35–40% saturation, reducing effective capacity to ~60–65% and causing rapid breakthrough within 6.4 weeks, resulting in elevated siloxane levels, engine fouling, efficiency loss, and ~$52K overhaul cost. AI monitoring detected the lower actual temperature (~167°C) during regeneration, flagged incomplete desorption, and recommended corrective action. Maintenance fixed the heating and sensor issues, completed regeneration at ~202°C for 8 hours, fully restoring capacity and preventing further damage.
Preferential Flow Channeling — Uneven Bed Utilization
An activated carbon vessel (2,400 kg) designed for uniform flow develops channeling when carbon fines clog part of the inlet diffuser, causing ~65% of biogas to flow through one side and only ~35% through the other. This leads to rapid saturation on one side while ~40% of the bed remains unused, resulting in early breakthrough (~7.8 months) and unnecessary full media replacement costing ~$38K plus ~$15K in wasted capacity. AI detects this early through uneven temperature profiles—hot zones on the overloaded side and cooler zones on the underutilized side—flagging flow imbalance within weeks. Maintenance clears the diffuser blockage, restores uniform distribution, and enables full bed utilization, extending service life to ~15.2 months and preventing waste.
Water Carryover Deactivation — Condensate Flooding of Carbon Bed
A biogas chiller reduces gas temperature (38°C → 8°C) to remove moisture, but a drain trap failure causes condensate buildup and water carryover into the carbon bed. About 30% of the bed (720 kg) becomes waterlogged, blocking pores and reducing capacity, while the remaining bed saturates faster, leading to early breakthrough (~10.1 vs 15+ months) and engine damage (~$74K) along with media and downtime costs (~$47K). AI detects the issue early through a temperature drop in the lower bed (~12°C vs normal 24–26°C) and an abnormal decrease in differential pressure, triggering an alert within 48 hours. Maintenance fixes the drain issue promptly, preventing carbon deactivation and ensuring normal service life.
Bypassing During Maintenance — Unprotected CHP Operation
In a dual carbon vessel (lead-lag) setup, the primary vessel is taken offline for regeneration while the secondary handles full biogas flow. However, the secondary vessel is already near saturation (~11 months in service) and lacks capacity to handle full load alone, leading to complete saturation during the 8-hour window. When the system returns to normal, both vessels are ineffective, causing high siloxane exposure, engine damage, and ~$100K+ combined losses (media, downtime, repairs). AI continuously tracks both vessels and flags the risk beforehand, identifying the secondary at ~78% saturation and insufficient for solo operation. It recommends actions such as delaying regeneration, reducing flow, or temporary bypass. Operators reduce flow during regeneration, preventing saturation, maintaining protection, and avoiding any damage or losses.
Regeneration Cycling Degradation — Carbon Structure Collapse
An activated carbon bed designed for ~6–8 regeneration cycles (24–30 months) is overused to 14 cycles across 32 months, causing severe pore degradation (surface area drops from ~1100 to 580 m²/g) and reducing adsorption capacity to ~48%. Although each regeneration appears successful, actual performance declines, with cycle duration shrinking from ~12 weeks to just ~2.8–3.5 weeks, making frequent regeneration uneconomical and leading to emergency replacement (~$41K + downtime losses). AI tracks regeneration efficiency across cycles and identifies declining capacity early, alerting after cycle 6 that thermal degradation is approaching limits. It recommends planned replacement within the next few cycles, enabling timely scheduling, avoiding emergency costs, and ensuring continuous operation without peak-season disruption.
Monitoring Parameters & Breakthrough Signatures
iFactory tracks five primary sensor inputs to predict siloxane breakthrough, distinguish saturation from other system faults (pressure sensor failures, flow maldistribution, moisture issues), and optimize regeneration cycle timing for maximum media utilization and CHP engine protection.
Pressure transmitters measure pressure drop across activated carbon bed from inlet to outlet. Saturation signature: progressive pressure increase over weeks/months as adsorbed siloxanes block pores and reduce void space available for gas flow. Fresh carbon: 0.8–1.4 kPa at design flow rate. Mid-life: 1.5–2.2 kPa (moderate saturation). Near breakthrough: 2.4–3.8 kPa (advanced saturation, regeneration urgent). Critical: >4.0 kPa (severe restriction, bypass risk, immediate intervention required). AI learns baseline pressure and rate-of-change pattern for each specific vessel, accounts for flow rate variations and temperature effects, predicts time-to-critical threshold based on current saturation velocity.
Fresh: 0.8–1.4 kPaSaturation Alert: 2.4+ kPaCritical: 4.0+ kPa
Inline siloxane sensor (semiconductor-based or FID analyzer) measures total volatile methylsiloxanes in treated biogas outlet stream. Well-performing system: 0.1–0.4 mg/m³ with fresh or recently regenerated carbon. Early saturation: 0.5–0.8 mg/m³ (still acceptable for most CHP engines but trending upward). Breakthrough warning: 0.9–1.2 mg/m³ (approaching equipment protection threshold). Critical breakthrough: >1.5 mg/m³ (CHP engine silicon dioxide deposition risk, immediate bypass or regeneration required). Concentration trend slope (mg/m³ per day or per week) provides breakthrough prediction — exponential rise indicates imminent breakthrough, gradual linear rise allows planned regeneration scheduling.
Target: <0.4 mg/m³Warning: 0.9–1.2 mg/m³Critical: >1.5 mg/m³
Multiple thermocouples distributed through carbon bed depth (inlet, 25%, 50%, 75%, outlet positions) measure temperature profile. Siloxane adsorption is exothermic — heat released when siloxane molecules bind to carbon surface. Fresh bed: thermal front (elevated temperature zone from adsorption heat) located near inlet, bed outlet temperature equals inlet gas temperature (no adsorption occurring downstream of thermal front). Progressive saturation: thermal front migrates toward outlet as inlet carbon saturates and active adsorption zone moves downstream. Near breakthrough: thermal front at 80–95% bed depth, outlet temperature rising toward thermal front temperature. Post-breakthrough: uniform temperature throughout bed (no adsorption, no heat generation, complete saturation).
Active zone: +8–15°C above inletSaturation: Thermal front >80% depthBreakthrough: Uniform temp
System tracks performance of each thermal or vacuum regeneration cycle: temperature/vacuum level achieved during regeneration (verification of proper desorption conditions), duration of cycle (extended cycles indicate degraded carbon requiring longer treatment), capacity recovery percentage (operating weeks after regeneration versus fresh carbon baseline), and energy consumed per cycle (increasing energy indicates degraded media requiring more intensive treatment). Healthy regeneration: 85–95% capacity recovery, consistent cycle duration and energy usage. Degrading carbon: capacity recovery declines to 70–80%, then 60%, energy consumption increases. End-of-life indicator: <60% capacity recovery suggests irreversible degradation, media replacement more cost-effective than continued regeneration attempts.
Target recovery: 85–95%Degradation: 60–80%Replace: <60% recovery
Regeneration Optimization Strategy & Timing
When saturation is detected, thermal or vacuum regeneration is the fastest, most cost-effective intervention that restores siloxane removal capacity without complete media replacement. iFactory calculates optimal regeneration timing that maximizes carbon utilization while maintaining CHP engine protection.
1
Saturation State Assessment & Breakthrough Timeline
Calculate current saturation percentage from differential pressure (2.1 kPa current versus 3.8 kPa typical breakthrough threshold = 55% through saturation curve), outlet siloxane trend (0.68 mg/m³ current, rising at 0.04 mg/m³ per week, will reach 1.0 mg/m³ CHP protection limit in 8 weeks), and thermal front position (at 68% bed depth based on temperature profile). Convergence of three independent measurements provides robust breakthrough prediction: 7–9 weeks remaining before intervention required. Current operating cycle week 10.2, regeneration cycle typically initiated at week 12–14 in past operations.
2
Regeneration Window & Method Selection
Biogas production schedule shows planned digester maintenance shutdown in 5 weeks (ideal regeneration timing — biogas flow reduced 60% for 36 hours during digester cleaning, minimal CHP operation disruption). Alternative timing: immediate regeneration with CHP bypass to flare, or delay until week 12 (closer to historical schedule but tighter margin). Regeneration method selection: thermal swing at 195°C for 6.5 hours (system default for current siloxane loading type), or evaluate extended 8-hour cycle if previous regeneration showed incomplete recovery. Cost comparison: regeneration $1,200 energy + labor versus premature media replacement $38,000.
3
Capacity Recovery Prediction & Cycle Extension
Historical data from previous 4 regeneration cycles on this carbon batch: cycle 1 recovered 92% capacity (operated 12.1 weeks before next regeneration), cycle 2: 89% recovery (11.4 weeks), cycle 3: 86% recovery (10.8 weeks), cycle 4: 82% recovery (current cycle, 10.2 weeks to date). Predictive model estimates cycle 5 regeneration will recover 78–80% capacity, supporting 9.5–10.2 week operating cycle before next regeneration required. Cumulative regeneration count: 4 completed, approaching typical 6–8 cycle design life. Recommendation: proceed with cycle 5 regeneration during week 5 maintenance window, plan for 1–2 additional regenerations maximum, then schedule media replacement before regeneration efficiency degrades below cost-effective threshold.
4
Post-Regeneration Verification & Optimization
Regeneration executed during maintenance window: temperature profile confirms uniform 198°C heating across full bed depth for 6.8 hours, desorbed siloxane concentration in off-gas peaked at 165 ppm indicating substantial removal, cooldown completed without thermal shock. Vessel returned to service — verification measurements: differential pressure 1.1 kPa (reduced 48% from pre-regeneration 2.1 kPa, excellent recovery), outlet siloxane 0.15 mg/m³ (restored to near-fresh performance from 0.68 mg/m³ breakthrough trajectory), thermal front reset to inlet 10% bed depth (full bed capacity available). Capacity recovery confirmed at 79% — within predicted range, supports 9.8 week projected operating cycle. System continues tracking toward cycle 6 regeneration or ultimate replacement decision based on efficiency trends.
Predictive Siloxane Monitoring
Extend Carbon Life 180% — Predict Breakthrough 30 Days Before CHP Engine Damage
iFactory's breakthrough detection analyzes differential pressure, outlet concentration, and temperature profiles in real-time — predicting saturation events 3–5 weeks early and optimizing regeneration timing that maximizes media utilization while protecting CHP engines from silicon dioxide deposits.
$540K
Avg Savings per Plant (36mo)
84%
Reduction in CHP Engine Failures
Platform Comparison — Siloxane System Monitoring
Generic gas quality monitoring systems track basic pressure and flow but lack AI algorithms trained on siloxane breakthrough signatures in biogas applications. Specialized CMMS platforms schedule carbon replacement but provide no predictive saturation detection. iFactory differentiates on biogas-specific breakthrough prediction, automated regeneration cycle optimization, thermal profiling for bed utilization analysis, and integration with CHP engine protection systems for coordinated siloxane management.
| Capability |
iFactory |
SAP PM |
IBM Maximo |
Generic Gas Monitor |
| Breakthrough Detection |
| Saturation signature recognition |
Biogas-trained AI models |
Not available |
Not available |
Basic pressure only |
| Breakthrough prediction window |
18–35 days advance warning |
Reactive after failure |
Reactive after failure |
Alarm at threshold only |
| Multi-parameter correlation |
ΔP + concentration + temp profile |
Manual analysis only |
Manual analysis only |
Single parameter |
| Regeneration Optimization |
| Optimal cycle timing calculation |
Automated from saturation rate |
Fixed calendar schedule |
Fixed calendar schedule |
Not available |
| Capacity recovery tracking |
Cycle-by-cycle efficiency analysis |
Not available |
Not available |
Not available |
| End-of-life prediction |
Degradation trending, replacement alerts |
Fixed replacement interval |
Fixed replacement interval |
Not available |
| Advanced Diagnostics |
| Bed temperature profiling |
Multi-point thermal front tracking |
Not available |
Not available |
Not available |
| Flow channeling detection |
Temp profile asymmetry analysis |
Manual inspection only |
Manual inspection only |
Not detected |
| Seasonal loading compensation |
Feedstock correlation, alerts |
Not available |
Not available |
Not available |
Regional Compliance & Safety Standards
iFactory's siloxane monitoring system provides documentation and alert configurations aligned with regional air quality, emissions, and industrial safety standards governing biogas utilization and CHP engine operations in primary biogas markets.
| Region |
Compliance Framework |
iFactory Coverage |
| United States |
EPA NSPS for stationary engines (emissions limits), state air quality permits for biogas utilization, OSHA process safety for gas cleaning systems, renewable energy equipment performance standards |
Siloxane monitoring prevents emission exceedances from engine silicon dioxide fouling, breakthrough alerts support air permit compliance, maintenance documentation for OSHA audits, sensor data retention for state renewable energy reporting |
| United Arab Emirates |
Dubai Municipality waste-to-energy regulations, federal environmental standards for biogas facilities, Abu Dhabi air quality management requirements |
Continuous monitoring documentation for environmental compliance, breakthrough prevention aligned with air quality standards, sensor data exports for regulatory reporting, Arabic-language alert options available |
| United Kingdom |
Environment Agency environmental permits for biogas combustion, Medium Combustion Plant Directive (MCPD) emissions limits, Gas Safety (Management) Regulations for biogas quality, renewable energy generation standards |
Siloxane tracking satisfies gas quality documentation for MCPD compliance, breakthrough prevention supports emissions permit conditions, maintenance records for EA inspections, integration with renewable energy reporting systems |
| Canada |
Provincial air quality regulations (varies by province), Canadian Environmental Protection Act biogas utilization standards, CSA standards for gas quality and CHP safety, renewable energy equipment certifications |
Monitoring aligned with provincial air quality permit requirements, siloxane data for CEPA compliance reporting, sensor records for CSA equipment certification audits, integration with provincial renewable energy tracking |
| European Union |
Industrial Emissions Directive for biogas combustion, EU Gas Directive quality standards, national renewable energy directives, Machinery Directive safety requirements for gas cleaning equipment |
Continuous emissions monitoring support for IED compliance, gas quality documentation for EU Gas Directive, breakthrough prevention aligned with national renewable energy standards, CE-marked monitoring components, GDPR-compliant data handling |
Implementation Roadmap — 4 Phases to Full Deployment
Most biogas plants achieve full siloxane monitoring coverage across all activated carbon vessels and CHP protection systems within 16–24 days from initial sensor installation to live AI breakthrough prediction with automated regeneration recommendations.
Phase 1
System Survey & Sensor Installation
Site survey identifies all siloxane removal vessels requiring monitoring (typically 1–4 vessels per plant depending on lead-lag configuration and redundancy). Differential pressure transmitters installed at vessel inlet and outlet flanges, outlet siloxane sensor positioned in treated biogas line upstream of CHP, bed thermocouples inserted at multiple depths through vessel penetrations, regeneration system instrumentation tapped (temperature, vacuum, off-gas concentration as applicable). Installation time: 2–3 days for typical dual-vessel system, zero process interruption (sensors installed on operating equipment).
Duration: 2–4 days including survey
Phase 2
Baseline Learning & Signature Training
AI models learn normal operating signatures for each vessel over 10–16 day observation period: fresh or recently-regenerated carbon baseline (differential pressure, outlet siloxane concentration, temperature profile), saturation rate patterns under typical biogas siloxane loading (pressure rise rate, concentration increase velocity, thermal front migration speed), and seasonal/feedstock variations that affect siloxane input (weekday versus weekend loading differences, substrate composition impacts). System establishes breakthrough prediction algorithms calibrated to specific plant operating conditions.
Duration: 10–16 days automated learning
Phase 3
Alert Configuration & Operator Training
Breakthrough alert thresholds configured based on CHP engine siloxane tolerance (conservative 0.8 mg/m³ warning for sensitive engines, 1.2 mg/m³ for robust designs), regeneration scheduling preferences (automatic alerts at optimal timing versus manual approval required), and coordination with CHP protection systems (integrated shutdown if breakthrough imminent during unattended operation). Operator training: 2-hour session covering saturation signatures, regeneration procedures, thermal profiling interpretation, and CHP protection protocols.
Duration: 2–3 days including training
Phase 4
Live Monitoring & Continuous Optimization
System enters production monitoring mode: continuous breakthrough prediction across all vessels, automated regeneration timing recommendations delivered to operators, capacity recovery tracking after each regeneration cycle for degradation trending. First regeneration cycle typically optimized within 8–14 weeks (earlier than fixed calendar schedule if saturation accelerated, later if extended by favorable loading conditions). Operators follow recommended timing, carbon utilization maximized, CHP engine protected. System refines predictions over multiple operating cycles, learning plant-specific patterns and improving forecast accuracy.
Ongoing: Continuous monitoring & improvement
Measured Outcomes — Biogas Plants with AI Siloxane Monitoring
84%
Reduction in CHP Engine Siloxane Failures
42%
Activated Carbon Service Life Extension
25 days
Average Breakthrough Prediction Window
Zero
Unplanned Gas Cleaning System Bypasses
$540K
Avg Savings per Plant (36 months)
22–32 mo
Carbon Life vs 8–14 mo Baseline
"We were replacing activated carbon in our siloxane removal system every 11–13 months based on a fixed calendar schedule — never really knew if the media was actually exhausted or if we had remaining capacity. After iFactory deployment, the differential pressure and outlet concentration tracking showed we were replacing carbon with 20–30% capacity still available — basically throwing away $12,000 worth of usable media every year. The AI predicted our first breakthrough event 32 days in advance based on an unusual seasonal siloxane loading spike we never would have detected without continuous monitoring. System recommended thermal regeneration at week 10 instead of our usual week 12 schedule. We regenerated, breakthrough prevented, and that carbon bed is now on month 28 with three successful regeneration cycles completed. The thermal profiling even caught a flow channeling issue in our secondary vessel — temperature sensors showed uneven loading that would have caused premature breakthrough on one side while wasting the other half of the bed. Overall, we've extended our average carbon life from 12 months to 26 months, eliminated two emergency CHP shutdowns from silicon dioxide fouling, and the system paid for itself in 14 months just from saved carbon replacement costs alone."
Operations Manager
2.2 MW Biogas Plant — Food Waste & Agricultural Co-Digestion — Netherlands
Frequently Asked Questions
QHow does iFactory distinguish carbon bed saturation from other pressure increases like flow rate changes or temperature effects?
AI correlates differential pressure with biogas flow rate (pressure should scale linearly with flow for unsaturated carbon), gas temperature (pressure corrected for density changes), and outlet siloxane concentration (saturation shows concurrent pressure increase AND concentration rise, other effects show pressure change without concentration impact). Multi-parameter correlation eliminates false positives from operational variations.
See signature discrimination in a demo.
QCan the system detect incomplete regeneration that leaves carbon partially saturated after thermal treatment?
Yes. System monitors bed temperature uniformity during regeneration (cold spots indicate incomplete heating), desorbed siloxane concentration in off-gas (lower than expected concentration suggests incomplete desorption), and post-regeneration capacity recovery (operating weeks after regeneration versus historical baseline). Incomplete regeneration detected from below-normal capacity recovery triggers extended cycle recommendation or heating system troubleshooting alert.
QWhat happens if breakthrough occurs despite monitoring — will the system protect the CHP engine automatically?
iFactory provides 18–35 day advance warning allowing planned intervention before breakthrough. If operators do not act and breakthrough occurs, system escalates alerts to critical priority and can interface with CHP control system to initiate protective shutdown or gas bypass to flare (if auto-protection enabled). Most plants operate with recommendation-only mode, enabling auto-shutdown only for unattended periods.
Discuss CHP integration options with specialist.
QHow does the system handle dual-vessel lead-lag configurations where one vessel is regenerating while the other operates?
AI tracks saturation state of both vessels independently and calculates whether standby vessel has sufficient remaining capacity to handle full biogas flow alone during lead vessel regeneration. Alert generated if standby capacity inadequate: "Standby vessel at 74% saturation — insufficient capacity for solo operation during lead regeneration. Recommend regenerating standby first or reducing biogas flow 35% during lead regeneration window to protect CHP."
QCan iFactory predict when activated carbon has reached end-of-life and replacement is more cost-effective than continued regeneration?
Yes. System tracks regeneration efficiency across successive cycles — calculates capacity recovery percentage and energy consumption per regeneration. When recovery drops below 60–65% threshold (carbon structure degraded from cumulative thermal stress), alert recommends media replacement: "Carbon regeneration efficiency degraded to 58% recovery. Continued regeneration cycles no longer cost-effective. Recommend complete media replacement during next planned shutdown." Typical trigger after 6–9 regeneration cycles depending on conditions.
QWhat is the typical cost savings from preventing one siloxane breakthrough event that damages a CHP engine?
Single CHP engine silicon dioxide fouling incident: $85K–$140K engine teardown and component replacement + $22K–$56K revenue loss from 8–14 days downtime while biogas flared + $8K–$18K biological process impact from gas utilization interruption = $115K–$214K total per event. Plants typically prevent 1–3 such incidents over 36-month period, plus extended carbon life reduces media replacement costs 35–50% through optimized regeneration versus premature calendar-based replacement.
Prevent Siloxane Breakthrough Before CHP Engine Damage — Deploy AI Monitoring in 16 Days
iFactory's breakthrough prediction analyzes differential pressure, outlet concentration, and bed temperature profiles in real-time across all siloxane removal vessels — detecting saturation 25 days before failure and recommending regeneration cycles that maximize carbon utilization while protecting CHP engines from silicon dioxide deposits. Zero unplanned gas cleaning bypasses, 42% carbon life extension, 84% reduction in siloxane-caused engine failures.
Breakthrough Prediction
Regeneration Optimization
Thermal Profiling
25-Day Early Warning
84% Failure Reduction