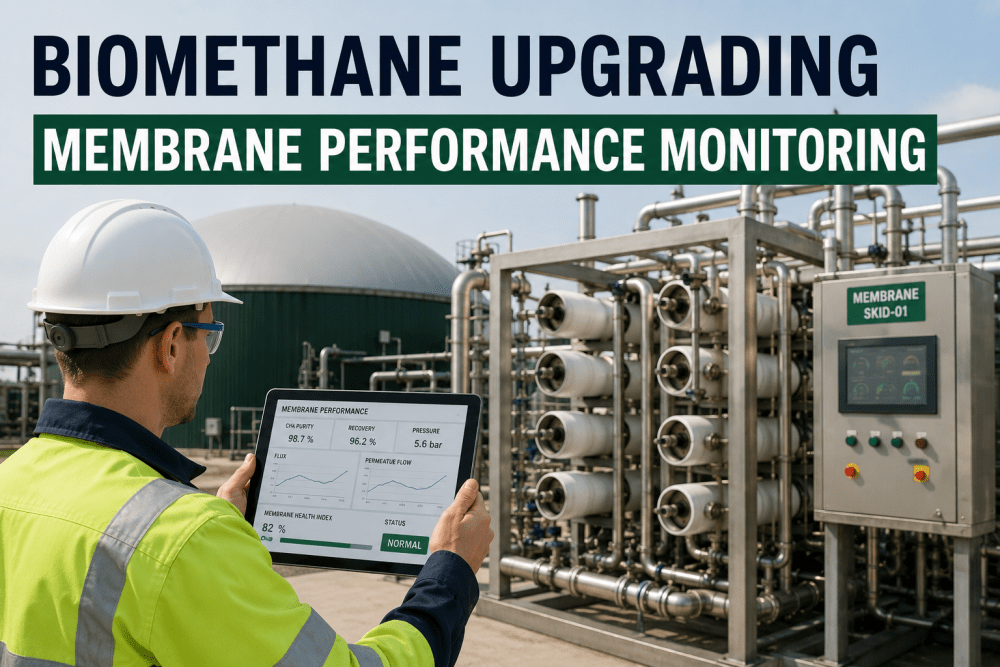
Membrane-based biogas upgrading systems account for approximately 35% of all installed RNG capacity in North America, yet most facility operators lack real-time visibility into the one metric that determines their entire revenue equation: membrane selectivity degradationTo evaluate how iFactory's AI-driven membrane health analytics platform detects selectivity drift weeks before it impacts your RNG revenue, Book a Demo with our biogas upgrading engineering team today.
60:1
Design CO2/N2 selectivity ratio for new polymeric biogas membranes — degrades to 25:1–35:1 before operators detect the decline through conventional sampling
$120K
Annual methane revenue lost per 100 scfm when membrane selectivity drops from 60:1 to 30:1 due to undetected CH4 slip into the permeate vent stream
8–12
Weeks of advanced warning iFactory's AI model provides before a membrane element requires replacement — versus reactive change-out after quality excursion
2–4%
Typical methane recovery improvement when transitioning from time-based membrane replacement to iFactory's condition-based change-out scheduling
Is your membrane upgrading system losing methane to undetected selectivity drift? Schedule a free performance benchmark against your current operating data with iFactory's membrane analytics team.Book a Demo
Membrane Degradation Mechanisms Every Biogas Plant Must Monitor
Polymeric membrane elements used in biogas upgrading are subject to five distinct degradation mechanisms, each with a different onset pattern, progression rate, and effect on separation performance. Understanding which mechanism is active in your system is the prerequisite for choosing the right monitoring strategy and predicting remaining useful life with confidence. Operations leads evaluating continuous membrane health surveillance often book a demo to compare their current membrane replacement strategy against AI-driven condition-based scheduling.
Plasticization-Induced Selectivity Loss
High CO2 partial pressure causes polymer chain swelling, increasing free volume and reducing size-sieving ability. The membrane continues passing gas but loses its ability to discriminate CO2 from CH4 — the single largest cause of gradual methane slip in glassy polymer membranes used for biogas upgrading. Book a Demo
HIGH IMPACT
Condensate Pore Blocking
Water vapor and heavier hydrocarbon condensation on the membrane surface physically block gas transport pathways. Unlike plasticization, pore blocking is partially reversible with proper drying and purge cycles — but repeated condensation events accelerate irreversible fouling and permanent flux decline.
HIGH IMPACT
Chemical Attack & Hydrolysis
Trace H2S, ammonia, and volatile organic compounds in raw biogas can chemically degrade polyimide and polysulfone membrane materials. Hydrolysis of the polymer backbone at high relative humidity and temperature accelerates chain scission, permanently destroying separation performance.Book a Demo
MEDIUM IMPACT
Thermal Cycling Fatigue
Repeated temperature swings between daytime and nighttime operation — common in facilities without feed gas preheating — cause differential thermal expansion between the membrane polymer and the support structure, leading to micro-crack formation at the polymer-support interface and non-selective gas bypass.
MEDIUM IMPACT
Abrasive Particulate Erosion
Fine silica, iron sulfide, and activated carbon fines that pass through upstream filtration act as abrasives on the membrane surface under high-velocity . Over 12–24 months of operation, particulate erosion thins the selective layer and creates pinhole defects that allow direct gas bypass Book a Demo.
MANAGED RISK
Membrane Element Channeling
Uneven flow distribution across the membrane element bundle creates preferential flow paths that reduce effective membrane area. Channeling is difficult to detect through inlet/outlet measurements alone but causes a measurable decline in stage-cut efficiency that compounds over time.
MANAGED RISK
Membrane Health KPIs: Comparing Healthy vs. Degraded Performance
The difference between a healthy membrane system and one in the early stages of degradation is visible in six key performance indicators — but only if those KPIs are tracked continuously and correlated against feed gas conditions. A weekly GC sample showing 97% CH4 purity provides no insight into whether the membrane is degrading, because the operator may have increased the stage cut to compensate. Real membrane health monitoring requires tracking the underlying transport parameters that change with degradation, not just the outlet composition.
KPI
Healthy Membrane (New)
Degraded Membrane (Pre-Failure)
Detection Method
iFactory AI Value
CO2/CH4 Selectivity
55:1 – 65:1
20:1 – 35:1
Permeate composition analysis at multiple stage cuts
Continuous selectivity trending with AI-based degradation curve fitting
Methane Recovery
98.5% – 99.2%
94% – 97%
Mass balance from feed, permeate, and product flow meters
Real-time mass balance with automated flow meter drift correction
Stage Cut (θ)
0.12 – 0.18 per stage
> 0.25 required to maintain purity
Permeate-to-feed flow ratio per stage
Optimal stage-cut advisory to balance purity and recovery
Differential Pressure
2–4 psi per element
> 6 psi per element
Pressure transmitters before/after each element bank
dP trend analysis with fouling detection and purge advisory
Permeate CH4 Concentration
0.8% – 1.5%
3% – 8%
GC or NDIR analyzer on permeate vent line
Permeate CH4 threshold alerts with revenue loss quantification
Normalized Flux
100% baseline
60% – 80% of baseline
Permeate flow normalized to feed pressure and temperature
Flux decline modeling with remaining useful life prediction
Membrane Health Monitoring: A Six-Stage Data-Driven Workflow
Effective membrane performance monitoring requires converting raw sensor data — pressures, temperatures, flow rates, and gas compositions — into actionable intelligence about element health, replacement timing, and revenue impact. The following workflow maps the data journey from sensor acquisition to maintenance decision, showing how iFactory's AI platform transforms disparate process measurements into a unified membrane health score with weeks of predictive lead time.
01
Stage-Level Sensor Data Acquisition
Continuous pressure, temperature, and flow measurements from each membrane stage are collected at 1-minute intervals. Permeate and product gas composition are sampled via online GC or NDIR analyzers at 5–15 minute intervals. All data streams are time-synchronized and validated against sensor drift and calibration state to ensure the analytics model receives accurate inputs.
02
Mass Balance & Selectivity Calculation
iFactory's platform performs a continuous mass balance across each membrane stage, calculating actual CO2 and CH4 transport rates from measured flow and composition data. Selectivity is computed in real time using the stage-cut and permeate composition, normalized to feed gas temperature and partial pressure to isolate the degradation signal from operating condition noise.
03
Degradation Curve Fitting & Trend Analysis
The platform fits a multi-parameter degradation model to the historical selectivity and normalized flux trend, automatically identifying which degradation mechanism — plasticization, fouling, chemical attack, or thermal fatigue — best explains the observed performance decline. The model generates a confidence-weighted degradation trajectory that projects future performance under current operating conditionsBook a Demo.
04
Revenue Impact & Replacement Optimization
Each membrane element's projected degradation trajectory is translated into a revenue loss forecast — combining methane slip value, increased energy cost from higher stage-cut operation, and RIN/LCFS qualification risk from potential off-spec events. The platform identifies the economic optimum replacement window that minimizes total cost over the element lifecycle.
05
Condition-Based Change-Out Advisory
When the degradation model projects that a membrane element will reach its end-of-life threshold within a configurable planning horizon — typically 4–8 weeks — the platform generates a change-out advisory with supporting evidence, projected recovery improvement, and recommended replacement element specifications optimized for current feed gas conditions.
06
Post-Change Performance Validation
After element replacement, the platform automatically compares post-change KPIs against the pre-degradation baseline and the projected recovery from the change-out advisory. This closed-loop validation quantifies the actual improvement achieved, refines the degradation model for remaining elements, and provides procurement teams with verified performance data for membrane vendor evaluation. Book a Demo
Stop Guessing When to Replace Your Membrane Elements
iFactory's AI-driven membrane health platform continuously monitors selectivity, normalized flux, and methane recovery across every stage of your upgrading system — delivering weeks of predictive lead time before degradation impacts your RNG revenue or pipeline compliance.
Measured Outcomes: Membrane Performance Improvement at Operating Facilities
2.8%
Average Methane Recovery Improvement
Achieved across six membrane-based upgrading facilities after deploying iFactory's condition-based change-out scheduling in place of time-based replacement programs.
12 Wks
Advanced Warning Before Quality Excursion
Average predictive lead time provided by iFactory's selectivity degradation model before the membrane would have produced off-spec product gas at the pipeline custody meter.
$94K
Annual Revenue Recovery per 100 scfm
Value of recovered methane and avoided RIN/LCFS credit loss at current market pricing when membrane elements are replaced at the economically optimal degradation threshold.
40%
Reduction in Unplanned Membrane Events
Decrease in emergency change-outs and off-spec events at monitored facilities, enabled by predictive alerts that give operations teams weeks of planning lead time.
18 Mo
Average Membrane Element Life Extension
Increase in useful membrane life achieved by identifying and correcting operating conditions — condensate carryover, temperature excursions, pressure cycling — that accelerate degradation.
99.6%
On-Spec Compliance Rate
Pipeline injection availability achieved at monitored membrane-based upgrading facilities, compared to 95-97% industry average for plants relying on weekly GC sampling.
Selectivity
Primary KPI Tracked
Continuous CO2/CH4 selectivity trending across every membrane stage
Weeks
Predictive Lead Time
8–12 week advance warning before end-of-life threshold is reached
OEM-Agnostic
Platform Compatibility
Works with Air Liquide, Evonik, Ube, and all major membrane systems
Real-Time
Data Resolution
1-minute sensor data with 5-minute GC composition updates
Expert Review: What Operations Teams Miss About Membrane Health Quantification
The most common mistake I see in membrane-based biogas upgrading plants is treating the weekly GC sample on the product gas as a membrane health diagnostic. That sample tells you the outlet composition — which the operator may have already corrected by increasing the stage cut. The membrane could be 40% degraded, and the weekly GC looks fine because the plant is running at higher pressure and lower recovery to compensate. By the time the GC shows a problem, the membrane is in end-of-life failure and you have already lost months of methane revenue through the permeate vent. Real membrane health monitoring requires tracking selectivity at the stage level, not just product purity at the outlet. I have reviewed facility data where operators were losing $90,000 per year in vented methane without any indication on their daily operations dashboard. The membrane health data was there — it just was not being calculated or trended. Book a Demo
Senior Process Engineer, Biogas Upgrading
15 Years — Membrane Systems Design and Operations, AIChE Member, GTI Certified Biogas Professional
From the maintenance side, the problem is that membrane replacement has been treated as a time-based preventive task — replace every 5 years or after a quality excursion — instead of a condition-based decision driven by actual transport property data. The consequence is that facilities either replace elements too early, throwing away 12–24 months of remaining useful life, or too late, after thousands of dollars in methane has already been lost. The data to make condition-based decisions is available from the flow meters, pressure transmitters, and gas analyzers already installed on every membrane skid. What is missing is the analytics layer that converts that raw data into a selectivity trend, a degradation model, and an economic replacement threshold. That is not a sensor gap — it is a data analytics gap, and it is costing the average 500 scfm membrane facility $400,000–$600,000 per year in avoidable methane loss and premature element replacement.Book a Demo
Reliability Engineering Manager
Biogas and Renewable Natural Gas Operations, 12 Years — CRL, SMRP Certified
Frequently Asked Questions
iFactory's platform uses a hybrid approach that combines available composition measurements with physics-based transport models to estimate stage-level selectivity. Most membrane skids have at least one online GC or NDIR analyzer on the final product gas stream. The platform uses that measurement along with feed composition (from an upstream analyzer or known digester gas profile), stage-level pressure and flow data, and a modified solution-diffusion transport model to back-calculate the effective selectivity of each membrane stage. Where a permeate analyzer is available, the model is calibrated to that direct measurement. Where no permeate analyzer exists, the model uses the mass balance closure across each stage to estimate selectivity with validated accuracy within ±5% of laboratory reference measurements. The key insight is that the flow and pressure data already installed on every membrane skid contains far more information about membrane health than most operators realize — the analytics layer extracts that information continuously.
The minimum viable instrumentation set per membrane stage is: feed gas pressure and temperature transmitter, permeate and residue flow meters (thermal mass or Coriolis), and differential pressure across each element bank or vessel. For composition, at minimum one online product gas GC or NDIR analyzer at the final product outlet. Additional composition measurements on the permeate vent line provide higher selectivity model accuracy but are not required for initial deployment. iFactory's pre-deployment audit includes a complete sensor gap analysis against the existing skid instrumentation and provides specific recommendations for any additional sensors needed. In our experience, approximately 70% of membrane-based upgrading facilities already have sufficient instrumentation for meaningful membrane health monitoring — the missing element is the analytics platform, not the sensors.
Yes. iFactory's degradation model analyzes the rate and pattern of change across multiple KPIs simultaneously to differentiate reversible and irreversible mechanisms. Reversible fouling — condensate blocking, particulate accumulation on the membrane surface — typically presents as a rapid decline in normalized flux with a smaller change in selectivity. The platform correlates these events with operating conditions (feed gas temperature excursions, condensate separator level upsets, upstream filter breakthrough) and generates specific corrective recommendations, such as initiating a membrane drying and purge cycle. Permanent degradation — plasticization, chemical attack, thermal fatigue — presents as a monotonic decline in both selectivity and normalized flux that does not recover when operating conditions are corrected. The platform tracks the reversibility index, a composite metric that quantifies the fraction of observed performance decline that is recoverable versus permanent, and adjusts the remaining useful life projection based on this analysis. Book a Demo
Yes. iFactory's platform is designed natively for multi-stage membrane configurations, including two-stage, three-stage, and two-pass arrangements common in large biogas upgrading installations. The platform maintains an independent degradation model for each membrane stage, tracking stage-specific selectivity, normalized flux, and remaining useful life. This stage-level resolution is critical because degradation rarely progresses uniformly across all stages — the first stage, which sees the highest CO2 partial pressure, typically plasticizes faster than downstream stages. Stage-level monitoring enables targeted replacement of only the degraded elements rather than blanket replacement of the entire membrane inventory, reducing replacement costs by 30–50% while maintaining overall system performance. The platform also captures inter-stage interactions — for example, how first-stage degradation increases the CO2 loading on the second stage, potentially accelerating its degradation — and incorporates these coupling effects into the system-level remaining useful life projectionBook a Demo.
For a typical membrane-based upgrading facility processing 500–1,000 scfm of biogas, the annual methane recovery improvement of 2–4% enabled by condition-based replacement scheduling generates $180,000–$400,000 in additional RNG revenue at current D3 RIN and LCFS credit pricing. The annual platform subscription cost for membrane health monitoring ranges from $38,000 to $72,000 depending on the number of monitored stages and integration scope. The additional sensor instrumentation required — if any — typically costs $8,000–$25,000 for a well-instrumented skid. Implementation takes 2–3 weeks for initial deployment and 30 days for AI model baseline establishment. Based on these parameters, the platform typically achieves positive ROI within 3–5 months of deployment and generates a 5:1 to 8:1 annual return on subscription investment. Contact iFactory for a site-specific ROI assessment based on your facility's membrane configuration, feed gas conditions, and current methane recovery performance.
Conclusion: Membrane Health Is a Revenue Problem That Data Solves
Membrane degradation in biogas upgrading systems is not a maintenance problem — it is a revenue problem that manifests through three financial leakage points: methane lost through the permeate vent as selectivity declines, energy cost increases as higher stage-cut operation is required to maintain product purity, and RIN/LCFS credit exposure if degradation eventually causes an off-spec event at the pipeline custody meter. Each of these leakage points is directly measurable from the pressure, flow, and composition sensors already installed on every membrane skid. The missing element is the analytics layer that converts those raw measurements into a continuous membrane health assessment, a degradation trajectory projection, and an economically optimized replacement schedule.
The facilities that consistently achieve 99%+ methane recovery and zero off-spec events are those that have transitioned from time-based membrane replacement to condition-based change-out scheduling driven by real-time selectivity monitoring. That transition does not require new sensors, new membrane elements, or a different upgrading system — it requires a data platform that extracts membrane health intelligence from the data already flowing through your control system. iFactory's platform delivers that intelligence with weeks of predictive lead time, quantified revenue impact projections, and closed-loop validation of every replacement decision. Book a Demo to see how much methane your current membrane system is losing to undetected degradation.
Eliminate Methane Slip and Maximize Membrane Life with AI-Driven Health Analytics
iFactory's membrane health monitoring platform delivers continuous selectivity tracking, weeks-predictive degradation alerts, and condition-based replacement optimization for every membrane stage — without requiring new sensors or control system modifications. Deploy in 2–3 weeks and start recovering methane revenue immediately.