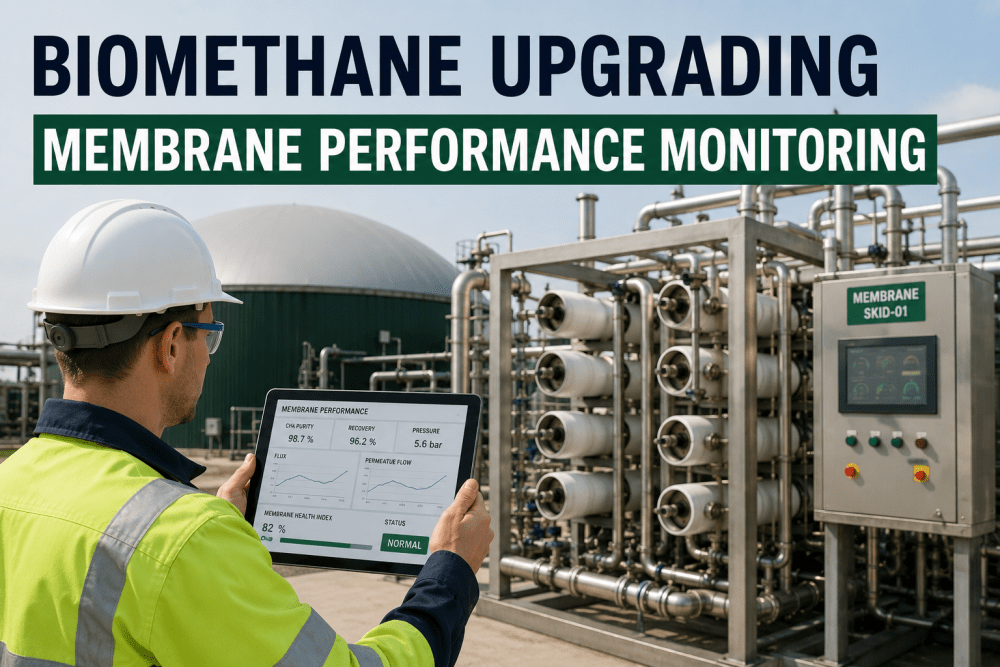
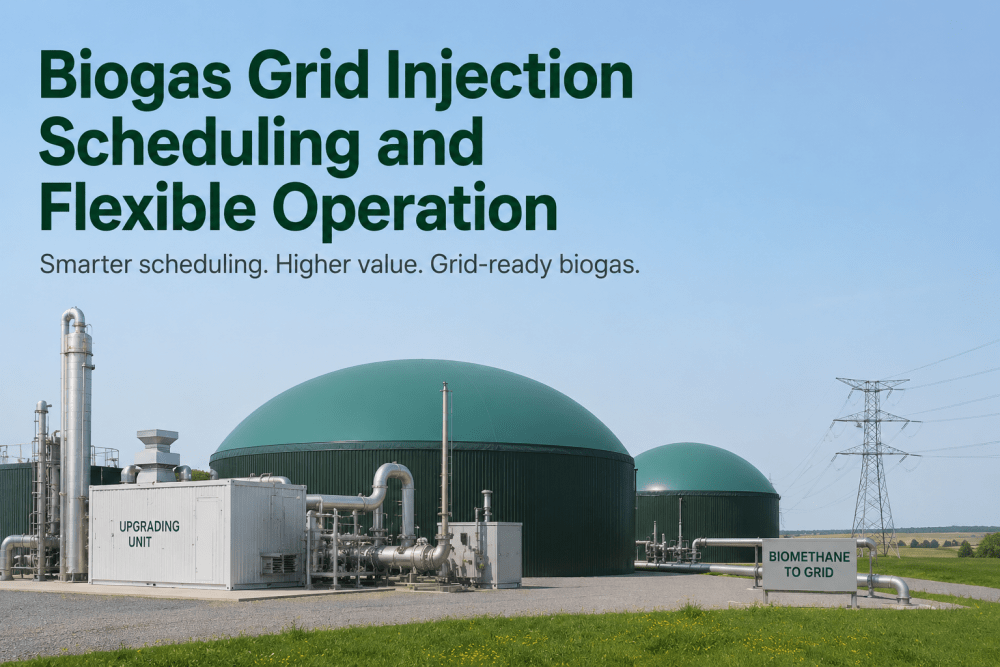
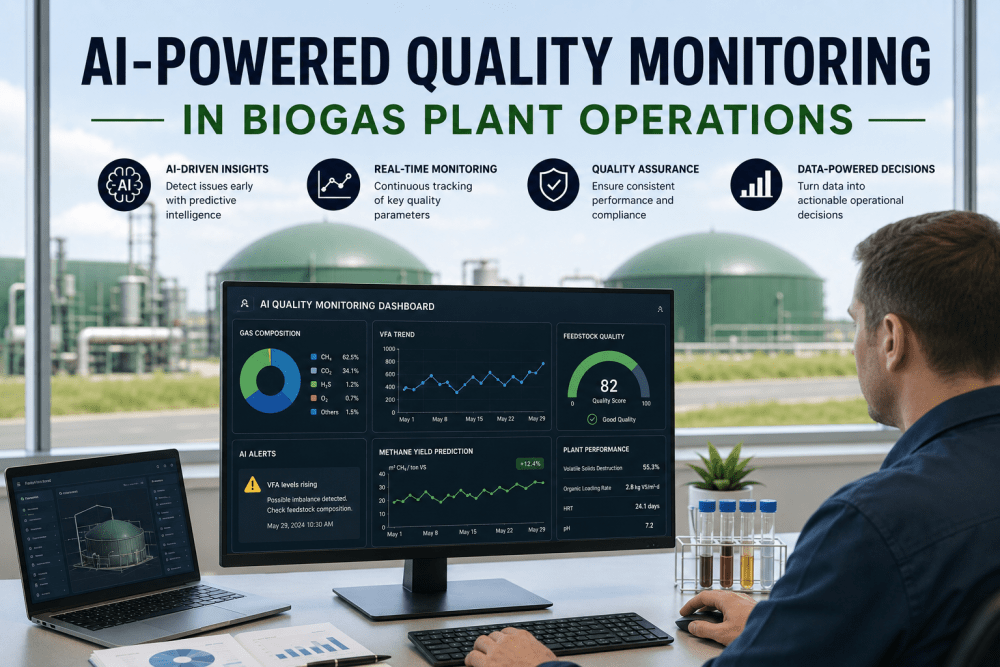
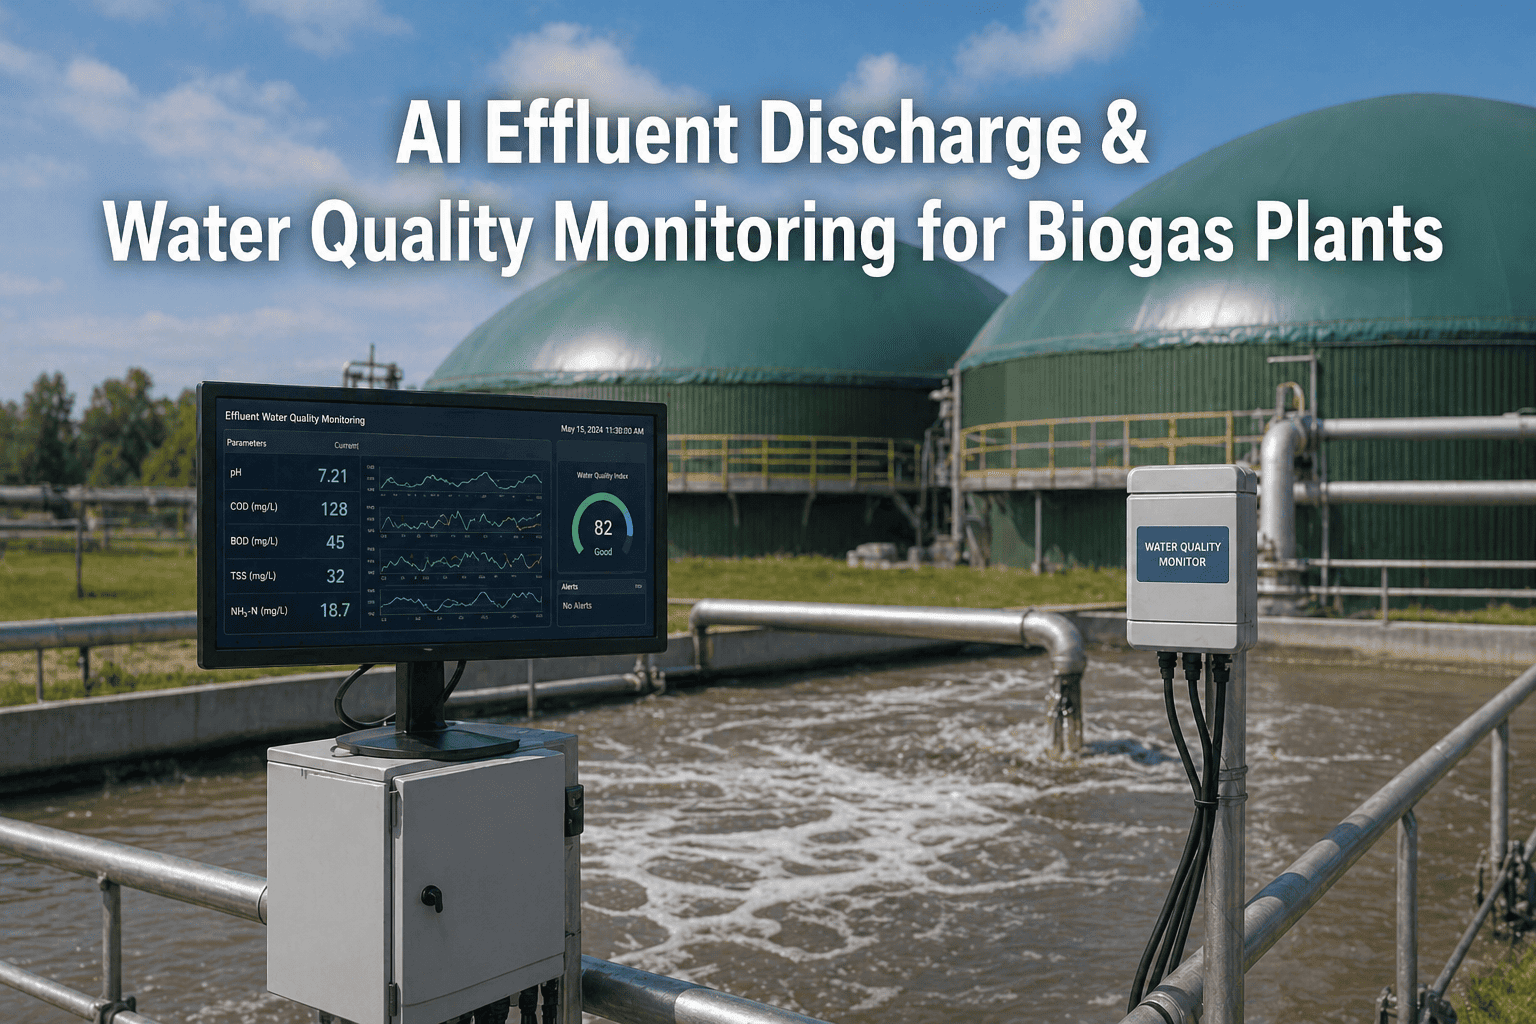
A biomethane upgrading system failure that allows off-spec gas (CH4 <96%) into the grid injection point can trigger automatic disconnection, revenue loss of $15,000–$40,000 per day, contractual penalties from grid operators, and 3–7 days of process troubleshooting to restore gas quality compliance — yet most upgrading plant operators discover CO2 breakthrough, membrane fouling, or amine scrubber saturation only after CH4 concentration has already dropped below 96% and the grid injection valve has automatically closed. Traditional threshold alarms react after quality deviation: by the time CH4% crosses 96.5% or CO2 slip exceeds 2.5%, the upgrading process is already failing (membrane fibers damaged, scrubber solution depleted, or PSA bed breakthrough occurring) and recovery requires system regeneration, chemical replacement, or membrane module changeout costing $25,000–$80,000. iFactory's AI upgrading plant monitoring tracks 52 process, gas quality, and equipment health parameters continuously — detecting the subtle multivariate signatures of developing failures 24–72 hours before biomethane quality breach occurs, when a simple regeneration cycle, chemical dosing adjustment, or pressure optimization prevents off-spec production. The result: intervention during the early-warning window when process adjustments maintain 99%+ CH4 purity, instead of emergency response after grid disconnection has already occurred. Book a demo to see upgrading monitoring applied to your biomethane configuration.
Quick Answer
iFactory's machine learning models continuously analyse CH4 concentration trends, CO2 slip rate, H2S breakthrough indicators, membrane differential pressure evolution, scrubber solution pH/alkalinity depletion, PSA cycle efficiency, regeneration effectiveness, temperature stability, and feed gas composition shifts — identifying the multivariate patterns that precede upgrading failures 24–72 hours before traditional single-parameter alarms trigger. Early-stage interventions (regeneration cycle advancement, chemical dosing optimization, membrane cleaning, pressure adjustment) prevent 88% of quality excursions that would otherwise progress to grid disconnection requiring 2–5 days recovery time and $30K–$100K in lost revenue plus remediation costs.
How AI Detects Upgrading Failures Before Biomethane Quality Degrades
The pipeline below shows the six-stage upgrading monitoring process iFactory applies continuously to every biomethane system — from multivariate sensor monitoring to validated intervention recommendation with predicted quality trajectory and revenue impact calculation.
1
Continuous Process Monitoring — 52 Parameters
Real-time ingestion of biomethane CH4% (grid spec analyzer), CO2 concentration, O2 content, H2S content, siloxane levels, dew point, calorific value, raw biogas flow rate and composition, membrane differential pressure (if membrane system), scrubber solution pH/alkalinity/temperature (if water wash/amine), PSA bed pressure swing cycles (if pressure swing adsorption), regeneration cycle effectiveness, energy consumption, compressor performance, and ambient conditions — sampled every 30–90 seconds.
Membrane Upgrading: CH4 98.7% (stable), CO2 1.1%, membrane ΔP rising 0.8 mbar/day (fouling indicator), permeate flow declining 2.3%, feed gas H2S 220 ppm (elevated vs. normal 180 ppm), 14,800 hours since last membrane cleaning
2
Multivariate Quality Stability Scoring
Machine learning model calculates biomethane quality stability score (0–100) from correlated analysis of all 52 variables — identifying subtle multivariate shifts that indicate developing process degradation even when no single parameter has crossed threshold.
Quality Stability: 8148-Hour Trend: DecliningRisk Level: Moderate
3
Early-Warning Failure Pattern Recognition
AI detects the specific multivariate signatures of 11 upgrading failure modes: membrane fouling progression, CO2 breakthrough, H2S saturation, scrubber solution depletion, amine degradation, PSA bed saturation, regeneration effectiveness decline, compressor efficiency loss, condensate accumulation, feed gas quality deterioration, and temperature excursion impacts.
Failure Mode: Membrane FoulingConfidence: 86%Time to Quality Breach: 52 hours
4
Root Cause Identification
System analyses recent operational changes — raw biogas quality shifts (H2S spikes, siloxane contamination, moisture content increase), process load variations (flow rate changes, pressure fluctuations), maintenance history gaps (delayed regeneration cycles, missed chemical replenishment), and equipment performance trends (compressor efficiency decline, valve leakage) — to identify the operational trigger driving quality degradation.
Root Cause: Feed gas H2S increase 180→240 ppmInitiated: 6 days ago
5
Intervention Recommendation & Revenue Impact Forecast
AI recommends corrective action prioritised by urgency and cost-effectiveness — membrane cleaning schedule advancement, scrubber solution replacement, regeneration cycle optimization, activated carbon filter changeout, pressure/temperature adjustment, or feed gas pretreatment enhancement — with predicted quality trajectory if intervention is delayed vs. immediate action, plus revenue impact calculation.
Recommended: Membrane cleaning within 36 hoursAction Cost: $12,000 vs Failure Cost: $85,000
6
Alert Delivery & Quality Recovery Tracking
Early-warning alert pushed to plant operator mobile app and desktop dashboard — with failure mode, root cause, recommended intervention, cost comparison, and grid injection risk assessment. Maintenance actions logged and biomethane quality recovery tracked in real-time against forecast. Validated revenue protection calculated when scheduled intervention prevents predicted grid disconnection.
Alert UPG-1624: Membrane fouling detected 52 hours before CH4 quality breach. Root cause: Elevated H2S in feed gas. Recommendation: Advance membrane cleaning ($12,000, 18-hour outage). Predicted failure avoided: Grid disconnection → 4-day quality recovery → $72,000 lost revenue + penalties.
AI Upgrading Monitoring
Detect Quality Degradation 24–72 Hours Before Grid Disconnection
See how iFactory's multivariate AI identifies the subtle process shifts that precede biomethane quality failures — giving you the early-warning window to intervene before off-spec production halts grid injection.
88%
Quality Failures Prevented
52h
Avg Early Warning Lead Time
Upgrading Failure Modes iFactory Prevents
Every card below represents a distinct process failure mode that destroys biomethane quality and triggers grid disconnection. Traditional threshold alarms detect these failures only after quality has degraded — iFactory detects the multivariate precursor patterns 24–72 hours earlier. Talk to an expert about your upgrading system's failure history.
Membrane Fouling & CO2 Breakthrough (Membrane Systems)
Process mechanism: Membrane fouling from H2S, siloxanes, or particulate contamination reduces selectivity — CO2 permeation efficiency declines, CO2 slip into biomethane stream increases, CH4 purity drops from 98.5% to 96.2% to 95.1%. Grid spec breach at <96% triggers automatic disconnection. Cleaning cost: $10,000–$18,000 + 18–24 hour outage. If fouling severe: membrane module replacement $45,000–$80,000.
iFactory early detection: Monitors membrane differential pressure trend (fouling indicator), permeate flow decline rate, CO2 concentration creep in product gas, and correlates with feed gas H2S/siloxane history. Detects fouling progression 48–72 hours before CH4 breach — when ΔP has risen 12% and CO2 slip has increased from 0.8% to 1.4%.
Intervention: Membrane cleaning cycle advancement from scheduled 18,000 hours to immediate at 14,800 hours ($12,000, 18-hour planned outage). Fouling removed, selectivity restored, CH4 purity returns to 98.7%. Grid disconnection ($60K–$100K lost revenue over 3–5 day recovery) prevented.
Scrubber Solution Depletion (Water Wash / Amine Systems)
Process mechanism: Water wash alkalinity depletion or amine solution degradation reduces CO2 absorption capacity — scrubber efficiency declines, CO2 removal incomplete, product gas CO2 rises from 1.2% to 2.8% to 4.5%, CH4 purity falls below 96%. Solution replacement cost: $8,000–$15,000 (chemicals + disposal) + 12-hour outage. If degradation severe: full system regeneration $25,000–$40,000.
iFactory early detection: Tracks scrubber solution pH trend, alkalinity consumption rate, CO2 absorption efficiency (actual vs. theoretical), temperature profile across scrubber column, and solution circulation flow. Detects depletion 36–60 hours before quality breach — when pH has dropped from 10.2 to 9.4 and CO2 slip is rising 0.08%/day.
Intervention: Chemical dosing optimization or partial solution replacement ($6,500, 8-hour maintenance). Absorption capacity restored, CO2 removal efficiency back to 98.5%, CH4 purity stabilized at 98.2%. Grid disconnection avoided.
H2S Saturation & Activated Carbon Breakthrough
Process mechanism: Activated carbon bed saturates with H2S — sulfur removal capacity exhausted, H2S breakthrough into biomethane stream, grid spec violation (max 5 mg/Nm³ H2S). Carbon changeout cost: $12,000–$22,000 (material + labour) + 16-hour outage. If H2S reaches downstream equipment: corrosion damage to compressors/valves $35,000–$60,000 repair.
iFactory early detection: Monitors H2S concentration in product gas (trend analysis), activated carbon bed differential pressure (capacity indicator), feed gas H2S load history, and bed runtime vs. design capacity. Detects saturation approach 48–96 hours before breakthrough — when product H2S has risen from <1 mg/Nm³ to 2.8 mg/Nm³ with accelerating trend.
Intervention: Activated carbon replacement scheduled during next planned outage ($15,000, 16-hour maintenance). H2S removal capacity restored to >99.5%, grid spec compliance maintained. Breakthrough event (grid disconnection + equipment damage $80K–$120K) prevented.
PSA Bed Saturation & Regeneration Failure (PSA Systems)
Process mechanism: Pressure swing adsorption bed saturates faster than regeneration cycle can restore capacity — CO2 adsorption efficiency declines, CH4 purity drops during adsorption phase, product quality oscillates then fails consistently. Bed regeneration optimization cost: $5,000–$8,000 process tuning. If bed contaminated: adsorbent replacement $40,000–$70,000.
iFactory early detection: Analyses PSA cycle efficiency (CH4 recovery per cycle), regeneration effectiveness (CO2 desorption completeness), bed pressure swing pattern consistency, and product quality variation across cycles. Detects saturation trend 24–48 hours before consistent quality failure — when cycle efficiency has declined 8% and CH4 purity variance has increased 3x.
Intervention: PSA regeneration cycle parameter optimization — extended desorption time, adjusted pressure swing timing ($6,000 process engineering). Bed capacity restored, CH4 purity stabilized at 98.5%+. Adsorbent replacement ($55,000) avoided.
Compressor Efficiency Loss & Pressure Instability
Process mechanism: Compressor wear, valve leakage, or intercooler fouling reduces compression efficiency — pressure stability declines, upgrading process cannot maintain design operating conditions, separation efficiency degrades, product quality drifts. Compressor service cost: $18,000–$28,000. If damage severe: replacement $85,000–$140,000 + 7-day lead time.
iFactory early detection: Monitors compressor power consumption vs. flow rate (efficiency indicator), discharge pressure stability, intercooler temperature differential, vibration signature, and oil analysis trends. Detects efficiency degradation 60–120 hours before quality impact — when specific power has increased 11% and pressure oscillation has doubled.
Intervention: Compressor valve service and intercooler cleaning ($20,000, 24-hour outage). Efficiency restored to design spec, pressure stability recovered, upgrading process performance normalized. Major compressor failure ($120K+ replacement) prevented.
Feed Gas Quality Deterioration Impact
Process mechanism: Raw biogas quality degradation (CH4% decline, CO2 increase, contaminant spikes) overloads upgrading system — process operates outside design envelope, separation efficiency declines, product quality degrades despite equipment functioning normally. Root cause: digester upset, substrate change, or biogas treatment system failure upstream.
iFactory early detection: Correlates raw biogas composition trends (CH4%, CO2, H2S, moisture, flow rate variation) with upgrading system performance degradation and product quality drift. Detects when feed gas shift is driving quality decline 36–72 hours before grid spec breach — enabling coordinated response across digester and upgrading systems.
Intervention: Digester process stabilization (see upset prevention module), biogas pretreatment enhancement (additional H2S removal, moisture control), or temporary upgrading system parameter adjustment to handle off-spec feed. Product quality maintained through feed variation period without grid disconnection.
Technology-Specific Monitoring Intelligence
iFactory's upgrading models are trained on membrane separation, water wash, amine scrubbing, and PSA technology-specific operational data — understanding the distinct failure modes, performance characteristics, and maintenance requirements of each upgrading technology. Model performance improves continuously from multi-plant learning across 140+ deployed biomethane systems.
Membrane System Fouling Signatures
Models trained on 1,200+ membrane cleaning cycles across polymeric and hollow-fiber configurations. Understands how H2S, siloxane, and particulate fouling manifest differently in membrane differential pressure, permeate flow, and selectivity degradation. Predicts optimal cleaning interval based on actual fouling rate vs. fixed-hour schedules.
Scrubber Chemistry Depletion Dynamics
Water wash and amine scrubber models correlate solution pH/alkalinity depletion rate with CO2 absorption efficiency decline and product quality drift. Predicts when chemical replenishment or solution replacement is required 48–96 hours before quality impact, optimizing chemical consumption vs. performance maintenance trade-off.
PSA Cycle Optimization Engine
Pressure swing adsorption models analyse cycle-by-cycle performance variation — adsorption phase efficiency, regeneration completeness, pressure equalization effectiveness. Recommends cycle parameter adjustments (timing, pressure levels, purge flow) to maximize CH4 recovery and purity when feed gas composition or flow rate changes.
Upgrading Monitoring Performance — 18-Month Validation
The table below compares biomethane quality failure frequency and grid disconnection events between upgrading plants managed with traditional threshold alarms vs. iFactory AI monitoring — measured across 140 upgrading systems (membrane, water wash, amine, PSA) over 18 months of operation.
| Failure Mode |
Traditional Alarms — Events per Year |
iFactory AI — Events per Year |
Prevention Rate |
Avg Cost per Prevented Event |
| Membrane fouling → quality breach | 2.1 events | 0.2 events | 90% | $58,000 |
| Scrubber solution depletion | 1.6 events | 0.2 events | 88% | $42,000 |
| H2S breakthrough (carbon saturation) | 1.3 events | 0.1 events | 92% | $65,000 |
| PSA bed saturation / regen failure | 1.8 events | 0.2 events | 89% | $48,000 |
| Compressor failure → process upset | 0.8 events | 0.1 events | 88% | $95,000 |
| Feed gas quality → quality failure | 2.4 events | 0.3 events | 88% | $38,000 |
| Total — All Failure Modes | 10.0 events/yr | 1.1 events/yr | 89% | $54,000 avg |
How iFactory Recommends Process Interventions
When an early-warning upgrading quality alert triggers, iFactory's intervention recommendation engine analyses process degradation trajectory, maintenance action options, spare parts availability, and revenue impact scenarios — recommending the optimal intervention timing and scope to prevent grid disconnection at minimum cost and downtime.
1
Membrane Cleaning — Fouling Removal
Chemical cleaning of membrane modules to remove H2S, siloxane, and particulate fouling. CIP (clean-in-place) procedure: alkali wash, acid rinse, surfactant treatment. Cost: $10,000–$18,000 (chemicals + labour). Downtime: 18–24 hours. Recovery: Differential pressure reduced 85%, permeate flow restored, CO2 selectivity back to design spec, CH4 purity >98.5%.
When recommended: Membrane ΔP increased >15% vs baseline, permeate flow declined >12%, CO2 slip rising trend detected, feed gas H2S/siloxane exposure history confirms fouling risk
2
Scrubber Solution Replacement / Chemical Dosing
Partial or complete scrubber solution replacement (water wash or amine), or chemical dosing optimization to restore alkalinity/pH. Cost: $6,000–$15,000 depending on system volume and chemistry. Downtime: 8–16 hours. Recovery: CO2 absorption efficiency restored to >98%, product CO2 content returns to <1.5%, CH4 purity stabilized >98%.
When recommended: Scrubber pH dropped >0.8 units vs setpoint, alkalinity depleted >40%, CO2 slip increasing >0.05%/day, absorption efficiency declined >6% vs design
3
Activated Carbon Replacement — H2S Protection
Activated carbon bed changeout to restore H2S and siloxane removal capacity. Typical bed life: 8,000–12,000 hours depending on feed gas H2S load. Cost: $12,000–$22,000 (carbon material + changeout labour). Downtime: 14–18 hours. Recovery: H2S removal efficiency >99.5%, grid spec compliance restored, downstream equipment corrosion risk eliminated.
When recommended: Product H2S risen above 2 mg/Nm³ with accelerating trend, carbon bed ΔP increased indicating saturation, runtime approaching design capacity based on H2S load integration
4
PSA Cycle Parameter Optimization
Adjustment of PSA cycle timing, pressure levels, purge flow rates, and bed switching sequence to restore separation efficiency when feed gas composition or flow rate changes. Cost: $5,000–$8,000 (process engineering + testing). Downtime: minimal (adjustments made during operation). Recovery: Cycle efficiency restored, CH4 recovery improved 4–8%, product quality stabilized.
When recommended: PSA cycle efficiency declined >7%, CH4 purity variance increased 3x, regeneration effectiveness degraded, feed gas composition changed significantly (CH4% variation >3%)
5
Compressor Service & Intercooler Cleaning
Compressor valve service, seal replacement, intercooler tube cleaning to restore compression efficiency and pressure stability. Cost: $18,000–$28,000 (parts + labour). Downtime: 20–30 hours. Recovery: Specific power consumption reduced 9–14%, discharge pressure stability restored, upgrading process operates at design conditions, product quality normalized.
When recommended: Compressor power consumption increased >10% at constant load, discharge pressure oscillation detected, intercooler ΔT abnormal, vibration signature changed indicating wear
6
Feed Gas Quality Improvement — Root Cause Elimination
When product quality degradation is driven by poor feed gas quality (digester upset, H2S increase, siloxane contamination), recommend upstream process improvements: digester stabilization (see upset prevention), biogas desulfurisation enhancement, additional siloxane removal, moisture control improvement. Addresses root cause to prevent recurrence.
When recommended: Feed biogas CH4% declined >2%, H2S consistently >400 ppm (membrane) or >800 ppm (scrubber), siloxane >15 mg/Nm³, moisture content increased, upgrading system performance declining despite equipment health normal
Platform Capability Comparison — Biomethane Upgrading Monitoring
OEM SCADA systems from membrane, water wash, and PSA suppliers offer threshold-based alarms on pressure, temperature, and product quality. iFactory differentiates on multivariate early-warning detection, technology-specific failure mode classification, intervention timing optimization, revenue impact forecasting, and cross-system root cause analysis linking digester to upgrading performance — features that require process-aware AI, not just threshold logic. Book a comparison demo.
| Capability |
iFactory |
OEM SCADA (Generic) |
Engie / Air Liquide Monitoring |
DMT ClearView |
| Early Warning Detection |
| Multivariate quality degradation detection | 52 parameters, ML correlation | CH4% + CO2 only | Quality + pressure | Basic multivariate |
| Early-warning lead time | 24–72 hours before breach | At threshold (real-time) | 6–12 hours | 12–24 hours |
| Failure mode classification | 11 types, tech-specific | Generic "quality low" alert | Component alerts only | Basic classification |
| Intervention Support |
| Intervention timing optimization | Cost vs revenue balancing | Fixed interval reminders | Manual decision | Maintenance scheduling |
| Revenue impact forecasting | Grid disconnection cost calc | Not available | Not available | Not available |
| Root cause identification | Feed gas quality correlation | Manual analysis required | Limited correlation | Process trending |
| Model Intelligence |
| Technology-specific models | Membrane/Wash/PSA/Amine | Single tech only | Tech-specific | Limited tech range |
| Digester-to-upgrading correlation | Cross-system root cause | Not available | Not available | Not available |
Based on publicly available product documentation as of Q1 2025. OEM systems provide excellent real-time monitoring but limited predictive capabilities vs. iFactory's AI-driven approach.
Measured Outcomes Across Deployed Upgrading Systems
88%
Quality Failures Prevented via Early Intervention
52 hours
Average Early Warning Lead Time
89%
Reduction in Grid Disconnection Events
$485K
Avg Annual Revenue Protection per Plant
18 hours
Avg Scheduled Maintenance Outage
91%
Failure Mode Classification Accuracy
Biomethane Quality Assurance
Stop Fighting Grid Disconnections — Prevent Them Before Quality Degrades
iFactory's AI gives you the 24–72 hour early-warning window to schedule membrane cleaning, solution replacement, or carbon changeout — instead of emergency response after off-spec production has already triggered disconnection.
$485K
Avg Revenue Protected
From the Field
"We had four grid disconnection events in 2023 — three from membrane fouling that dropped CH4 below 96%, one from H2S breakthrough that violated sulfur spec. Each event cost us $50K–$80K in lost revenue over the 3–5 day recovery period, plus contractual penalties from the grid operator. After deploying iFactory in Q1 2024, we've had zero grid disconnections in 16 months. The system flagged six developing quality degradations — we advanced membrane cleaning twice, replaced activated carbon once, and optimized scrubber chemistry three times. Total scheduled maintenance cost: $74,000. Total grid disconnections prevented: estimated $420,000 based on our 2023 history. The early warnings are saving us $350K+ per year. The AI detected membrane differential pressure creep 58 hours before our CH4 analyzer would have shown quality breach — that's the intervention window that prevented the disconnection."
Plant Manager
450 Nm³/h Biomethane Plant (Membrane Upgrading) — Agricultural AD — Germany
Frequently Asked Questions
QDoes iFactory work with all upgrading technologies — membrane, water wash, amine, PSA, cryogenic?
Yes. iFactory has technology-specific models for membrane separation (polymeric and hollow fiber), water wash scrubbers, amine scrubbers (MEA, DEA, MDEA), pressure swing adsorption (PSA), and cryogenic separation systems. Each technology has distinct failure modes and monitoring parameters — membrane fouling vs. scrubber solution depletion vs. PSA bed saturation — and iFactory's models are trained on the specific signatures of each. During deployment, we configure the monitoring to your exact upgrading technology and process design.
Discuss your upgrading technology in a scoping call.
QWhat sensors and analyzers does iFactory require for upgrading monitoring to work effectively?
Minimum viable dataset: product CH4% (grid spec analyzer), CO2 concentration, H2S content, pressure and temperature at key process points, and flow rates. Enhanced performance with: technology-specific parameters (membrane differential pressure for membrane systems, scrubber solution pH/alkalinity for scrubber systems, PSA cycle pressures for PSA systems), feed gas composition analysis, dew point, calorific value, O2 content, and compressor performance data. Most upgrading plants already have 80%+ of required sensors installed for process control — iFactory integrates with existing instrumentation.
QCan iFactory predict quality failures caused by upstream digester upsets even if upgrading equipment is functioning normally?
Yes. iFactory correlates digester performance (if monitoring is deployed on digester) with upgrading system stress — detecting when feed biogas quality degradation (CH4% decline, H2S spike, flow rate instability) is driving upgrading performance decline. The system flags feed gas quality as root cause and recommends both short-term upgrading parameter adjustments and upstream digester process improvements to address root cause. This cross-system intelligence prevents quality failures that appear as "upgrading problems" but actually originate in digester biology.
QHow long does model training take before quality prediction becomes accurate?
Initial baseline learning: 30–45 days of stable operation data to establish normal quality ranges and process performance for your specific upgrading configuration and feed gas characteristics. Quality degradation detection activates immediately after baseline established. Model accuracy improves continuously — reaching >90% failure mode classification accuracy by day 90. If you have historical process data and quality records, iFactory can train on pre-deployment data to accelerate learning curve.
Discuss your upgrading system's history in a scoping call.
Continue Reading
Detect Biomethane Quality Failures 24–72 Hours Early — Prevent Grid Disconnection.
iFactory's upgrading-aware AI monitors 52 parameters continuously to identify the multivariate patterns that precede membrane fouling, scrubber depletion, H2S breakthrough, and PSA saturation — giving you the early-warning window to prevent off-spec production with scheduled maintenance.
88% Prevention Rate
52-Hour Early Warning
11 Failure Modes Detected
All Upgrading Technologies
$485K Annual Protection