Every biogas upgrading facility producing pipeline-quality RNG also produces a roughly equal volume of CO2 as a byproduct of the membrane, PSA, or amine separation process. To evaluate whether your facility's CO2 stream qualifies for merchant market sale and what purification infrastructure is required, Book a Demo with iFactory's biogas CO2 monetization engineering team today.
The CO₂ Revenue Opportunity: Market Economics Every Biogas Plant Owner Should Know
The North American merchant CO₂ market has experienced a structural transformation over the past three years that directly benefits biogas upgrading facility owners. Traditional CO₂ supply sources — ammonia production, ethanol fermentation, and natural gas processing — have become less reliable as these industries face their own economic and regulatory pressures. .
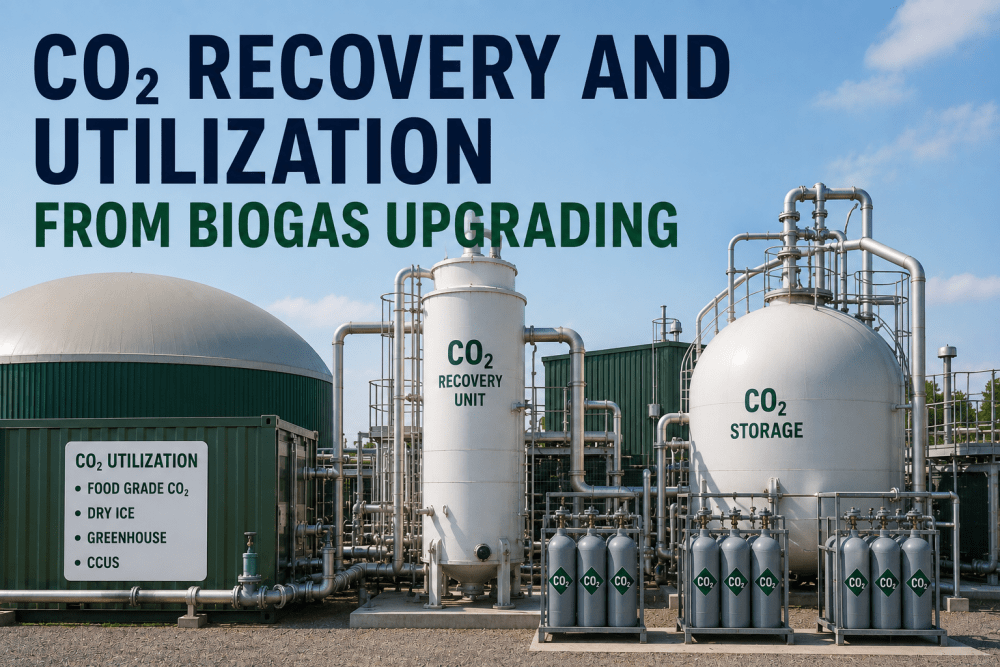
CO₂ Utilization Pathways: Five Monetization Routes from Vent to Revenue
The value of biogas-derived CO₂ depends primarily on the purity level the facility can achieve and the purification and liquefaction infrastructure it is willing to invest in. Each monetization pathway has distinct gas quality requirements, capital requirements, and revenue profiles that must be evaluated against the facility's specific CO₂ flow rate, contaminant profile, and proximity to end markets. iFactory's CO₂ monetization platform models each pathway against real-time gas quality data to identify the highest-value use case for every ton of CO₂ produced.
Food and Beverage Grade CO₂ — The Highest-Value Pathway
Food-grade CO₂ requires the strictest purity specifications: minimum 99.9% CO₂ with maximum 10 ppm O₂, 1 ppm H₂S, 5 ppm total hydrocarbons, and 20 ppm water content. Biogas-derived CO₂ can achieve this specification with appropriate contaminant removal — primarily H₂S polishing, oxygen stripping, and trace VOC treatment. The beverage industry consumes approximately 40% of the North American merchant CO₂ market, with seasonal summer demand spikes that can drive spot prices above $600 per ton.
Dry Ice Production — The Logistical Advantage
Converting liquid CO₂ to dry ice adds a second value-adding step that increases revenue per ton by 25–40% while reducing logistical constraints. Dry ice sublimes at –78.5°C and can be stored and transported without pressurized cryogenic vessels, opening markets — food processing, cold chain logistics, industrial cleaning — that are inaccessible to liquid CO₂ distributors. For biogas facilities located within 200 miles of major food processing or logistics hubs, dry ice production can capture an additional $80–$150 per ton over liquid CO₂ pricing.
Greenhouse CO₂ Enrichment — The Local Market Opportunity
Commercial greenhouse operations inject CO₂ to accelerate plant growth, with optimal enrichment levels of 800–1,200 ppm versus ambient 420 ppm. A single 10-acre greenhouse facility can consume 500–1,500 tons of CO₂ annually — representing an addressable market of approximately 12–25 greenhouses per 1,000 scfm upgrading facility. Greenhouse CO₂ requires only industrial-grade purity (≥ 98%), eliminating the need for food-grade certification infrastructure. For biogas plants located near concentrated greenhouse regions — California's Central Coast, the Southwest desert corridor, the Northeast protected agriculture cluster — direct pipeline CO₂ delivery to greenhouses offers the highest margin per ton due to minimal processing requirements.Book a Demo
CCUS and Enhanced Oil Recovery — The Carbon Credit Pathway
Injection of CO₂ into depleted oil reservoirs for enhanced oil recovery generates revenue through two mechanisms: the CO₂ sales price ($15–$40 per ton) and the 45Q tax credit ($85 per ton for geologic storage, $60 per ton for EOR under the Inflation Reduction Act). Biogas-derived CO₂ qualifies for additional LCFS extra-credits in California and Oregon due to its biogenic origin and negative carbon intensity. The total revenue stack for CCUS — EOR sales + 45Q credit + LCFS extra-credit — can reach $120–$180 per ton, competitive with food-grade pricing without requiring the same purity certification. The trade-off is pipeline or trucking distance to the injection site, which can consume 15–30% of the revenue in transport costs.
Chemical and Fuel Feedstock — The Emerging Markets
CO₂ is increasingly used as a chemical feedstock for synthetic fuels, methanol production, urea synthesis, and polymer manufacturing. While these markets are currently smaller than beverage or EOR demand, they are growing rapidly due to the Inflation Reduction Act's 45V clean hydrogen production tax credit, which creates strong incentives for CO₂-based e-fuels and e-methanol. A biogas upgrading facility producing 12,000 tons of CO₂ per year can supply the feedstock for approximately 3 million gallons of e-methanol annually. These pathways typically require high-purity CO₂ with strict trace contaminant limits, similar to food-grade specifications, but command long-term offtake agreements that reduce market risk for the facility owner.
CO₂ Quality Specifications: The Purity Requirements That Determine Revenue
The selling price of biogas-derived CO₂ is determined almost entirely by purity. The difference between industrial-grade and food-grade CO₂ pricing — $150–$400 per ton — represents the value of removing less than 0.5% total impurities from the gas stream. Understanding exactly which contaminants must be removed and to what threshold is the starting point for any CO₂ monetization investment decision.Book a Demo
| Parameter | Industrial Grade | Food & Beverage Grade | Greenhouse Grade | CCUS/EOR Grade | iFactory AI Monitoring |
|---|---|---|---|---|---|
| CO₂ Purity | ≥ 98.0% | ≥ 99.9% | ≥ 98.0% | ≥ 95.0% | Continuous purity trending with off-spec alerts |
| Oxygen (O₂) | ≤ 100 ppm | ≤ 10 ppm | ≤ 100 ppm | ≤ 100 ppm | Zirconia or paramagnetic O₂ analyzer integration |
| Hydrogen Sulfide (H₂S) | ≤ 5 ppm | ≤ 1 ppm | ≤ 10 ppm | ≤ 10 ppm | Real-time H₂S with bed-change forecasting |
| Total Hydrocarbons | ≤ 50 ppm | ≤ 5 ppm | ≤ 50 ppm | ≤ 50 ppm | FID or GC continuous measurement |
| Water (H₂O) | ≤ 50 ppm | ≤ 20 ppm | ≤ 50 ppm | ≤ 30 ppm | Dew point monitoring with dryer performance alerts |
| Nitrogen (N₂) | ≤ 1.5% | ≤ 0.05% | ≤ 1.5% | ≤ 4.0% | GC composition tracking |
CO₂ Purification and Liquefaction: From Upgrading Tail Gas to Merchant Product
The transformation of raw upgrading tail gas — the CO₂-rich stream from a membrane, PSA, or amine system — into a saleable CO₂ product involves four distinct process stages. Each stage has specific monitoring requirements, failure modes, and optimization parameters that iFactory's platform tracks continuously to maximize product quality and minimize energy consumption.
Expert Review: What the CO₂ Monetization Models Don't Tell You
The CO₂ monetization models I review from biogas facility owners consistently underestimate two things: the contaminant variability of the upgrading tail gas and the certification cost for food-grade product. I have seen facilities budget $1.5 million for a liquefaction skid and neglect to budget for the H₂S polishing bed change-out schedule, the oxygen catalyst replacement cost, and the monthly third-party gas certification testing that the beverage buyer requires. The tail gas from a membrane system operating with a 60:1 selectivity is not the same composition as the tail gas from that same membrane system operating at 30:1 selectivity two years later — and the purification train has to handle both conditions. iFactory's real-time quality monitoring closes that gap by alerting the operations team when contaminant levels are trending toward the certification threshold, allowing preemptive adjustment of the purification parameters before a truckload is rejected at the buyer's receiving gate. The difference between a CO₂ monetization program that delivers projected returns and one that bleeds margin in unplanned purification costs is continuous quality visibility. Without it, you are certifying product quality on a weekly GC sample and hoping the other 167 hours of production met the same specification.
Frequently Asked Questions
The minimum economic facility size for CO₂ recovery depends on the target market pathway. For industrial-grade CO₂ sales to greenhouse or local industrial users, a facility producing at least 4,000–6,000 tons of CO₂ per year (approximately 350–500 scfm of biogas upgrading capacity) is typically viable with basic dehydration and compression infrastructure. For food-grade CO₂ production with full liquefaction and certification, the minimum economic threshold rises to 8,000–12,000 tons per year (700–1,000 scfm) due to the higher capital cost of the purification and liquefaction train and the fixed cost of third-party certification testing.Book a Demo
CO₂ recovery has a minimal effect on the primary RNG upgrading operation when properly integrated, because the CO₂ stream is already separated from the methane product by the upgrading process — recovering and purifying the CO₂ does not affect the methane recovery or purity in the product gas stream. The primary interaction effects are: the CO₂ compression and liquefaction system draws electrical power that reduces the facility's net electricity export or increases purchased power consumption by 15–30 kW per ton of liquid CO₂ produced; the CO₂ purification system may divert a small fraction of the tail gas flow during regeneration cycles, temporarily reducing CO₂ recovery efficiency by 1–3%; and the CO₂ storage and loading operation requires physical space adjacent to the upgrading skid. RIN and LCFS credit generation from the RNG stream is unaffected by CO₂ recovery, and in some pathways — particularly CCUS with 45Q — the CO₂ recovery adds an additional credit stream that increases total facility revenue by 30–60% without increasing biogas production. iFactory's integrated RNG + CO₂ analytics platform models both revenue streams simultaneously to optimize the total facility economics, accounting for the energy and operational interactions between the upgrading and CO₂ recovery systems.
Selling CO₂ for food and beverage applications requires compliance with the FDA Food Additive regulations (21 CFR 184.1240 — CO₂ affirmed as Generally Recognized as Safe) and adherence to the industry quality standards defined by the International Society of Beverage Technologists (ISBT) and the Compressed Gas Association (CGA G-6.2 — Carbon Dioxide Quality Specification for Food and Beverage Applications). The key certification requirements are: product quality must be certified by an independent third-party laboratory at least quarterly, with audit-grade documentation retained for minimum three years; the HACCP plan covering the CO₂ purification, storage, and loading system must be documented and maintained; lot traceability must be maintained from the upgrading tail gas source through the purification train to the customer custody transfer point; and the CO₂ production facility must register with the FDA as a food processing facility and maintain current Good Manufacturing Practice (cGMP) compliance. iFactory's CO₂ certification compliance module automates the quality documentation, lot traceability, and audit trail requirements — generating certificate of analysis documentation for every batch dispatched, maintaining the HACCP record in audit-ready format, and alerting the compliance team before any certification deadline approaches.
Section 45Q of the Internal Revenue Code, as amended by the Inflation Reduction Act of 2022, provides a tax credit of $85 per metric ton for CO₂ permanently sequestered in geologic formations and $60 per metric ton for CO₂ used in qualified enhanced oil recovery (EOR) — and biogas-derived CO₂ qualifies for these credits under the same provisions as CO₂ from any other source. The key requirements for 45Q qualification are: the CO₂ must be captured from an industrial source (biogas upgrading qualifies); the capture equipment must be placed in service after February 9, 2018; the CO₂ must be measured at the point of injection or utilization with continuous monitoring equipment meeting EPA Subpart RR requirements; and the credit must be claimed by the party that physically captures and disposes of or uses the CO₂ (which may be the biogas facility owner or a contracted CCUS operator).
For a typical 1,000 scfm biogas upgrading facility producing 12,000 tons of CO₂ per year, a full food-grade liquefaction and purification system with $2.0M–$2.8M total installed capital cost — including compression, dehydration, H₂S polishing, oxygen removal, liquefaction skid, distillation column, storage tank, truck loading station, and certification — delivers a payback period of 2–4 years at current food-grade CO₂ pricing of $400–$600 per ton. The key variables that determine payback are: actual CO₂ production rate (membrane systems produce less CO₂ per unit of RNG than PSA or amine systems); contaminant load (higher H₂S or O₂ content increases polishing bed operating cost); proximity to end markets (trucking cost of $20–$40 per ton for a 100-mile radius); and the achieved on-spec product rate (facilities with poor contaminant control can reject 5–15% of production below certification quality). For a facility pursuing the greenhouse pathway with only compression and dehydration at $200K–$600K capital, the payback period shortens to 1–2 years at industrial-grade pricing of $150–$250 per ton. For the CCUS pathway with 45Q credits at $75–$100 per ton total revenue, the payback on an $800K–$2.2M compression and dehydration system is typically 3–5 years depending on pipeline distance to the injection site. iFactory's CO₂ monetization platform generates a facility-specific capital payback analysis incorporating current market pricing, contaminant profile, and end-market logistics — updated quarterly as market conditions change.Book a Demo
Conclusion: The CO₂ Market Is Open — But Only for Facilities That Can Certify Quality Continuously
iFactory's CO₂ monetization platform delivers continuous quality monitoring from the upgrading tail gas through every purification stage to the loading arm. It models contaminant breakthrough in real time, projects certification margin against market specifications, and generates batch-level certificate of analysis documentation that beverage buyers and CCUS operators require. The platform does not replace your CO₂ purification equipment — it maximizes the revenue that equipment generates by ensuring every ton produced meets the specification your customer is paying for. Book a Demo to see how much of your facility's CO₂ stream is ready for merchant sale today.