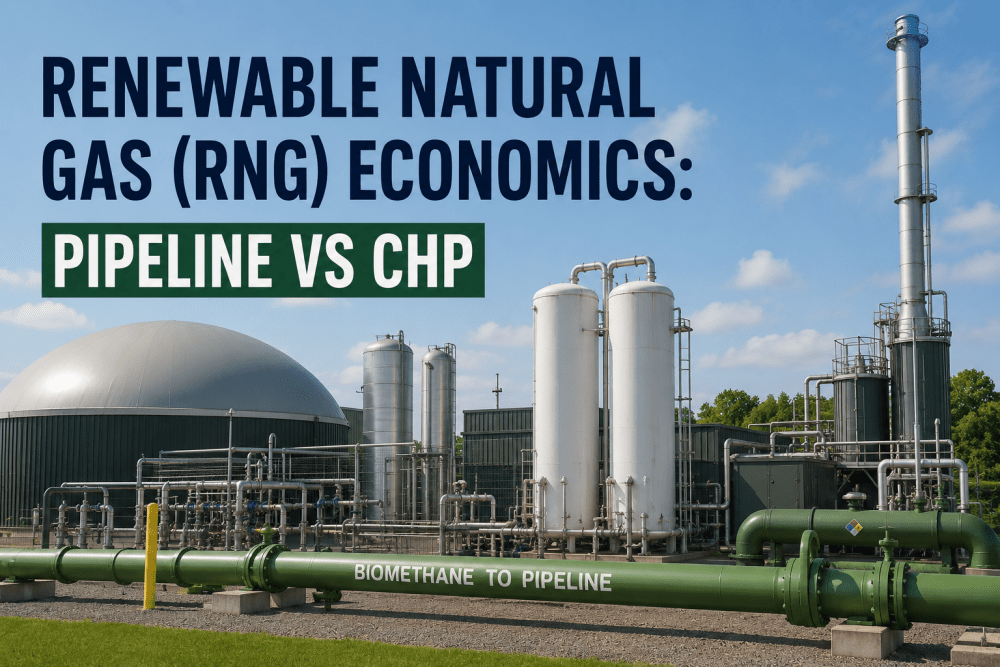
Renewable Natural Gas (RNG) Economics: Pipeline vs CHP
By Alistair Fenwick on June 20, 2026
Every biogas plant owner faces the same economic inflection point: sell the raw biogas to a CHP engine at electricity prices, or invest in upgrading equipment to produce pipeline-quality renewable natural gas and access the premium revenue stack of RIN credits, LCFS values, and voluntary RNG purchase agreements. To see how iFactory's AI-driven RNG Economics Platform models your facility's specific revenue outcomes across both pathways, Book a Demo with our RNG analytics team today.
$3.4B
Estimated annual RNG market value in North America by 2028, driven by RFS, LCFS, and voluntary offtake demand
3–4x
Revenue multiple of pipeline RNG over CHP per MMBtu when including RIN and LCFS credit values
$3.50
Approximate D3 RIN value per gallon equivalent — the primary federal incentive driving RNG project economics
2–4 Yrs
Typical RNG project payback period at current RIN and LCFS pricing for a well-optimized upgrading facility
Evaluating whether your biogas facility should upgrade to pipeline RNG or continue with CHP? Book a Demo with iFactory's RNG economics and analytics team for a site-specific revenue comparison.
RNG vs. CHP — The Economic Case for Pipeline Injection
The economic comparison between CHP and pipeline RNG begins with a single metric: revenue per MMBtu of biogas produced. A CHP engine converting biogas to electricity captures roughly $8–$15 per MMBtu of biogas input, depending on local electricity prices, heat utilization efficiency, and renewable energy credit values.
Revenue per MMBtu
CHP captures $8–$15/MMBtu through electricity sales and heat recovery. Pipeline RNG captures $30–$60/MMBtu through gas sales, RIN credits, and LCFS values — a 3–4x revenue multiple that transforms project economics at scale.
3–4X GAP
Capital Requirement
CHP requires $500K–$1.5M for a typical 500 kW–1 MW installation. Pipeline RNG requires $2M–$5M for upgrading equipment including PSA, membrane, or amine systems plus compression, pipeline interconnect, and gas quality monitoring.
HIGHER CAPEX
Revenue Certainty
CHP revenue is tied to stable electricity prices with minimal regulatory risk. RNG revenue depends on RIN and LCFS credit market stability, which are subject to federal policy changes, program rule updates, and credit price volatility that can swing 30–50% annually.
POLICY RISK
Operational Complexity
CHP is a well-understood, low-complexity operation with minimal gas quality requirements. RNG upgrading requires continuous gas composition monitoring, methane recovery optimization, and compliance documentation for RIN and LCFS credit generation — demanding significantly more operational attention.
HIGHER COMPLEXITY
RNG Revenue Stack vs. CHP Revenue — Head-to-Head Comparison
The decision between CHP and pipeline RNG requires a detailed comparison across revenue sources, cost structures, risk profiles, and time horizons. The table below provides a standardized comparison based on current market conditions and operating data from facilities that have deployed both configurations.
Parameter
CHP (Electricity + Heat)
Pipeline RNG (Upgrading)
Revenue per MMBtu Biogas
$8–$15 (electricity + heat + RECs)
$30–$60 (gas + RIN + LCFS + voluntary premiums)
Primary Revenue Driver
Electricity sales at wholesale/retail rates
D3 RIN credits ($2.50–$3.50/gal) + LCFS ($100–$200/ton CO2)
Pipeline access, high biogas flow, available capital, appetite for regulatory premium returns
The RNG Revenue Stack — Understanding RINs, LCFS, and Voluntary Credits
The economic advantage of pipeline RNG over CHP is almost entirely driven by the environmental credit value attached to renewable methane. Understanding how each credit type works, what it requires for qualification, and how market dynamics affect pricing is essential for any facility owner evaluating the upgrade decision. The checklist below maps the core components of the RNG revenue stack and the requirements each imposes on the producing facility.
D3 RINs (Renewable Identification Numbers): Generated under EPA's RFS program for cellulosic biofuel. Each RIN represents one ethanol-equivalent gallon. Current value: $2.50–$3.50/RIN. Requires EPA-approved QAP oversight, annual attestation, and continuous methane production metering with third-party verification.
LCFS Credits (Low Carbon Fuel Standard): California and Oregon LCFS programs generate credits based on the carbon intensity (CI) score of the RNG pathway. Lower CI scores generate more credits. Current value: $100–$200/ton CO2 reduced. Requires CARB-approved CI pathway verification and quarterly reporting.
Voluntary RNG Purchase Agreements: Corporate offtake agreements at premiums above natural gas benchmark prices. Fortune 500 companies with net-zero commitments pay $5–$15/MMBtu premiums for verified RNG with documented carbon intensity reductions.
Federal 45Q Tax Credit: Carbon capture and sequestration tax credit applicable to biogas upgrading systems that capture and sequester CO2 from the upgrading process. Current value: $85/ton CO2 captured for qualified facilities that meet construction commencement deadlines.
Renewable Thermal Credits (RTCs): Emerging voluntary market for renewable thermal energy. RNG injected into pipelines generates RTCs that can be sold separately from the physical gas. Market is nascent but growing, with current values of $2–$8/MMBtu for verified renewable thermal attributes.
Combined Heat and Power RECs: Even if not upgrading, CHP operations can generate Renewable Energy Certificates (RECs) for the electricity produced. Value: $1–$5/MWh depending on state RPS requirements and REC market liquidity.
$3.50
Approximate D3 RIN value per gallon — the single largest revenue component for most RNG projects
$200
California LCFS credit price per metric ton for low-CI RNG pathways (dairy, food waste)
85%
Of RNG project revenue is typically derived from environmental credits, not physical gas sales
Maximize Your RNG Revenue with AI-Driven Credit Optimization and Performance Analytics
iFactory's RNG analytics platform tracks methane production, RIN generation, LCFS pathway compliance, and upgrading system performance in real-time — ensuring you capture every dollar of environmental credit value your facility is entitled to.
Economic Decision Framework — When to Upgrade and When to Stay with CHP
The decision to upgrade biogas to pipeline RNG or continue with CHP depends on five critical factors: biogas flow rate, pipeline proximity, capital availability, operational capability, and risk tolerance for regulatory credit market exposure. The framework below maps the decision criteria across facility types, helping owners identify which pathway aligns with their specific circumstances. Operations teams building these economic models frequently Book a Demo to align iFactory's real-time data with their site-specific revenue projections.
<500 scfm
Low-Flow Biogas
CHP typically wins at low flow rates. The capital cost of upgrading equipment cannot be justified by the limited RNG volume. Best option: CHP with heat recovery for on-site thermal loads or simple flare with REC capture.
500–1,500 scfm
Mid-Flow Biogas
The decision hinges on pipeline proximity and capital availability. If a pipeline interconnect is within 1 mile and capital is accessible, RNG delivers superior returns. Without pipeline access, CHP remains the practical choice.
1,500+ scfm
High-Flow Biogas
RNG is almost always the superior economic choice at high flow rates. The upgrading capital cost is spread across significant RNG volume, and the environmental credit revenue alone typically justifies the investment within 2–3 years.
Negative CI
Low Carbon Intensity Feedstock
Dairy and food waste digesters with low CI scores generate the highest LCFS credit values. Facilities with verified CI scores below zero generate premium credits worth $150–$200+/ton — making RNG the clear economic winner.
Pipeline
Interconnect Availability
A nearby natural gas pipeline with available capacity and utility willingness to accept RNG is the single most important external factor. Interconnect costs of $200K–$800K can shift the economics if the pipeline is more than 2 miles from the facility.
Voluntary
Premium Offtake Access
Facilities with access to corporate RNG purchase agreements at $5–$15/MMBtu premiums above benchmark pricing can achieve superior returns even at moderate flow rates, reducing dependence on RIN and LCFS market volatility.
$30–60
RNG Revenue per MMBtu
Total value stack including gas sales, RIN, LCFS, and voluntary premiums at current market pricing
2–4 Yrs
RNG Project Payback
Typical payback period for well-structured RNG projects at current credit pricing and upgrading performance
85%
Revenue from Credits
Share of total RNG project revenue derived from environmental credits rather than physical gas sales
3–4x
CHP vs RNG Revenue
Revenue multiple advantage of pipeline RNG over CHP per MMBtu of biogas consumed
How iFactory AI Optimizes RNG Project Economics
The difference between a biogas upgrading project that achieves its projected 2-year payback and one that struggles to break even at year four is almost always a data problem — not a technology problem. Upgrading systems degrade in performance over time. Methane slip increases. Energy consumption drifts. RIN documentation gaps emerge. LCFS pathway compliance records fall behind. iFactory's AI-driven RNG analytics platform monitors every variable that affects project economics in real-time — from upgrading system methane recovery efficiency to RIN generation tracking to LCFS CI pathway documentation — ensuring that the revenue projections your business case was built on remain accurate throughout the project life. Maintenance teams deploying these analytics typically find it valuable to Book a Demo to see how platform data transforms their economic modeling approach.
01
Continuous Methane Recovery Monitoring
iFactory tracks upgrading system methane recovery in real-time using inlet/outlet gas composition analysis and mass flow correlation. A 1% drop in methane recovery represents $15,000–$40,000 in annual lost RNG revenue at a mid-size facility. The platform alerts operators to recovery degradation before it accumulates into material margin loss.
02
RIN Generation and Compliance Documentation
Automated RIN generation tracking with EPA QAP-compliant data logging. The platform records every cubic meter of RNG produced, correlates it with gas quality data, and generates the audit-ready documentation required for EPA RIN verification and third-party QAP review.
03
LCFS Pathway CI Tracking and Reporting
iFactory calculates your facility's real-time carbon intensity score based on actual operational data — electricity consumption, thermal energy use, feedstock methane generation, and fugitive emissions — and generates CARB-compliant LCFS pathway documentation that maximizes credit value per MMBtu.
04
Upgrading System Energy Optimization
Energy consumption is the largest operating cost in RNG production. iFactory's AI optimizes compressor sequencing, temperature setpoints, and pressure control to minimize energy per MMBtu of RNG delivered — reducing operating cost by 12–18% while maintaining methane recovery and product purity specifications.
05
Revenue Stack Dashboard and Margin Forecasting
Real-time visualization of RNG revenue across all value streams — physical gas sales, RIN credits, LCFS values, and voluntary premiums — with forward-looking margin forecasting that incorporates current credit pricing, offtake contract terms, and projected upgrading system performance.
06
Predictive Maintenance for Upgrading Assets
Compressor failures, membrane degradation, and adsorbent breakthrough events cause unplanned downtime that directly reduces RNG revenue. iFactory predicts these events 2–6 weeks in advance, enabling maintenance planners to schedule interventions during planned windows rather than emergency shutdowns that interrupt RIN generation.
Expert Review — What Biogas Plant Owners Miss When Evaluating the CHP vs. RNG Decision
The most common mistake I see in RNG vs. CHP evaluations is treating the revenue comparison as static. Owners build a spreadsheet based on current RIN prices and a fixed upgrading system performance assumption — and that spreadsheet looks great at signing. But RIN prices fluctuate 30–50% year over year. Upgrading system methane recovery degrades 1–3% annually as membranes age or adsorbents foul. Energy costs rise. The project that looked like a 2.5-year payback at commissioning can drift to a 5-year payback within 18 months of operation if those variables are not actively managed. The facilities that succeed with RNG are not the ones that built the best initial business case — they are the ones that deploy continuous performance monitoring and actively manage every variable that affects their revenue per MMBtu.
RNG Project Finance Director
Biogas and Renewable Natural Gas Practice, 12 Years — Specializing in RIN/LCFS Monetization
Conclusion — The RNG Decision Is a Data Decision
The choice between CHP and pipeline RNG is not a question of which technology is better — it is a question of which pathway delivers superior risk-adjusted returns for your facility's specific biogas flow rate, capital position, operational capability, and market access.
iFactory's RNG Economics Platform provides the real-time data infrastructure and AI-driven analytics that transform the upgrade decision from a static spreadsheet exercise into a continuously optimizing revenue management strategy. To see how iFactory can model your facility's specific CHP vs. RNG economics, Book a Demo with our RNG analytics team.
Frequently Asked Questions
D3 RINs (cellulosic biofuel RINs) are currently trading in the $2.50–$3.50 per RIN range, with fluctuations driven by EPA RFS volume obligation announcements, cellulosic waiver credit prices, and overall RIN market supply-demand dynamics. For a typical RNG project, D3 RINs represent approximately 50–60% of total revenue. A $0.50 change in D3 RIN pricing shifts the annual revenue of a 1,000 scfm RNG facility by approximately $200,000–$300,000, making RIN price risk management a critical component of project finance and operational planning.
The minimum economic flow rate for RNG upgrading depends on pipeline proximity, available RIN/LCFS pricing, and financing structure, but 500 scfm of raw biogas is a general threshold at current market conditions. Below 500 scfm, the capital cost of upgrading equipment ($2M–$5M) is difficult to justify against the limited RNG volume, and CHP is typically the more practical option. Above 1,500 scfm, RNG almost always delivers superior returns. Between 500–1,500 scfm, the decision hinges on specific factors including pipeline interconnect distance, CI score, and access to voluntary premium offtake agreements.
The four primary risks that erode RNG profitability are: (1) methane recovery degradation — a 2% drop in recovery on a 1,000 scfm facility reduces annual RNG revenue by $30,000–$80,000; (2) RIN documentation gaps — incomplete EPA QAP records can result in RIN invalidation, losing $2.50–$3.50 per gallon of RIN value on affected production; (3) LCFS CI score drift — increasing energy consumption or fugitive emissions raises your CI score, reducing LCFS credit generation per MMBtu; and (4) unplanned upgrading system downtime — each day of upgrading system downtime at a 1,000 scfm facility represents $3,000–$6,000 in lost RIN and gas revenue.
iFactory automates the entire compliance documentation lifecycle for both RIN and LCFS programs. For RINs, the platform tracks continuous methane production volumes, correlates gas quality data with flow measurements, and generates EPA QAP-compliant production records with third-party auditor-ready documentation packages.
Yes — in fact, many well-designed biogas facilities are built with dual-pathway capability, allowing the operator to route biogas to either the CHP engine or the upgrading system depending on market conditions. This "dispatchable RNG" model provides built-in revenue risk management: when RIN and LCFS pricing is strong, the operator maximizes RNG production; when credit prices drop, biogas can be diverted to CHP with minimal revenue disruption. iFactory's platform supports dual-pathway optimization by continuously comparing real-time RNG revenue per MMBtu against CHP revenue parity and automatically recommending the optimal gas routing. The capital cost premium for dual-pathway design is typically 10–15% and is recovered within the first major RIN price cycle.
Optimize Your CHP vs. RNG Decision with Real-Time Economic Intelligence
iFactory's RNG Economics Platform delivers continuous upgrading performance monitoring, automated RIN and LCFS compliance documentation, real-time revenue stack forecasting, and AI-driven pathway optimization — purpose-built for biogas facility owners evaluating the upgrade decision or maximizing RNG asset returns.