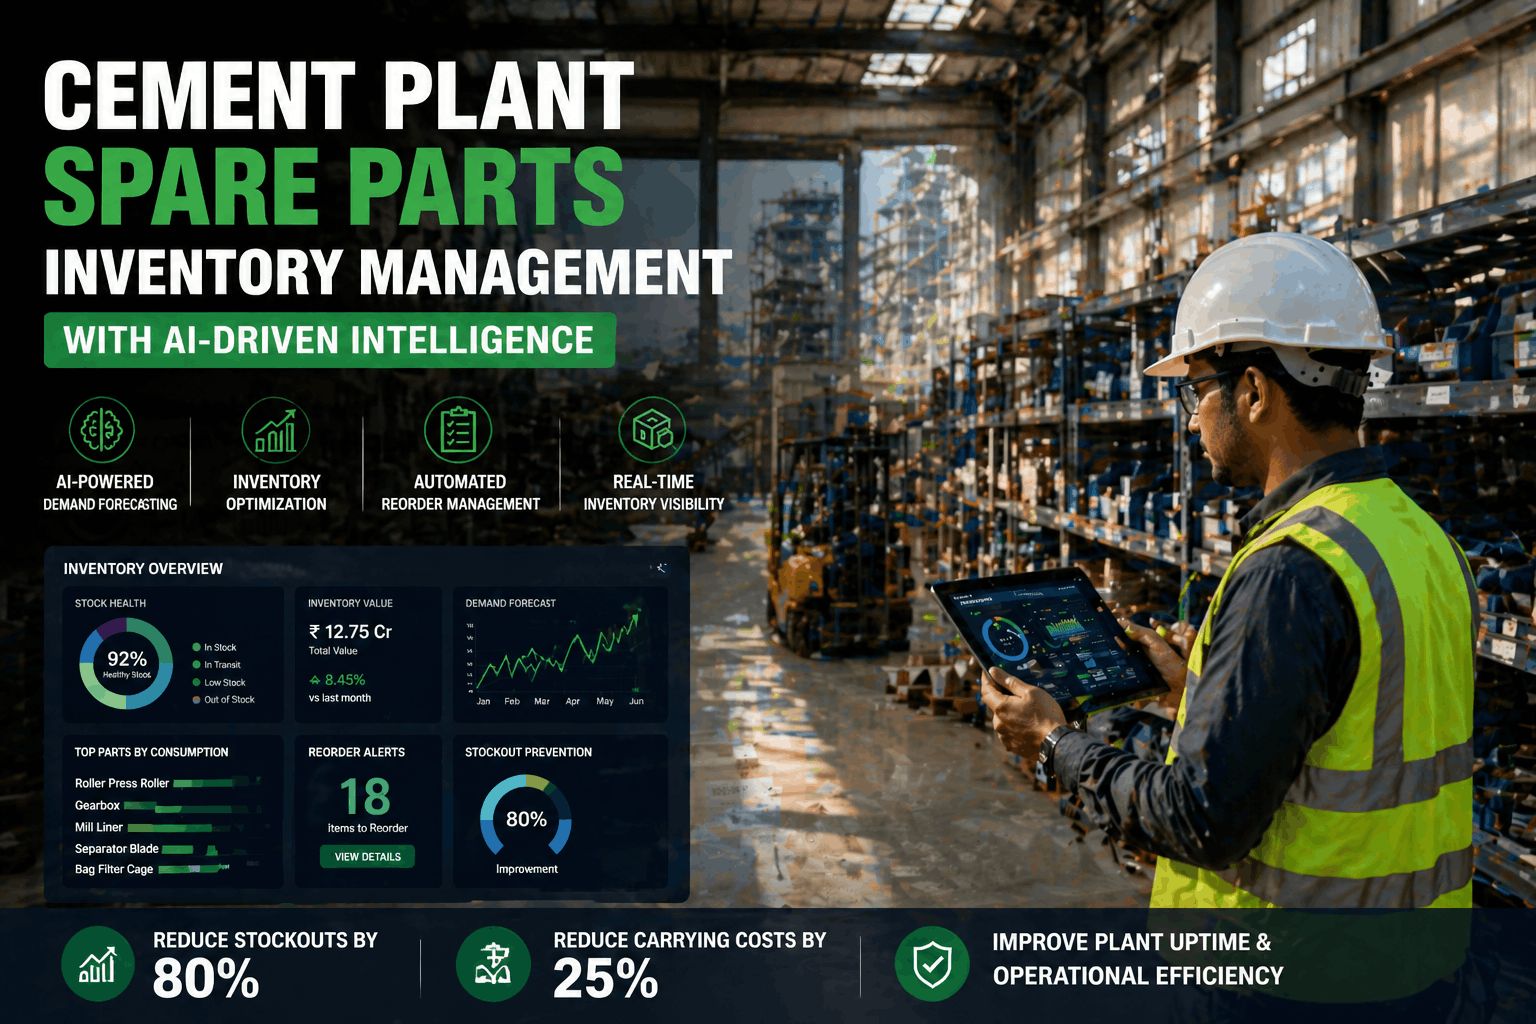
One cement plant discovered $4 million tied up in spare parts for a kiln line it had decommissioned back in 2018 — parts nobody had flagged for years because nothing in the ERP system distinguished dead stock from an active spare. This is the quiet reality of manual cement procurement: the plant isn't short on data, it's short on a system that connects vendor performance, part criticality, and actual consumption into one view planners can act on. iFactory's procurement analytics platform converts that scattered data into a single reliability-based intelligence layer — see how at Book a Demo.
Turn Spare Parts Purchasing From A Price Function Into A Reliability Function
iFactory unifies warehouse transactions, asset health data, vendor lead times, and financial performance into one operational intelligence layer, so procurement decisions are driven by which parts actually protect uptime — not just which supplier quoted the lowest price.
Three Silent Killers Hiding In Every Manual Procurement System
Manual inventory and procurement systems tend to fail in three specific, recurring ways, and all three are invisible until an audit or a crisis forces them into view. iFactory's platform is built specifically to surface each one before it becomes an emergency purchase order or a write-off.
Phantom Inventory
The ERP says a part is in stock, but the bin is empty. A mismatch between transaction records and physical reality that only becomes visible when a technician goes looking for a part mid-repair and finds nothing there.
Dead Stock
Roughly 20 to 30% of a plant's total MRO capital is typically tied up in parts for equipment retired or decommissioned years earlier, sitting on shelves and depreciating with no active use case remaining.
Emergency Freight Premiums
Air freight and OEM rush fees on parts sourced under crisis conditions can inflate the cost of a component by as much as 300% compared to the same part ordered through a normal planned procurement cycle.
Each of these problems compounds the others. Phantom inventory triggers unnecessary emergency orders because planners believe stock exists when it doesn't, emergency orders get filled at rush-freight premiums because there is no lead time left to shop for a better price, and dead stock accumulates because plants over-correct toward excess safety stock rather than trust reorder points that have already failed them once.
iFactory addresses phantom inventory specifically by reconciling ERP transaction records against actual usage patterns rather than relying on periodic physical counts alone. When a part's transaction history shows it was issued to a work order but the bin count never adjusted downward, or when a part shows as available but hasn't had a single scan-out event in years despite being marked as active stock, the reconciliation engine flags the discrepancy before a technician discovers it mid-repair. Mandatory barcode scan-out at the point of consumption closes this gap going forward, converting inventory records from a periodically-audited approximation into a continuously verified count that planners can actually trust when deciding whether to place an order.
Which Suppliers Actually Deliver — And Which Ones Quietly Cost You More
Vendor selection based purely on quoted price misses the far larger cost of a supplier who consistently misses delivery windows or ships parts that fail early. iFactory tracks every vendor's delivery performance and part quality against actual field results, converting supplier evaluation from a subjective relationship call into a data-backed scorecard.
This distinction matters most on the parts where it's easiest to overlook: a bearing that costs 8% less but fails 40% more often than the alternative isn't actually the cheaper option once the associated downtime and replacement labor are counted, yet a purchasing decision made on unit price alone would never surface that comparison. iFactory ties every part's field performance back to the vendor who supplied it, so a pattern of early failures traces automatically to its source instead of being logged as an isolated maintenance event with no connection drawn to the original purchase decision.
| Vendor Metric | What It Reveals | Why It Matters More Than Price |
|---|---|---|
| On-Time Delivery Rate | How reliably lead-time commitments are actually met | A missed delivery on a critical spare can cost more in downtime than the part's entire price |
| Early Failure Rate | Share of parts that fail well before expected service life | A cheaper part that fails twice as often costs more per ton produced |
| Quote-to-PO Cycle Time | How quickly a vendor responds to urgent requests | Slow response on emergency orders forces rush-freight premiums |
When the CFO and the maintenance VP share the same real-time view of vendor performance and stockout risk, sourcing decisions get made from data rather than from habit or relationship history — and long-standing suppliers who have quietly drifted toward slower delivery or higher failure rates get identified before the pattern causes an actual production loss.
This shared visibility also changes the negotiating position a plant holds during contract renewal. A vendor relationship built on a decade of loyalty is worth revisiting when the data shows delivery reliability has slipped over the last two years, and a procurement team armed with a documented performance trend has a far stronger footing in that conversation than one relying on a general sense that "deliveries have felt slower lately." Conversely, a vendor with a strong, data-backed reliability record becomes an easier case to consolidate more spend toward, since the decision is grounded in measured outcomes rather than anecdote from either side of the table.
Find Out Which Suppliers Are Actually Protecting Your Uptime.
iFactory's vendor scorecards turn procurement into a reliability decision, not just a price comparison.
Not Every One Of Your 40,000 Part Numbers Deserves The Same Attention
A large integrated cement plant can carry anywhere from 15,000 to 60,000 active SKUs, and applying the same forecasting rigor to every single one wastes analytical effort on parts that will never meaningfully affect uptime. iFactory applies an automated ABC-XYZ criticality segmentation that concentrates predictive modeling on the small slice of parts that actually carry the plant's downtime risk.
A common mistake in manual inventory programs is treating every SKU with roughly equal planning attention, on the assumption that thoroughness means covering the entire catalog evenly. In practice this spreads limited planner time across tens of thousands of line items where the vast majority carry negligible consequence if a stockout occurs, while the handful of genuinely critical, long-lead-time parts get the same cursory quarterly review as a low-cost gasket that any local supplier can deliver within a day. Segmenting by criticality first is what makes it possible to give Tier 1 parts the depth of attention they actually warrant.
This segmentation typically concentrates on just 5 to 15% of a plant's SKU catalog while still covering 70 to 80% of total downtime risk, which means planners spend their limited attention on the parts where a stockout genuinely threatens production, rather than spreading equal effort across a catalog where most items carry negligible operational consequence.
The Tier 4 category deserves particular attention because it is where most of a plant's dead-capital problem tends to concentrate. Parts with zero movement for eighteen months or longer are automatically flagged for disposition review rather than left to accumulate indefinitely on the assumption that they might eventually be needed again. Some of these parts genuinely warrant retention, such as a long-lead-time component for equipment still in active service that simply hasn't failed recently, but many trace back to equipment that has since been retired, replaced, or upgraded — and without an automated flag drawing attention to zero-movement SKUs, that distinction rarely gets made until an inventory audit forces the question years later.
What Changes When Procurement Becomes Data-Driven
Across cement plants that have moved from manual, price-based purchasing to AI-driven procurement analytics, three financial outcomes consistently show up in the results.
These gains come from three distinct, quantifiable sources rather than one general efficiency improvement: avoided unplanned downtime from having the right part in stock before it's needed, released working capital from identifying and disposing of obsolete inventory, and elimination of premium freight charges that only exist because a stockout forced a crisis purchase in the first place. A 90-day finance-verified ROI report covering all three is a standard deliverable of a full deployment.
Presenting these three sources separately, rather than as one blended savings number, matters for how the program gets approved and sustained internally. Avoided downtime is usually the largest dollar figure but the hardest to attribute cleanly, since it depends on modeling what would have happened without the intervention. Released working capital from dead stock disposition is the most immediately verifiable, since it shows up directly on the balance sheet the moment obsolete parts are written off or returned. Eliminated freight premiums are the easiest to track month over month, since they compare directly against a documented history of emergency purchase orders. Together, the three give finance and operations a shared, auditable basis for the program's return rather than a single number either side has reason to be skeptical of.
Where Does Your Plant Sit On The Procurement Maturity Curve?
Most cement plants are currently operating at Level 1 or Level 2 of procurement maturity, relying on static safety stock levels and manual vendor reviews. Moving to Level 4 requires a strategic shift in data architecture, not simply a new piece of software layered on top of the same fragmented data sources.
The jump between these levels is rarely a single software purchase — it's a change in what data actually informs a reorder decision. A Level 2 plant might have excellent individual systems, a modern CMMS for work orders, a capable ERP for purchasing, and detailed vendor contracts, yet still make reorder decisions using none of that data together, because nothing connects a bearing's vibration trend to its reorder point in the purchasing system. Level 4 doesn't require abandoning any of those existing systems; it requires building the connective layer that lets condition data, consumption history, and vendor performance inform the same purchasing decision simultaneously, which is exactly the layer iFactory is built to provide.
Level 1-2: Reactive And Manual
Static safety stock levels set once and rarely revisited, vendor selection based primarily on quoted price, and reorder decisions driven by whichever planner happens to notice low stock during a manual review.
Level 3-4: Predictive And Unified
Reorder points that account for lead time, part criticality, and real-time asset condition data, vendor performance tracked continuously against delivery and quality outcomes, and automatic purchase requests firing weeks ahead of manual review cycles.
We ran an inventory audit expecting to find some overstock, and instead found four million dollars tied up in parts for a kiln line we'd shut down in 2018 — nobody had flagged it because the ERP had no way to distinguish an active spare from a dead one. iFactory's criticality segmentation cleaned that up within the first quarter, and the reorder automation on our actual critical spares has cut our emergency freight spend dramatically. Procurement finally feels like it's protecting uptime instead of just processing purchase orders.
Frequently Asked Questions
Q: How does the AI know which parts are actually critical versus just expensive?
Criticality is calculated from failure risk aggregated across the entire installed base, not from unit price alone. A bearing used in twelve motors across the plant receives a higher criticality score than an identical bearing installed in only one machine, because the total fleet exposure — and the total downtime risk if that part type fails — is what actually drives stocking policy. This is combined with lead time, downtime cost per hour for the equipment it serves, and historical failure patterns to produce a ranking that reflects real operational risk rather than sticker price. The model also identifies consolidation opportunities where different part numbers from different vendors actually serve interchangeable functions, reducing total SKU count without increasing stockout risk on any of the equipment those parts protect. Reach out through Support Contact to see how this maps to your current parts catalog.
Q: Will this force us to switch ERP or inventory management systems?
No. iFactory's procurement analytics layer connects to your existing ERP, CMMS, and warehouse transaction data rather than replacing any of them, unifying that data into a single view without requiring a system migration. Most implementations begin by reconciling existing transaction records against physical stock counts to identify phantom inventory discrepancies, which typically surfaces immediate, actionable findings before any new process changes are introduced. This reconciliation step alone often justifies the engagement on its own, since it converts a stock count that everyone has quietly stopped fully trusting back into a number planners can rely on when deciding whether an order is genuinely needed. A Book a Demo session can walk through integration with your specific ERP.
Q: How long does it take to identify our dead stock and free up working capital?
Because dead stock identification relies primarily on transaction history that already exists in most ERP systems, an initial catalog rationalization pass can typically flag zero-movement Tier 4 parts within the first few weeks of data integration. The disposition process itself — deciding whether to return, write off, or exchange each flagged part — takes longer and depends on vendor return policies and internal approval cycles, but the identification of what qualifies as dead stock happens early in the engagement.
Q: Does more aggressive inventory reduction increase our risk of a critical stockout?
This is the core tension AI-driven optimization is built to resolve rather than ignore. The models include safety buffers and confidence intervals for every recommendation, and any suggestion to reduce stock on a part flagged as higher risk is surfaced for planner approval rather than executed automatically. In practice, plants see both outcomes improve simultaneously — lower total inventory value and fewer stockouts — because the reduction comes specifically from identified dead stock and over-conservative safety levels on low-risk parts, not from cutting buffers on the critical spares that actually protect uptime. When a stockout does occur despite these safeguards, the model treats it as a signal rather than a one-off failure, immediately adjusting the criticality score and reorder point for that part to reduce the odds of a recurrence, which is part of why stockout rates continue improving over time rather than plateauing after the initial rollout.
Q: Can this account for seasonal or campaign-driven consumption spikes?
Yes. The forecasting models identify parts with cyclical usage tied to production campaigns, seasonal operating patterns, or planned shutdown schedules, and adjust safety stock levels dynamically rather than holding a flat, year-round buffer that overstocks during low-demand periods and understocks right before a predictable spike. Refractory consumption tied to a summer campaign schedule, for example, gets buffered ahead of the season and drawn back down once the campaign ends. This same logic extends to planned kiln and mill outages: when a shutdown is scheduled in the maintenance calendar, the platform can pre-stage and kit the specific parts that outage will consume, so the shutdown crew arrives to a prepared parts package rather than discovering a gap mid-turnaround when there is no time left to source a missing component. Contact Support Contact for details on how this applies to your specific maintenance calendar.
Stop Choosing Between Excess Capital And Emergency Stockouts.
iFactory's procurement analytics gives you both lower inventory value and fewer stockouts, driven by real criticality data instead of static safety stock rules.