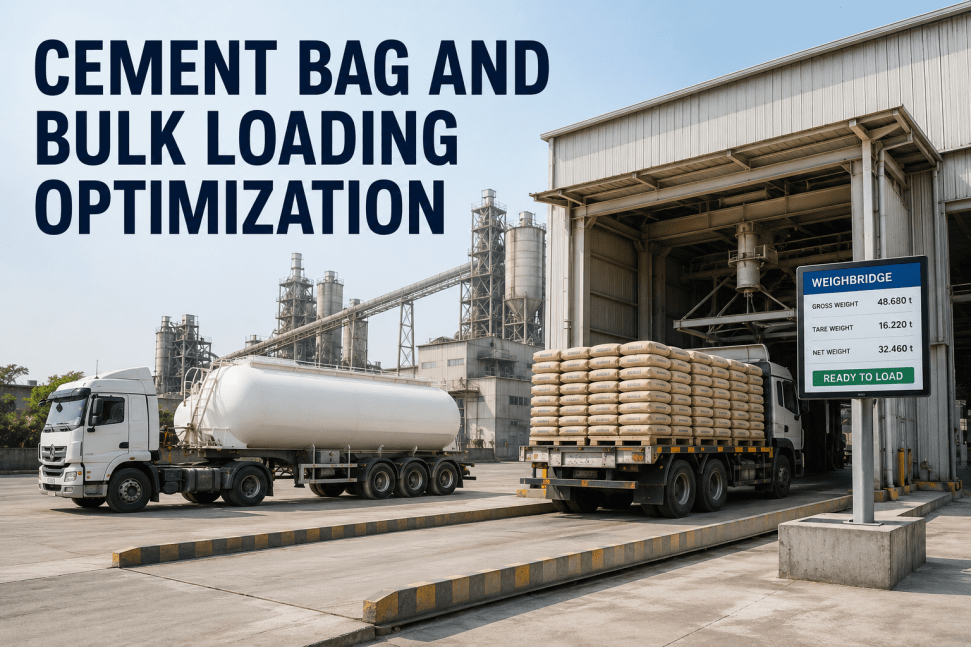
Cement dispatch operations — bag loading, bulk truck loading, and rail dispatch — represent the last 4 to 6 hours of a production cycle that took 72 to 96 hours to complete. A 2,000 TPD cement plant that runs dispatch inefficiently loses between $180,000 and $420,000 annually in avoidable costs: detention charges on trucks waiting beyond free-time windows, product giveaway from uncalibrated weighbridges, rehandling labor from loading errors, and throughput constraints that cap effective plant capacity below nameplate. The challenge is structural: most cement plants manage loading operations with manual weighbridge tickets, verbal loading bay assignments, and paper dispatch logs that provide no real-time visibility into queue position, loading time, or weighbridge accuracy. Variability in individual truck loading time runs 40 to 80% above the mechanical minimum at plants without digital dispatch scheduling — time that accumulates into driver detention charges and delayed deliveries that erode customer relationships. iFactory's loading optimization platform integrates digital weighbridge data, automated loading bay assignment, real-time queue management, and AI-driven dispatch scheduling into a unified operations layer — reducing average truck turnaround time by 34%, eliminating weighbridge giveaway to within 0.15% of target weight, and cutting detention charge exposure by 61% at comparable U.S. cement plants. This guide explains exactly how each component of the loading operation creates or destroys value, and what the intervention is that recovers it.
Where Cement Loading Operations Lose Money — and Why Most Plants Don't Measure It
Loading losses in cement plants are distributed across five distinct cost categories, each with a different root cause and a different measurement requirement. Plants that track only total dispatch tonnage per shift see none of them — the losses are embedded in detention invoices, product reconciliation shortfalls, rehandling labor charges, and customer complaints that accounting processes weeks after the loading event. Real-time loading analytics makes every cost category visible at the point where it can be prevented rather than reconciled.
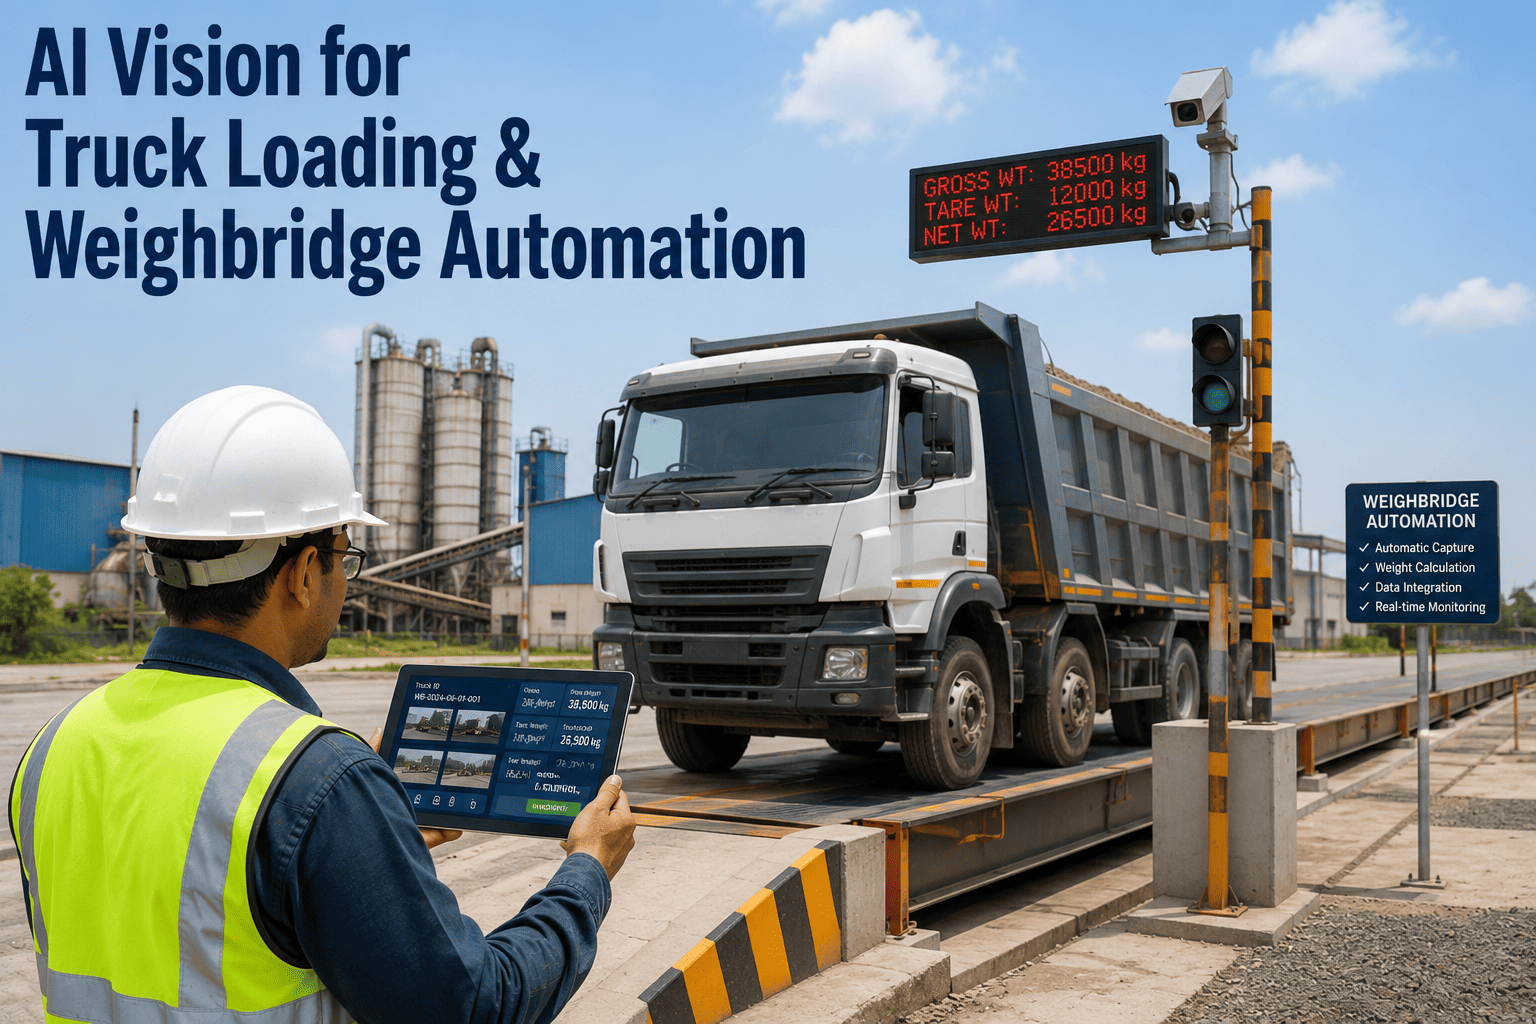
Digital Weighbridge Integration: The Foundation of Loading Accuracy
The weighbridge is the single most financially consequential piece of equipment in the dispatch operation — every ton of cement that leaves the plant passes across it, and every calibration error, manual entry, or data gap compounds across every transaction in the billing cycle. Most cement plants operate weighbridges as standalone instruments: the weight is printed on a ticket, the ticket is handed to the driver, and the data enters the ERP system hours later via manual entry or batch upload. iFactory's weighbridge integration eliminates every manual step in that chain and adds the real-time monitoring layer that detects calibration drift before it becomes a giveaway or short-loading problem.
Dispatch Scheduling and Queue Management: Cutting Turnaround Time by 34%
Truck turnaround time — gate-in to gate-out — is the metric that determines detention charge exposure, effective dispatch capacity, and driver relationship quality. At plants without digital queue management, turnaround time variability is the dominant cost driver: the average truck may exit in 95 minutes, but the 90th percentile truck exits in 160 minutes — and it is that 90th percentile truck that generates the detention invoice, the driver complaint, and the carrier rate renegotiation. iFactory's dispatch scheduling module eliminates the sources of turnaround variability by replacing manual coordination with a real-time sequencing engine. Book a Demo to see the dispatch scheduling module configured for your plant's loading infrastructure.
Gate-In Automation — Eliminating the First 12 Minutes of Avoidable Dwell Time
Manual gate processing — driver presents delivery order, gate staff checks registration, assigns queue number, issues entry pass — consumes 8 to 18 minutes of truck time before the vehicle reaches the loading queue. iFactory's gate automation module pre-registers trucks against confirmed delivery orders: the driver receives a QR code or SMS token on dispatch notification, gate entry is validated by code scan in under 45 seconds, and the vehicle is automatically assigned a queue position and loading bay direction without staff intervention. Pre-registered vehicles that arrive outside their scheduled window are flagged to the dispatch supervisor for resequencing rather than blocking the gate lane.
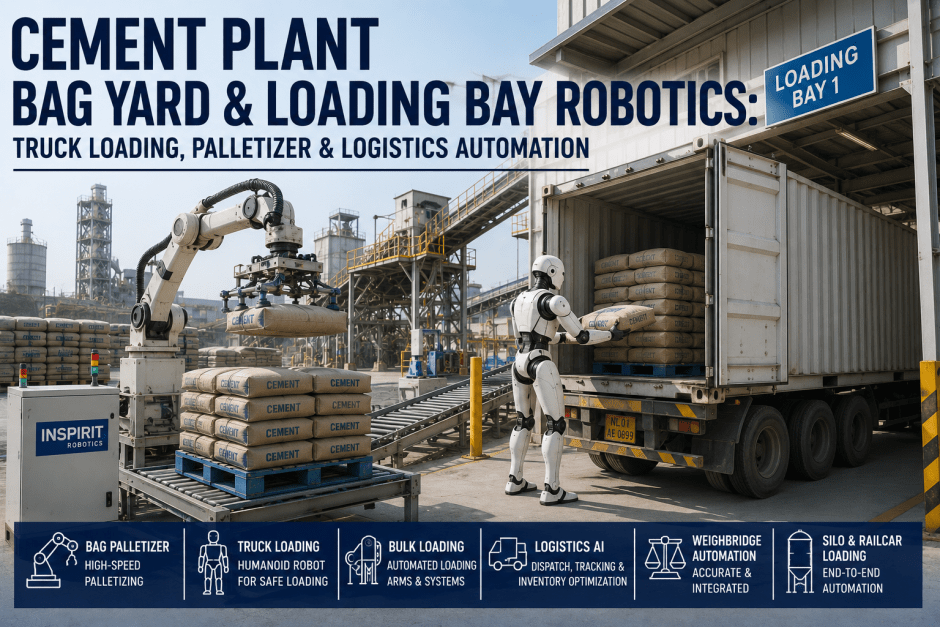
Intelligent Bay Assignment — Eliminating Utilization Variance Across Loading Infrastructure
Manual bay assignment produces systematic imbalances: supervisors tend to default to familiar bay sequences, drivers self-select familiar lanes, and bays with equipment quirks get avoided — producing 35 to 55% utilization variance between the busiest and slowest bays. iFactory's bay assignment engine assigns each vehicle to the optimal bay based on real-time bay status (loading, idle, maintenance), vehicle type compatibility (axle configuration, hatch position), order size versus bay throughput rate, and estimated loading completion time for queued vehicles. The result is utilization variance reduced to under 12%, effective loading capacity increased by 15 to 22%, and queue waiting time reduced without capital investment in additional bays.
Bulk Loading Control — Precision Weight Delivery and Load Rate Optimization
Bulk cement loading via pneumatic or gravity spouts involves two competing inefficiencies: loading too fast produces dust emissions and product loss; loading too slow extends bay occupation time and reduces throughput. iFactory's bulk loading control interface connects directly to the loading spout control system — monitoring load rate against the theoretical optimum for that vehicle type and product grade, adjusting flow control valve position to maintain target rate, and executing the two-speed approach sequence (full rate to 85% of target weight, reduced rate to final target) that minimizes both overshoot risk and loading time. Actual load rate data feeds back into the bay scheduling engine to update completion time estimates in real time.
Bag Loading Verification — Count Accuracy and Weight Compliance at Line Speed
Bag loading operations present a different accuracy challenge than bulk: the error is not in total weight but in count and individual bag integrity. A truck loaded with 498 bags instead of 500 produces a customer shortfall claim worth 2 bags at retail — typically $8 to $14 — but generating a redelivery and administrative cost of $180 to $320. iFactory's bag loading verification module integrates with the bag counter on the loading conveyor — confirming count per truck load in real time, flagging any sequence interruption that suggests a missed bag, and cross-checking total loaded weight against the expected weight for the confirmed count as a secondary accuracy gate. Torn or underweight bags identified by the in-line weight checker before loading are rejected and replaced without stopping the loading cycle.
Loading Operation Performance Benchmarks: What Optimization Delivers
The financial case for cement loading optimization is grounded in measured outcomes at comparable dispatch volumes — not projected estimates. The benchmark data below presents documented performance improvements organized by intervention type at plants that have deployed iFactory's loading optimization platform.
| Optimization Area | Baseline (Manual / Unmanaged) | Post-iFactory Deployment | Annual Value Recovered | Payback Period |
|---|---|---|---|---|
| Truck Turnaround Time | 118–145 min average, 40–80% variance | 76–88 min average, under 18% variance | $132,000–$248,000 detention reduction | 4–8 months |
| Weighbridge Giveaway | 0.4–0.8% of dispatched tonnage | Under 0.15% of dispatched tonnage | $190,000–$255,000 margin recovery | 3–6 months |
| Bay Utilization Balance | 35–55% variance between bays | Under 12% variance across all bays | 15–22% effective capacity increase | 6–10 months |
| Bag Loading Error Rate | 0.8–1.4% of truck loads contain errors | Under 0.1% of truck loads | $48,000–$112,000 redelivery cost elimination | 2–5 months |
| Gate Processing Time | 8–18 min manual gate processing | Under 45 seconds per vehicle | Included in turnaround time reduction above | Immediate |
Loading Optimization Comparison: iFactory vs. Manual Operations vs. Basic Weighbridge Software
U.S. cement plants manage loading operations on one of three technology levels. Each produces measurably different outcomes across the five financial metrics that matter most to dispatch managers and plant controllers. The comparison below maps what each approach actually delivers.
Expert Review: What Cement Plant Dispatch Managers Say About Loading Optimization
I managed dispatch operations at two cement plants over 14 years — combined daily dispatch of approximately 180 bulk trucks and 22,000 bags. The financial impact of loading inefficiency was something I understood intuitively for years before I could actually measure it. We knew our detention charges were high. We knew our weighbridge was running a little heavy — we could see it in the quarterly reconciliation when invoiced tonnage came in 0.3 to 0.4% above shipped tonnage. What we didn't know was the exact dollar value of each problem, which bay was the constraint, or which shift was running the most avoidable dwell time. iFactory gave us that visibility. The first month of data showed that 68% of our detention charge exposure came from a single source: trucks that arrived on time but waited more than 40 minutes in queue before reaching a loading bay. The bays themselves were fine — we had capacity. The problem was that manual bay assignment was creating a traffic jam at two preferred lanes while two others sat idle. The algorithm fixed that in the first week. Detention charges dropped 58% in the first quarter. The weighbridge giveaway finding was the bigger financial surprise. We were running 0.52% average overshoot — I knew it was positive but I had estimated it at maybe 0.2%. At our dispatch volume, 0.52% overshoot represented $218,000 per year in margin we were giving away. The calibration monitoring flagged a load cell drift that had been accumulating for 4 months. After recalibration and implementation of the two-speed loading sequence, we ran at 0.11% for the rest of the year. Combined with the detention reduction, the platform paid for two years of licensing in the first 11 months of operation.
— Dispatch and Logistics Manager, U.S. Cement Plant — 14 Years — Two Plant Operations — Combined 180 Bulk Trucks / DayConclusion
Cement bag and bulk loading operations are not a secondary logistics function — they are the final revenue-determining process in the plant cycle. Weighbridge giveaway, truck detention charges, bay utilization gaps, and bag loading errors each represent a discrete, measurable, and recoverable cost category that fixed-schedule maintenance and manual dispatch coordination cannot identify or address at the transaction level where they originate.
iFactory's loading optimization platform gives cement plant dispatch and operations managers the per-truck, per-bay, per-shift visibility they need to identify every loading loss event, quantify its dollar impact, and implement the right automation or scheduling change before the loss compounds across another week of dispatch volume. The $520,000 average annual cost reduction per plant is the aggregate of weighbridge margin recovery, detention charge elimination, effective capacity increase from bay optimization, and redelivery cost elimination from bag loading accuracy — recoveries that begin in the first shift after deployment and compound across every subsequent shift. Book a Demo to see iFactory's loading optimization platform configured for your plant's specific dispatch infrastructure, volumes, and cost profile.
Frequently Asked Questions
iFactory connects to existing weighbridge controllers via serial, RS-485, or OPC-UA interface — no weighbridge hardware replacement required. Most major controller brands used in U.S. cement plants are supported with pre-built drivers.
Unscheduled trucks are registered at gate-in with a manual order entry that takes under 90 seconds. The scheduling engine inserts them into the queue at the position that minimizes disruption to pre-scheduled vehicles while respecting their own order priority.
Yes. iFactory timestamps every vehicle movement from gate-in to gate-out and records the cause code for each dwell segment. When carrier invoices include detention charges, the platform generates a timestamped dwell report per vehicle that supports dispute resolution with documented plant-side versus carrier-side delay attribution.
Full deployment across weighbridge integration, gate automation, bay scheduling, and bag loading verification typically completes in 3 to 5 weeks. Turnaround time improvements are visible in the first week of live operation; weighbridge giveaway reduction is confirmed within the first billing cycle.
Yes. iFactory manages bag and bulk dispatch operations from a single platform — shared queue management, separate loading verification logic per product type, and a unified dispatch dashboard that shows all active loading events across both operations simultaneously. Book a Demo for a configuration walkthrough.