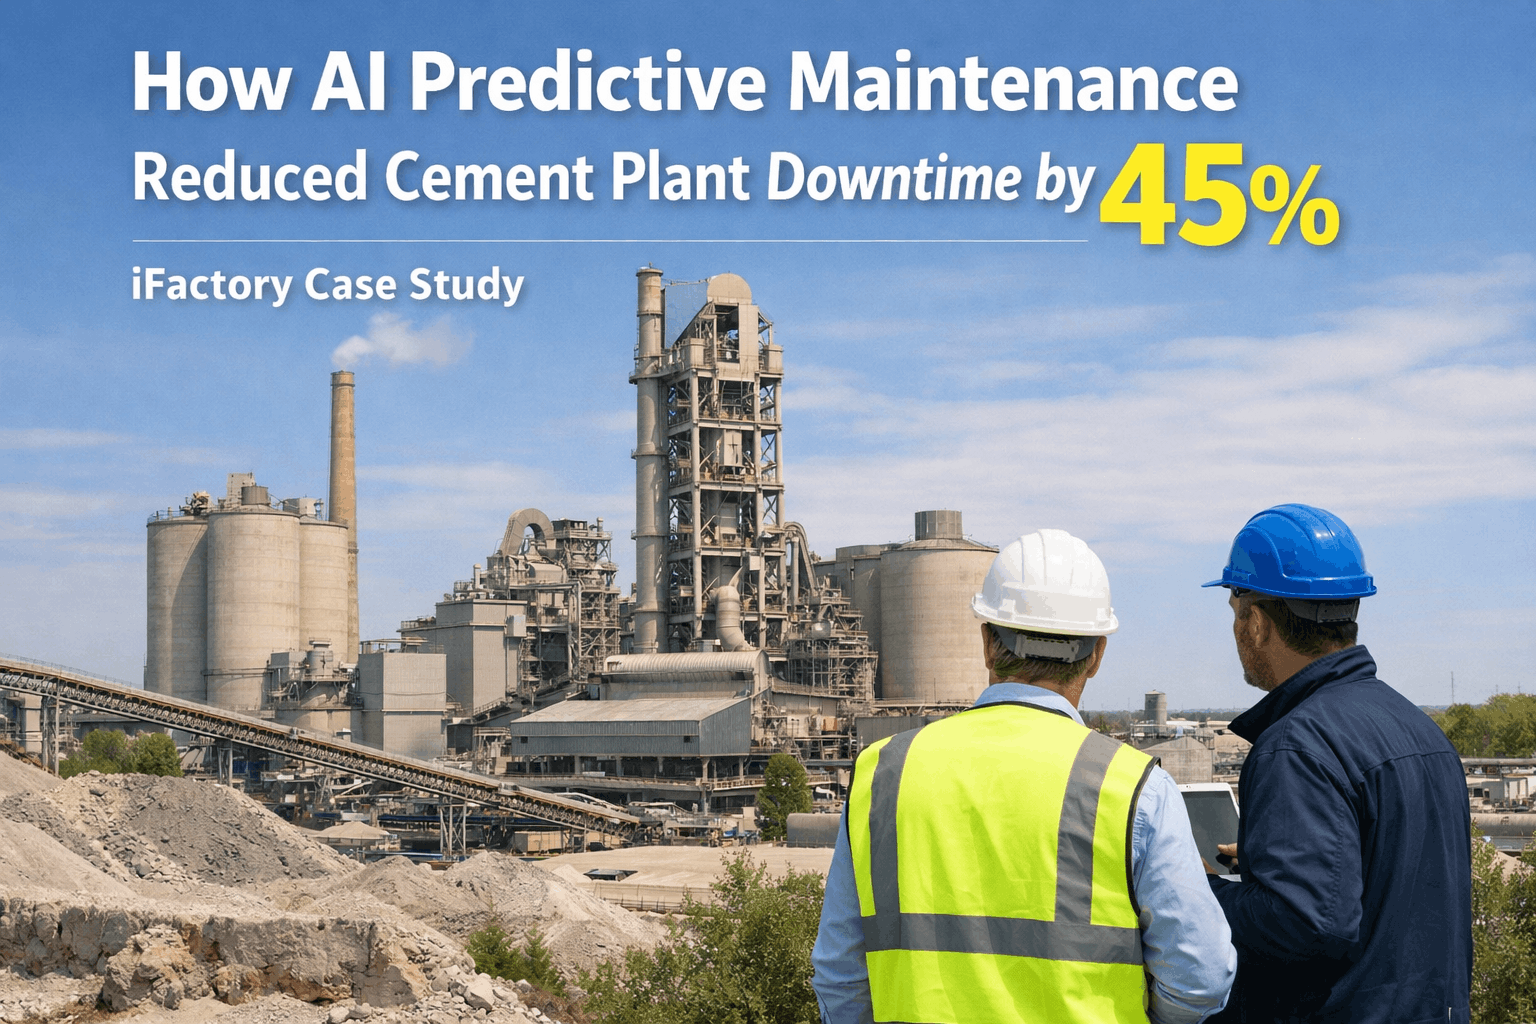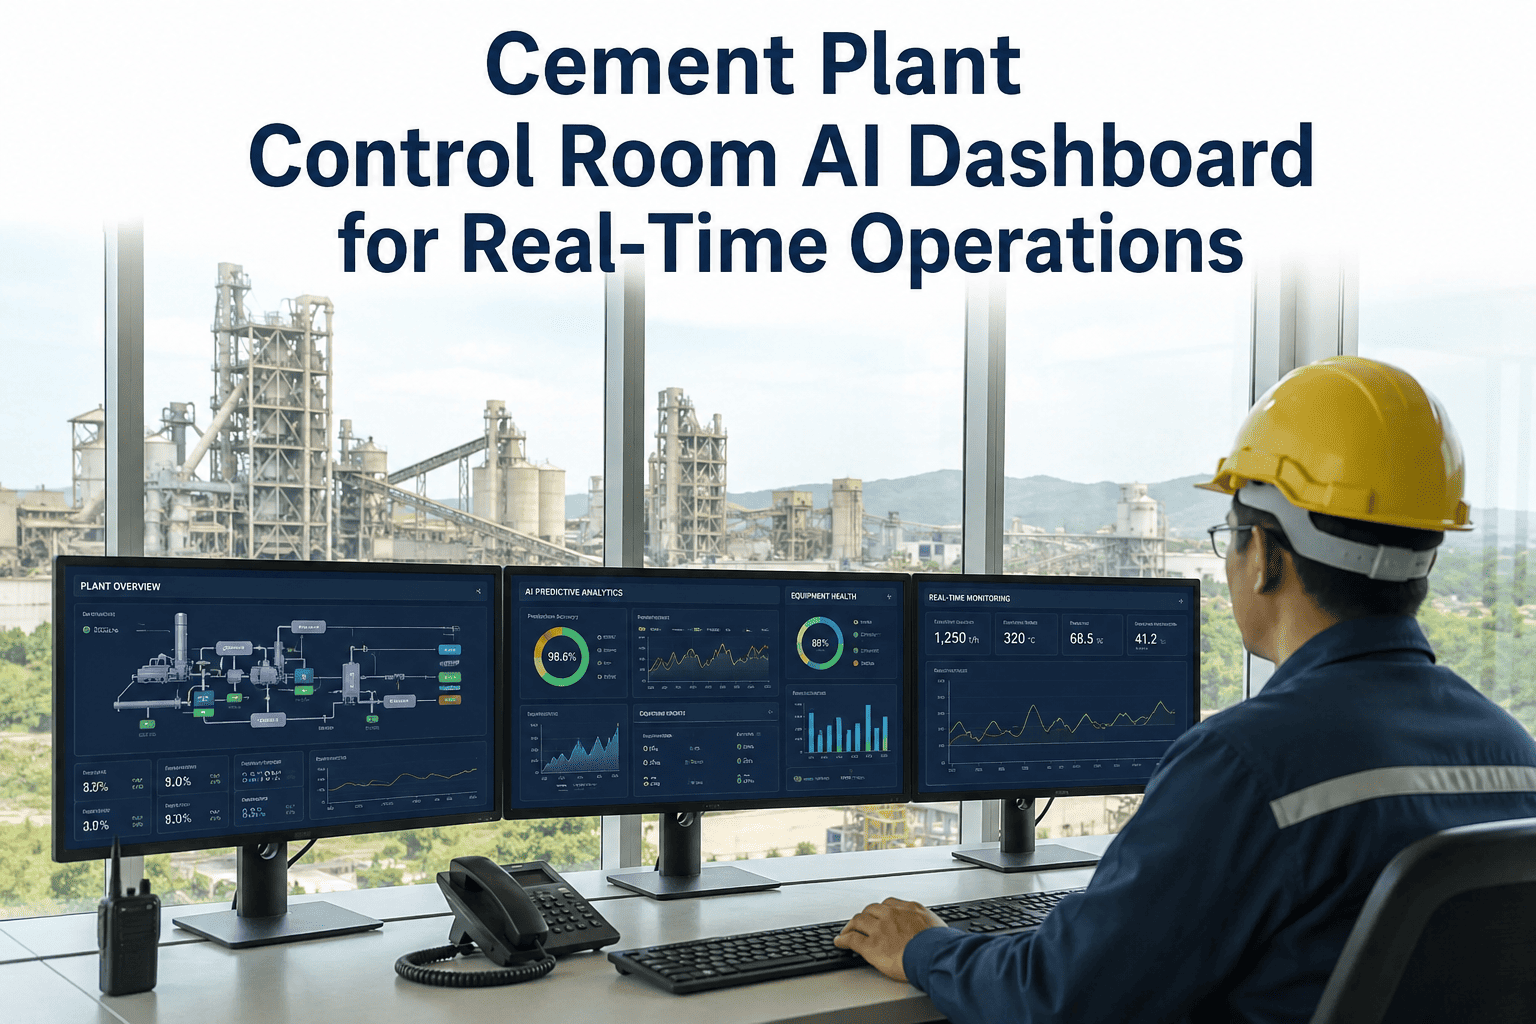
Most cement plant control rooms still run on a patchwork of separate screens — one for the kiln, one for the raw mill, one for the baghouse, one for the SCADA historian — forcing operators to mentally stitch together plant health from five different monitors during a single shift. When a tuyere temperature spike happens at the same moment a mill vibration alarm fires, the operator watching the kiln screen has no way of knowing the mill screen needs attention too, and the ten-minute delay in noticing the correlation is often the difference between a scheduled adjustment and an unplanned stop. iFactory's AI-powered control room dashboard consolidates every production line, maintenance KPI, energy metric, and plant alert into a single real-time view built specifically for cement operations. Book a Demo to see the dashboard configured around your plant's actual process flow.
One Control Room Dashboard for Every Line, Every KPI, and Every Alert Across Your Cement Plant
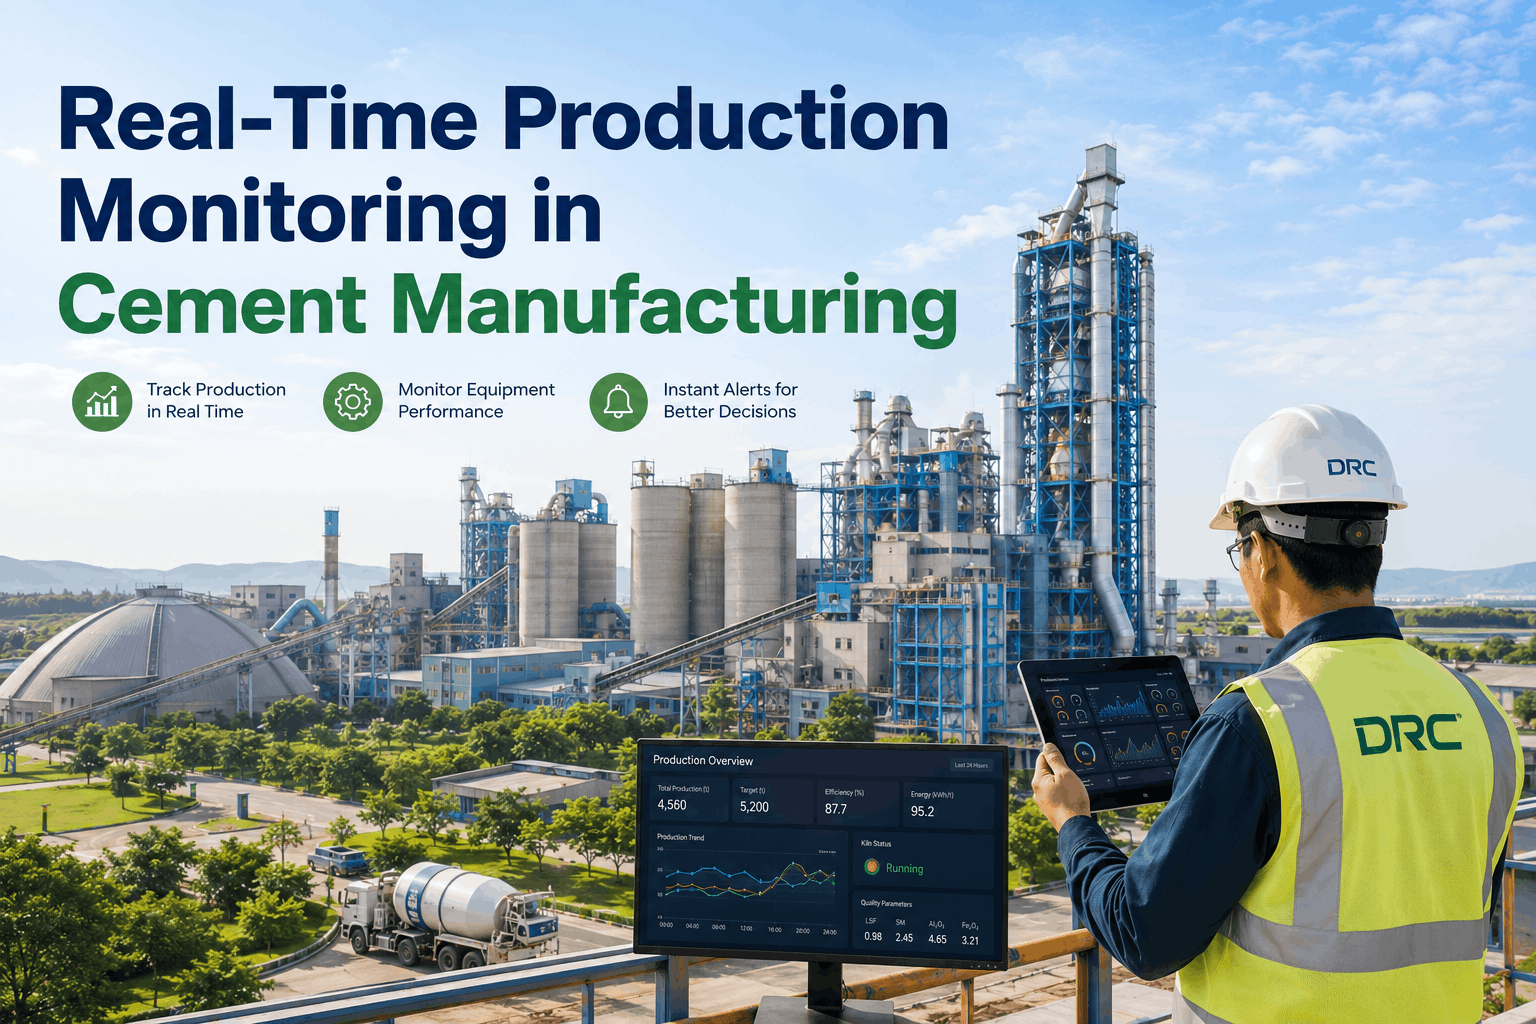
iFactory's AI dashboard pulls raw mill, kiln, cooler, cement mill, baghouse, and energy data into one live screen — so your control room team sees plant health the way it actually behaves, not the way it happens to be split across separate SCADA panels.
Why Fragmented Screens Cost Cement Plants Production Hours Every Week
A typical integrated cement plant runs 15 to 25 separate monitoring interfaces across raw grinding, pyroprocessing, cooling, finish grinding, and utilities — each built by a different automation vendor at a different point in the plant's history. Control room operators develop workarounds, memorizing which screen shows which alarm and manually cross-checking values during shift changes, but the mental overhead scales badly the moment two systems misbehave at once.
Correlated Failures Go Unnoticed for 20 to 40 Minutes
Kiln draft changes, mill load swings, and cooler stack temperature are physically connected, but on separate screens an operator has no visual cue that three small anomalies are actually one developing problem.
Shift Handovers Lose Context Between Screens
An incoming operator inherits five open browser tabs and a verbal summary, with no consolidated record of what was trending abnormal across the plant during the outgoing shift.
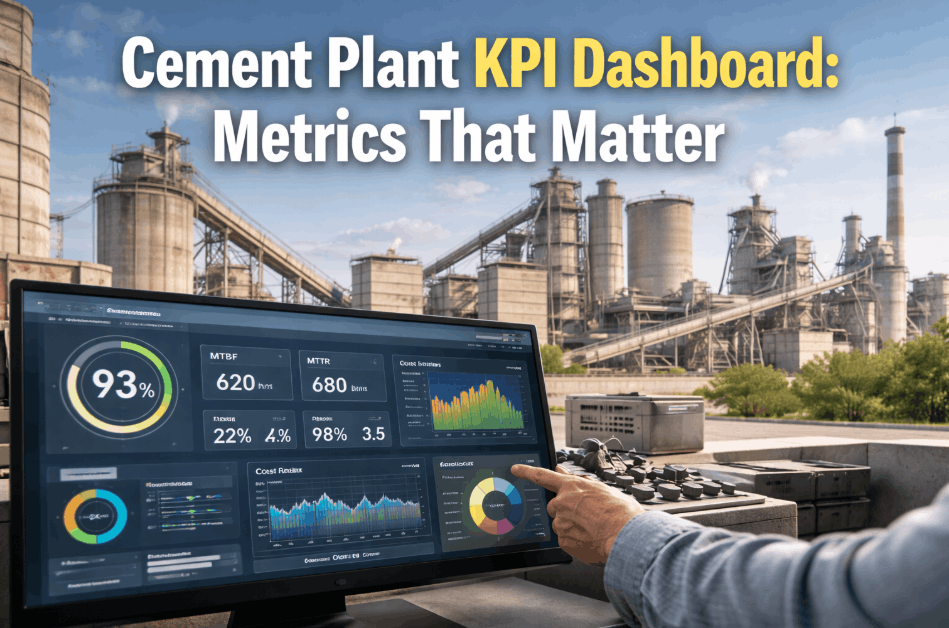
Energy and Maintenance KPIs Live Outside the Control Room
Specific power consumption, kiln specific heat, and equipment health scores typically sit in monthly spreadsheets rather than the screen operators are watching minute to minute.
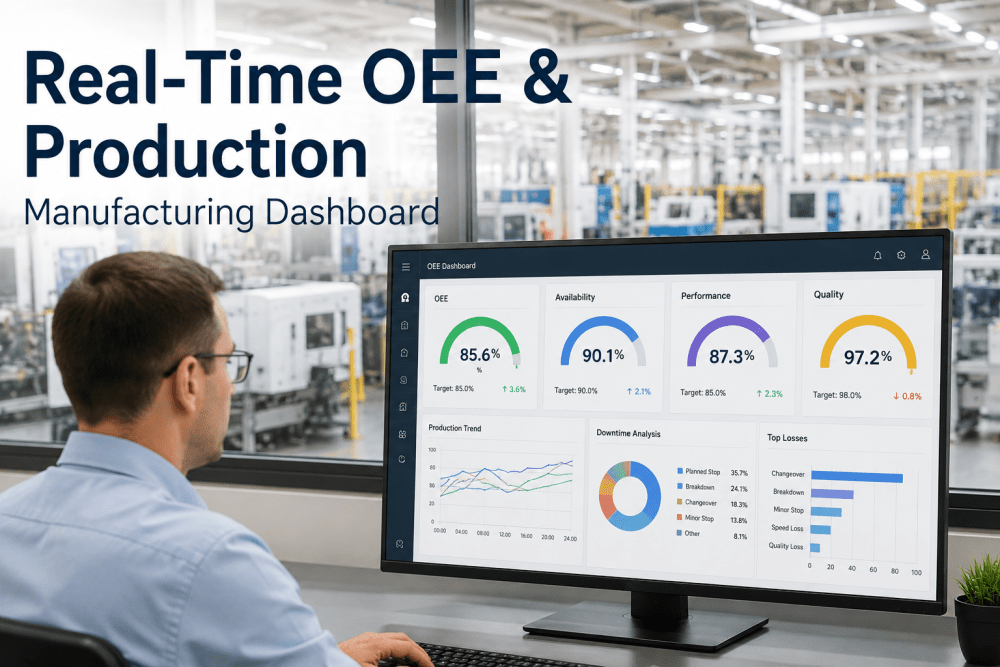
What Your Control Room Actually Sees on the iFactory AI Dashboard
The dashboard is organized into live tiles that mirror the physical plant flow — raw materials through grinding, pyroprocessing, cooling, and finish milling — with AI-generated status coloring that flags developing anomalies before they reach alarm thresholds set in the base SCADA system.
See Your Own Plant's Data Inside the Dashboard, Not a Generic Demo
iFactory configures the dashboard against your actual tag list, historian structure, and alarm philosophy before the first demo, so what you see is your kiln, your mill, and your baghouse.
From Plant Historian to Control Room Screen in Five Steps
Connect Existing Systems
iFactory reads directly from your DCS, PLC, and historian tags without replacing existing automation infrastructure.
Map the Process Flow
Tags are organized into the dashboard by physical plant sequence, not by which automation vendor supplied them.
Apply AI Health Scoring
Machine learning models trained on cement process behavior generate rolling health scores for each major asset.
Surface Correlated Alerts
The dashboard groups related anomalies across departments so operators see one developing event, not five isolated alarms.
Deliver Shift-Ready Summaries
An automated shift summary is generated at handover, capturing every trend an incoming operator needs to know.
Departments and Metrics the Dashboard Brings Into One Screen
| Department | Metrics Monitored | Alert Type |
|---|---|---|
| Raw Grinding | Mill load, vibration, differential pressure, fineness | Bearing wear, feed instability |
| Pyroprocessing | Kiln shell temperature, torque, draft, burning zone | Coating loss, refractory wear |
| Clinker Cooling | Grate speed, clinker temperature, secondary air | Red river, cooler stack overheating |
| Finish Grinding | Cement mill load, separator efficiency, Blaine | Ball charge depletion, liner wear |
| Environment | Baghouse pressure, stack emissions, CEMS data | Filter bag degradation, compliance drift |
| Energy | Specific power, specific heat, peak demand | Efficiency deviation, demand spikes |
The Data Sources the Dashboard Pulls Into a Single View
The dashboard is only as useful as the systems feeding it, which is why iFactory builds direct connectors into the plant systems that already hold your production, quality, and maintenance data rather than asking your team to duplicate entry anywhere. Every connection is read-only against the source system, so existing control logic, historian retention policies, and vendor support agreements are unaffected.
DCS and PLC Tags
Live process values are read directly from your existing control system without any changes to control logic.
Plant Historian
Trend history feeds the AI health scoring models so anomaly detection reflects your plant's own long-term behavior.
Lab Information System
Fineness, chemistry, and strength results are pulled in automatically to correlate quality events with process trends.
CMMS
Open work orders and asset history appear alongside live health scores so context is never a separate lookup away.
How the Dashboard Decides What Deserves an Operator's Attention First
Not every deviation is worth interrupting an operator's attention, so the dashboard ranks active alerts by a combination of asset criticality, rate of change, and how many correlated signals are moving together. A single sensor drifting slowly ranks well below three related signals moving in the same direction at the same time, which is usually the earlier and more reliable indicator of a genuine developing issue rather than routine process noise.
What a Shift Supervisor Said After Six Months on the Dashboard
Before this dashboard, our operators were trained to watch five screens and remember which one mattered most at any given moment. Now the correlated alerts do that memory work for us, and our shift handover meeting is ten minutes instead of thirty. The health scores on the raw mill bearings alone caught two developing issues that our vibration technician confirmed the next morning during a scheduled walk-down. Contact Support was responsive throughout our first two months of tuning the alert thresholds to match our own operating philosophy.
Common Questions About the Cement Control Room AI Dashboard
No. The dashboard sits on top of your existing DCS and SCADA infrastructure and reads from the tags and historian data you already collect, rather than replacing the underlying control system. This means your existing automation investment, alarm philosophy, and control logic remain untouched while the dashboard adds a consolidated, AI-scored view for operators and engineers. Most plants have the dashboard connected and displaying live data within a few weeks of the initial tag mapping session.
The AI models are trained on historical process data from your own plant, learning the normal operating envelope for each major asset across load, temperature, vibration, and draft conditions. When live readings drift outside that learned envelope in a pattern consistent with known failure modes, the health score for that asset declines and the dashboard highlights it before a hard alarm threshold is crossed. Over time the models are retrained on your plant's own confirmed events, so the scoring becomes more accurate to your specific equipment and operating conditions.
Yes. Every dashboard deployment starts with a mapping session where iFactory engineers review your process flow diagrams and existing tag list, then organize the dashboard tiles to match your plant's actual sequence rather than a generic template. Departments, metric groupings, and alert thresholds are all configured to your operating philosophy rather than a one-size-fits-all layout. Book a Demo to walk through the mapping process for your own plant.
Operators typically need a single two-hour orientation session since the dashboard is designed to mirror the physical plant layout they already understand, rather than introducing an unfamiliar interface. The training covers how health scores are calculated, how to drill into a correlated alert group, and how to generate the automated shift handover summary. Additional refresher sessions are available for new hires or when new departments are added to the dashboard scope.
Yes, every dashboard deployment includes ongoing support for threshold tuning, new tag integration, and general troubleshooting as your plant's operating conditions evolve over time. Most plants request adjustments during the first two to three months as the alert sensitivity is tuned to reduce false positives while still catching genuine developing issues. You can reach the support team directly through Contact Support for any dashboard configuration request.
Give Your Control Room One Screen Instead of Fifteen
iFactory's AI dashboard consolidates every line, every KPI, and every alert into a single real-time view built around your plant's actual process flow — configured with your data, not a generic demo.