The environmental manager at a 2.8-million-ton cement plant in the Great Lakes region reviews the quarterly waste hauling invoices and finds a number that stops her: $347,000 spent on landfill disposal for kiln dust, refractory brick, conveyor belt scrap, and baghouse filter bags — 4,200 tons of material that the plant paid to buy, paid to process, and is now paying to bury. Across the plant, 14% of the clinker raw mix could have been replaced with recycled byproducts from local steel mills and coal-fired power plants — reducing both the waste disposal cost and the virgin material procurement cost simultaneously. The plant's waste management program, like most in the U.S. cement industry, is organized around disposal compliance rather than resource recovery: waste is tracked by the dumpster load, not by the material type; co-processing opportunities are evaluated on an ad-hoc basis when a supplier calls; and the circular economy potential embedded in the plant's waste stream is invisible to the management team because no one has connected the data that would reveal it. iFactory's Waste Management and Compliance Tracking modules give cement plant environmental and production managers the digital infrastructure to characterize every waste stream by type, quantity, and disposal cost; identify co-processing and byproduct utilization opportunities based on real-time material composition data; track waste diversion rates against corporate sustainability targets and maintain the documentation required for EPA hazardous waste determinations, beneficial use determinations, and RCRA compliance reporting. Book a Demo to see iFactory's waste management platform configured for your plant's material streams and circular economy goals.
From Disposal Cost to Resource Revenue — Circular Economy Waste Management for Cement Plants
Stop paying to bury materials that have value. iFactory's digital waste management platform tracks every stream, identifies co-processing opportunities, and measures diversion performance — turning waste into a managed resource with measurable ROI.
What Cement Plants Throw Away — Waste Types, Volumes, and Disposal Costs by Process Area
The first step in circular economy waste management is knowing what you are generating, where it is coming from, and what it costs to dispose of it. The table below presents the typical waste generation profile for a 1.5 to 2.5 million ton per year cement plant operating with a dry-process preheater-precalciner kiln line. Waste types are organized by process area with estimated annual generation volumes, typical disposal methods, and per-ton costs at current U.S. industrial waste rates.
Kiln dust and bypass dust
CKD and bypass dust from the preheater and kiln inlet — 12,000 to 28,000 tons per year depending on raw material alkali content and bypass bleed rate. Disposal: landfill or on-site ponding at $35-$65 per ton. Circular economy potential: high-alkali CKD can be used as soil stabilizer or wastewater pH adjuster; low-alkali CKD can replace up to 8% of raw feed.
Refractory brick and castable waste
Spent refractory from kiln lining replacement cycles — 400 to 1,200 tons per year. Disposal: landfill at $50-$80 per ton. Circular economy potential: high-alumina brick can be crushed and used as raw feed for cement or as aggregate in refractory castables; magnesia-spinel brick can be recycled into new refractory formulations.
Baghouse filter bags and cage assemblies
Spent fabric filter bags and support cages from pulse-jet baghouses — 40 to 120 tons per year per baghouse. Disposal: landfill at $45-$70 per ton; some synthetic felt materials classified as non-hazardous. Circular economy potential: fiber-reinforced plastic applications for clean bags; steel cages are 100% recyclable as scrap metal.
Conveyor belt scrap and rubber waste
Worn conveyor belting, pulley lagging, and conveyor component scrap — 80 to 200 tons per year. Disposal: landfill at $40-$60 per ton. Circular economy potential: rubber belting can be granulated for tire-derived fuel blending or molded into industrial matting; steel-cored belting yields recoverable scrap wire.
Used oil, lubricants, and oil-absorbent materials
Spent lubricating oil, hydraulic fluid, gear oil, and oil-soaked absorbents — 6,000 to 18,000 gallons per year of used oil plus absorbent waste. Disposal: used oil can be burned as fuel in the kiln main burner; absorbents require landfill at $55-$90 per ton if classified as hazardous waste. Circular economy potential: used oil is a direct replacement for coal at a typical heat value of 140,000 BTU per gallon.
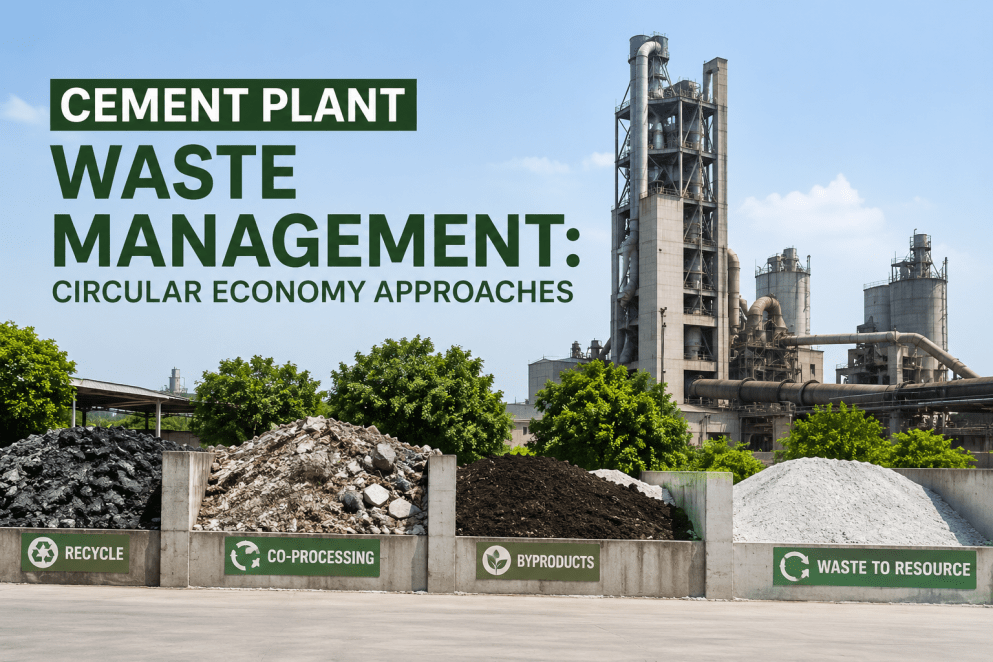
The Five Levels of Circular Waste Management for Cement Plants
The circular economy framework applied to cement plant waste management follows a five-level hierarchy that prioritizes prevention and reuse over recycling, recovery, and disposal. Each level represents a step up from the current disposal-centric approach toward a system where waste is designed out of the process or redirected into productive use. iFactory's waste management platform tracks performance across all five levels and measures the plant's circularity index — the percentage of total waste mass diverted from landfill through prevention, reuse, recycling, or recovery.
Prevention and Reduction
Eliminate waste at the source through process optimization — reduced bypass dust bleed rate, extended refractory life through controlled kiln shell temperature management, and reduced baghouse pulse frequency to extend filter bag service life. Target: 10-18% reduction in total waste mass generated per ton of clinker.
Direct Reuse On-Site
Return waste materials to the production process without significant processing — CKD and bypass dust re-injection into the raw mill, spent refractory brick as raw feed silica source, and conveyor belt scrap as fuel blend component. Target: 15-25% of currently landfilled waste redirected to on-site reuse.
Off-Site Byproduct Utilization
Redirect waste streams to external beneficial uses — CKD to soil stabilization in road construction, spent refractory to brick manufacturing, and used oil to industrial fuel blending. Requires beneficial use determination documentation for EPA and state regulatory compliance. Target: 10-20% diversion to external beneficial use.
Energy Recovery via Co-Processing
Use non-recyclable waste streams as alternative fuels in the cement kiln — used oil, non-recyclable plastics, rubber waste, biomass, and processed industrial waste. Co-processing replaces fossil fuels and eliminates landfill disposal simultaneously. Target: 15-30% thermal substitution rate from waste-derived fuels.
Responsible Disposal
Landfill disposal for waste streams that cannot be prevented, reused, recycled, or recovered — limited to materials with no viable circular pathway. iFactory tracks disposal volume, cost, and waste classification per RCRA requirements. Target: less than 40% of total waste mass to landfill within 24 months.
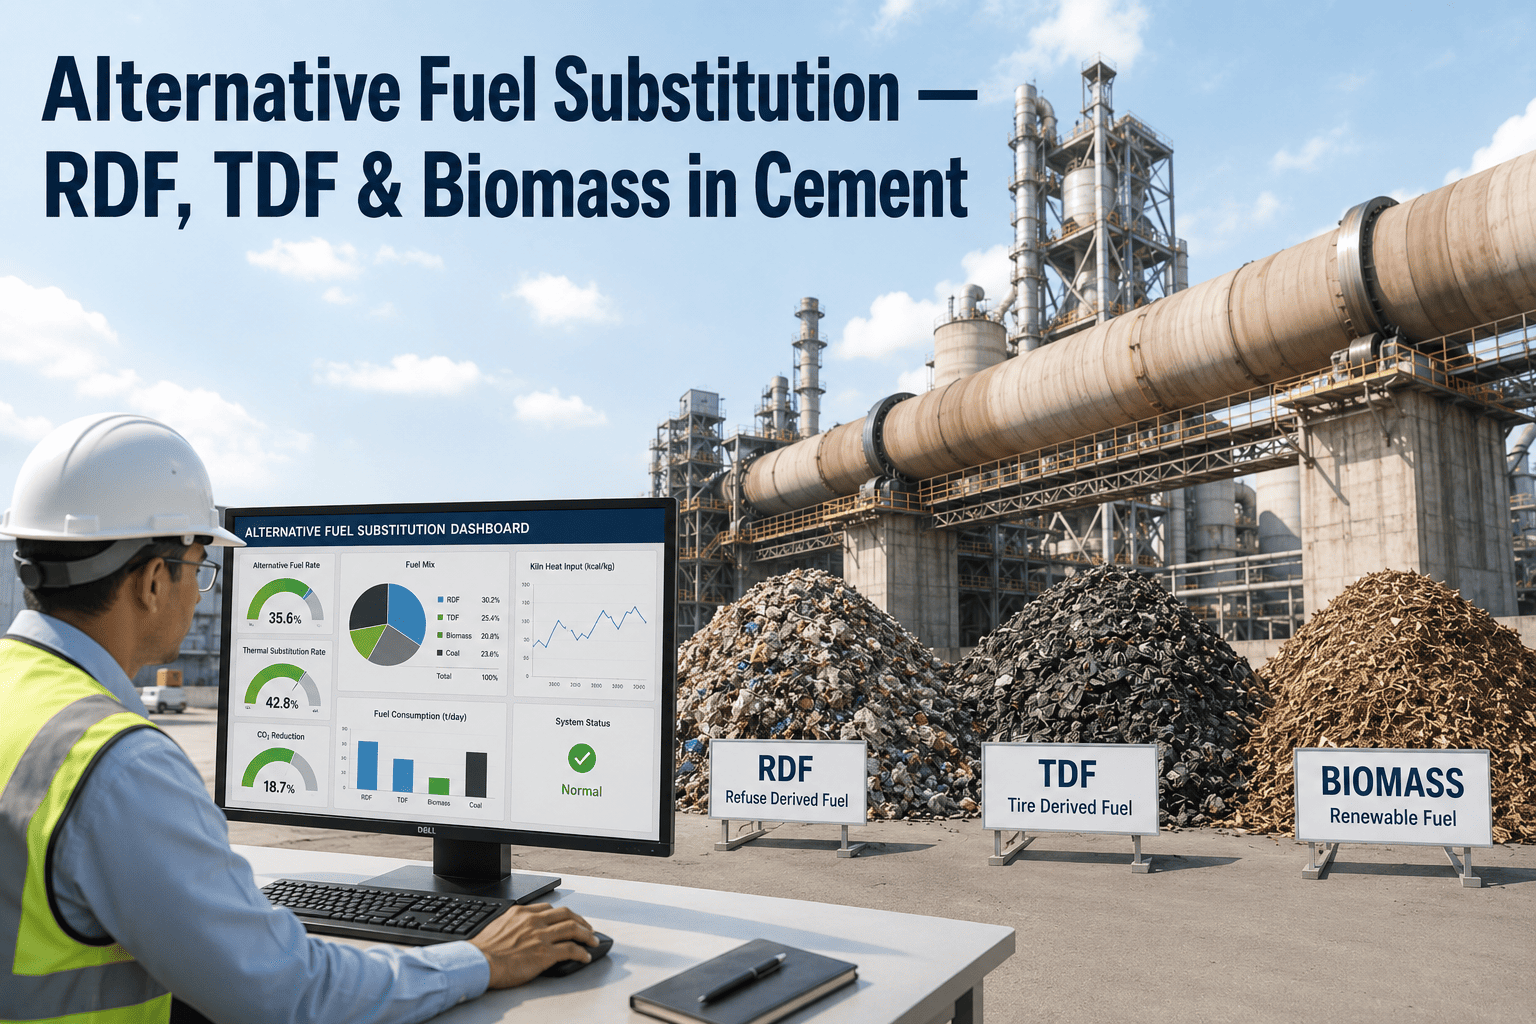
Waste-to-Energy in Cement Kilns — Fuel Substitution Potential by Waste Type
Cement kilns are uniquely suited for waste-to-energy co-processing because the high temperature (1,450 degrees C in the burning zone), long residence time, and alkaline environment ensure complete combustion of organic compounds and neutralization of acid gases. Waste-derived fuels can replace 15 to 60% of the plant's fossil fuel requirement depending on the kiln configuration, feed system, and regulatory permit conditions. The table below presents the fuel substitution potential, typical blending ratio, and per-ton cost comparison for the most common waste-derived fuels used in U.S. cement kilns.
Conventional Fuel
- Bituminous coal — $85-$120 per ton, 12,000-14,000 BTU per pound
- Petroleum coke — $60-$95 per ton, 14,000-15,000 BTU per pound
- Natural gas — $3.50-$6.00 per MMBTU, seasonal price volatility
- Combined annual fuel cost for a 2M ton plant: $8M to $14M
- 100% fossil fuel dependence — full exposure to energy market volatility
Waste-Derived Alternative Fuel
- Tire-derived fuel — $30-$55 per ton, 12,000-14,000 BTU per pound; 25-40% substitution feasible
- Processed industrial waste (fluff) — $15-$35 per ton, 10,000-12,000 BTU per pound; 15-30% substitution
- Biomass (wood chips, ag waste) — $10-$25 per ton, 7,000-9,000 BTU per pound; 10-20% substitution
- Used oil and solvents — $0-$15 per ton (tipping fee received), 130,000-150,000 BTU per gallon; 2-5% substitution
- Combined substitution potential: 30-55% with $12-$18 per ton fuel cost savings
Cross-Industry Byproduct Utilization — What Cement Plants Can take from Other Industries
The cement industry's ability to consume industrial byproducts from other sectors is one of the most powerful circular economy mechanisms in manufacturing. Fly ash from coal-fired power plants, blast furnace slag from steel mills, and FGD gypsum from power plant scrubbers are already widely used as cement additives and raw feed components. But the byproduct synergy potential extends well beyond these three commodity materials. The table below presents the full range of industrial byproducts that cement plants can utilize, with their application in the cement process, typical substitution rate, and the annual material value at current market prices.
Fly Ash — Class C and Class F
Source: coal-fired power plants. Application: Portland cement additive at 15-40% by weight. Reduces clinker factor, lowers CO2 emissions, and improves sulfate resistance. Typical value: $18-$35 per ton delivered vs. $45-$65 per ton for clinker replacement. Annual savings at 10% substitution: $400,000-$900,000 for a 2M ton plant.
Blast Furnace Slag — Granulated
Source: iron and steel mills. Application: slag cement replacement at 25-70% by weight for blended cement production. Requires granulation and grinding but no additional processing at the cement plant. Typical value: $25-$40 per ton delivered vs. $50-$70 per ton for clinker. Annual savings at 20% substitution: $1.0M-$2.5M.
FGD Gypsum — Synthetic
Source: power plant wet scrubbers. Application: cement set retarder replacing natural gypsum at 3-6% by weight. Chemically identical to natural gypsum with higher purity. Typical value: $8-$15 per ton vs. $20-$35 per ton for natural gypsum. Annual savings: $120,000-$250,000 at full substitution.
Foundry Sand — Spent
Source: metal casting foundries. Application: silica and alumina source in raw feed, replacing virgin sand and clay at 3-8% of raw mix. Requires screening but no chemical treatment. Typical value: $5-$12 per ton delivered vs. $15-$25 per ton for virgin raw materials. Annual savings: $200,000-$500,000 at 5% substitution.
Lime Kiln Dust — LKD
Source: lime manufacturing plants. Application: calcium oxide source in raw feed, replacing limestone at 2-5% of raw mix. Higher available CaO content than limestone, reducing preheater energy consumption. Typical value: $10-$18 per ton vs. $14-$22 per ton for limestone. Limited availability by region.
Waste-Derived Fuel — Processed
Source: municipal solid waste processing facilities and industrial waste processors. Application: pre-processed fluff fuel injected at the calciner or main burner at 15-30% thermal substitution. Requires consistent quality specification and metals removal. Typical tipping fee received: $15-$40 per ton, providing a negative fuel cost.
What iFactory's Waste Management and Compliance Tracking Modules Deliver
iFactory digitizes the entire waste management workflow — from waste stream characterization and generation tracking to co-processing opportunity identification, beneficial use documentation, and RCRA compliance reporting. The system runs on the plant network via the iFactory NVIDIA appliance and integrates with existing scale systems, ERP platforms, and laboratory information management systems.
Waste stream characterization and profiling
Every waste stream in the plant is cataloged by type, composition, generation rate, source process area, EPA waste code (if applicable), and disposal cost per ton. The profile updates automatically as laboratory analysis results are entered and generation rates change with production levels.
Co-processing and byproduct opportunity matching
iFactory compares the plant's waste stream composition data against a database of known co-processing and byproduct utilization pathways — identifying which waste streams can be redirected from disposal to productive use and calculating the cost savings and diversion rate impact of each opportunity.
RCRA hazardous waste determination and manifesting
Automated hazardous waste determination based on laboratory analysis results against RCRA characteristic and listed waste criteria. The system generates EPA Form 8700-12, uniform hazardous waste manifests, and land disposal restriction notifications — reducing documentation errors and compliance exposure.
Beneficial use determination documentation
For waste streams redirected to beneficial use (CKD for soil stabilization, spent refractory for aggregate, etc.), iFactory maintains the BUD application package, analytical data, and regulatory correspondence required by EPA and state agencies for beneficial use approval and ongoing compliance.
Diversion rate tracking and ESG reporting
iFactory calculates waste diversion rate (percentage of total waste mass diverted from landfill through prevention, reuse, recycling, or recovery) in real time — providing the metric required for GRI 306 disclosure, CDP waste questionnaire, and corporate circular economy reporting.
Disposal cost tracking and optimization
Every waste shipment is logged with disposal method, hauler, destination facility, weight, and cost. iFactory generates monthly waste cost reports by process area and waste type — identifying the highest-cost waste streams that offer the greatest circular economy improvement ROI.
What Cement Plant Environmental Managers Say About Digital Circular Economy Waste Management
I have managed environmental compliance and waste programs at three cement plants over nineteen years — two in the Southeast and one in the Ohio River Valley — and the most persistent failure I have seen in cement plant waste management is not that plant managers do not care about circular economy principles. It is that they do not have the data to act on them. At my second plant, we were landfilling 6,200 tons per year of CKD at a cost of $310,000 in hauling and tipping fees alone. I had read the literature on CKD beneficial use for soil stabilization. I knew that a state DOT project 14 miles from the plant was importing 80,000 cubic yards of lime-stabilized fill material from a quarry 90 miles away. The connection between those two facts was visible to me because I had spent three years at that plant and I knew both the waste stream composition and the regional construction market. But there was no system at the plant that could make that connection for a new environmental manager on day one. At the third plant, we deployed iFactory's waste management module and configured the waste stream profiles for CKD, spent refractory, used oil, and baghouse waste. Within the first month of operation, the system identified that 1,400 tons per year of our CKD had a chemical composition that matched the specifications of a local soil stabilization contractor who was buying lime-treated fill at $18 per ton delivered. We redirected that 1,400 tons from the landfill to the contractor at a net revenue of $7 per ton after hauling — turning a $70,000 disposal cost into a $9,800 revenue stream. That opportunity had existed for the entire 12 years the plant had been operating. No one had seen it because no one had connected the waste characterization data to the market opportunity data. That is what a digital waste management system does that a binder and a spreadsheet cannot. It makes the connections visible. The circular economy does not require new materials. It requires new visibility into the materials you already have.
— Plant Environmental Manager, U.S. Cement Manufacturing — 19 Years Environmental Compliance and Waste Management — Certified Industrial Hygienist (CIH) — Registered Environmental Manager (REM)Common Questions About Circular Economy Waste Management for Cement Plants
From Waste Liability to Resource Asset — The Circular Economy Is a Data Problem
Cement plants generate millions of tons of waste material every year across the U.S. industrial base — and the majority of that material is landfilled because the plant's management team cannot see the co-processing opportunity, the byproduct match, or the beneficial use pathway that would redirect it from disposal to productive use. The circular economy is not a technology problem. It is not a chemistry problem. It is a data visibility problem — and it is the one problem that a properly configured digital waste management platform can solve immediately.
iFactory's Waste Management and Compliance Tracking modules provide cement plant environmental and production managers with the data infrastructure to characterize every waste stream, identify every circular economy opportunity, track every diversion metric, and document every compliance requirement — replacing the disposal-cost-focused waste management program with a resource-recovery-focused circular economy program that reduces costs, generates revenue, and improves the plant's environmental footprint simultaneously. The 35 to 55% waste diversion rate, the $12 to $18 per ton fuel cost savings from co-processing, and the elimination of RCRA documentation errors at iFactory-managed plants are not the result of waste management theory. They are the result of having a system that makes the circular economy visible and actionable in daily plant operations. Book a Demo to see how iFactory's platform manages waste characterization, co-processing optimization, circular economy tracking, and RCRA compliance for your plant's material streams.
Stop Paying to Bury Materials That Have Value
Your waste stream contains revenue opportunities that are invisible in a binder and a spreadsheet. iFactory makes them visible — every ton, every cost, every circular economy pathway. Book a demo and see the system running on a cement plant network today.