The maintenance manager at a 3,200-tpd cement plant in the Southeast reviews the previous quarter's baghouse performance data and sees a pattern that has cost the plant $187,000 in preventable expenses — three unscheduled kiln line stoppages caused by baghouse differential pressure exceeding the 8-inch w.g. alarm threshold, forcing the control room operator to reduce kiln feed rate by 40% while the maintenance team replaced 144 filter bags in the number 2 compartment during a rolling bag change that took 14 hours instead of the scheduled 6. The root cause was not a defective bag. It was a pulse-jet cleaning controller that had drifted out of timing calibration over six months of continuous operation — cleaning bags less frequently on the inlet rows and more frequently on the outlet rows, creating an uneven dust cake distribution that overloaded one quadrant of the baghouse while the other three quadrants operated below their design air-to-cloth ratio. The plant's CEMS data showed that the opacity spike during the event reached 12% — above the 10% permit limit — triggering a reportable emissions exceedance that required a root cause analysis submission to the state environmental agency. The plant's baghouse had its own PLC, the compressed air system had its own controller, the CEMS had its own data logger, and the maintenance log was in a spreadsheet. No single system connected the pulse-jet timing data to the differential pressure trend to the opacity reading to the maintenance event. iFactory's Preventive Analytics and Environmental Monitoring modules give cement plant maintenance and environmental managers the digital infrastructure to monitor every baghouse compartment's differential pressure, pulse-jet cleaning frequency, compressed air consumption, outlet opacity, and filter bag service life in a single real-time dashboard — with predictive alerts that identify developing problems before they trigger an emissions exceedance or a production stoppage. Book a Demo to see iFactory's dust collection analytics platform configured for your plant's baghouse and ESP systems.
From Reactive Bag Changes to Predictive Filter Management — Dust Collection Analytics for Cement Plants
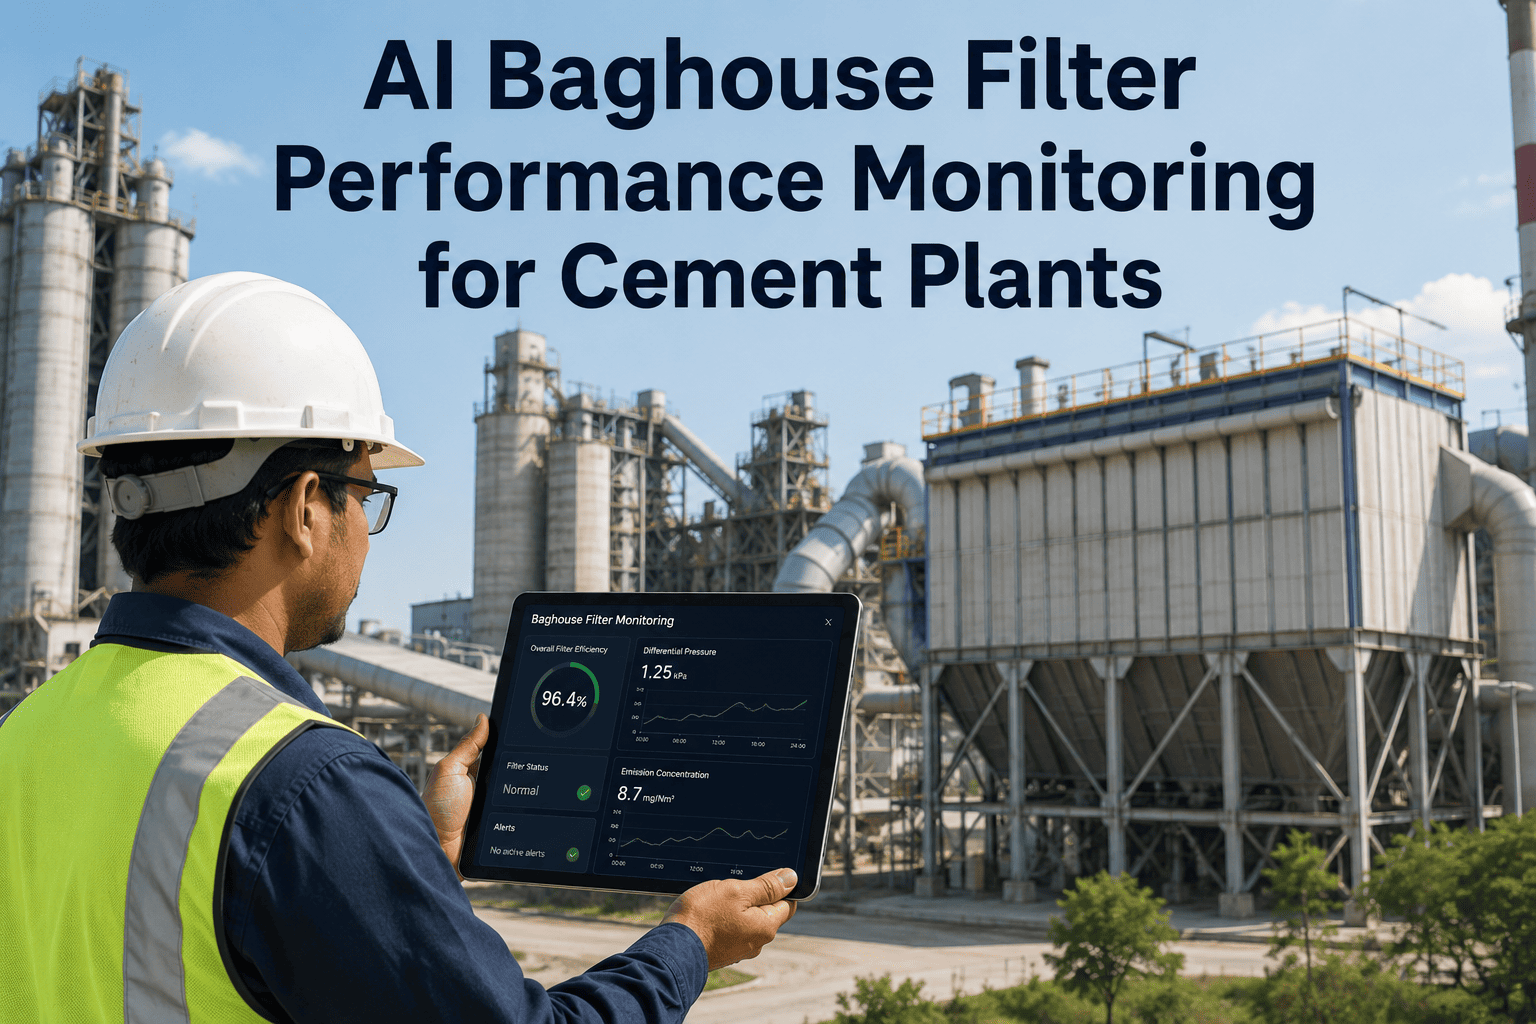
Every baghouse compartment and ESP field generates data that can predict filter failure, optimize cleaning cycles, and prevent emissions exceedances — if the data is connected. iFactory's dust collection analytics platform monitors differential pressure, pulse-jet timing, opacity, and bag service life in one real-time dashboard.
Why Dust Collection Systems Fail Silently — and What It Costs When They Do
Dust collection systems in cement plants — pulse-jet baghouses and electrostatic precipitators — are the last line of defense between the kiln line production process and the plant's compliance with EPA National Emissions Standards for Hazardous Air Pollutants (NESHAP) and state particulate matter emission limits. When a dust collection system begins to fail, the failure is almost never sudden. It develops over weeks or months — a pulse valve that fires late, a solenoid coil that weakens, a bag that develops a pinhole leak that grows into a tear, an ESP transformer-rectifier set that drifts out of spark-rate specification. The data that would reveal these developing problems exists in the baghouse PLC, the compressed air system controller, the CEMS data logger, and the maintenance log — but it is not connected in a way that allows the maintenance manager or the control room operator to see the pattern before it becomes a reportable event. The five problems below are the most common failure modes that iFactory's analytics platform detects before they trigger an emissions exceedance or a production stoppage at cement plant dust collection systems.
Pulse-jet cleaning drift — the root cause of most baghouse DP spikes
Pulse-jet cleaning controller timing drifts over months of operation — solenoid valves fire at intervals that deviate from the programmed sequence, some compartments get overcleaned while others accumulate dust cake until the differential pressure climbs above the alarm threshold. Without pulse-jet timing analytics, the drift is invisible until the DP alarm sounds and an operator must investigate each solenoid valve manually.
Compressed air system inefficiency — wasted energy and reduced cleaning effectiveness
Baghouse pulse-jet systems consume 15-25% of the plant's compressed air capacity. When pulse timing drifts or solenoid valves leak, compressed air consumption increases by 20-40% without improving cleaning effectiveness — wasting energy at $0.08-0.12 per kWh and reducing the available compressed air capacity for other plant systems.
ESP spark-rate drift and electrode misalignment — invisible performance degradation
Electrostatic precipitator performance depends on maintaining the correct voltage-current relationship across each field. When transformer-rectifier sets drift out of specification or collecting plates become misaligned due to thermal expansion or rapping system wear, the spark rate increases and collection efficiency drops — often for weeks before the trend is visible in the opacity reading.
Filter bag service life variability — premature failures that could have been predicted
Filter bag life in a cement plant baghouse varies from 18 months to 60 months depending on gas temperature excursions, chemical attack from acid gas condensation, mechanical stress from pulse-jet cleaning, and bag-to-cage fitment issues. Without individual bag or row-level service life tracking, the maintenance team cannot identify the compartments where bags are failing early or adjust cleaning parameters to extend life for the rest of the bag set.
Opacity compliance risk — the consequence that compounds all other dust collection failures
When a baghouse or ESP begins to underperform, the first consequence is not a reportable exceedance — it is an opacity trend that drifts from 3% to 6% to 9% over several weeks, staying below the 10% permit limit but indicating a developing problem. Without predictive analytics that correlate opacity with differential pressure, pulse-jet timing, compressed air consumption, and bag service life, the maintenance team cannot distinguish between a developing bag failure that will require immediate attention and a seasonal operating condition change that will self-correct.
Five Analytics Capabilities That Transform Dust Collection System Management
The following five analytics capabilities represent the highest-impact applications of real-time monitoring and predictive analytics for cement plant dust collection systems. Each capability addresses a specific failure mode or performance gap that iFactory has identified across deployments at dry-process preheater-precalciner cement plants in the U.S. market. Each capability is delivered through the iFactory platform running on the plant's NVIDIA appliance, with data integration through standard OPC-UA connections to existing baghouse PLCs, ESP controls, and CEMS data loggers.
Real-Time Differential Pressure Monitoring by Compartment
iFactory monitors the differential pressure across each baghouse compartment continuously — comparing the current DP against the baseline DP established after the last bag change and against the compartment-level alarm threshold. When a compartment's DP begins to drift upward relative to the other compartments (indicating a developing bag fouling issue) or downward (indicating a bag leak), the system alerts the control room operator with the specific compartment location and the probable cause based on the DP trend shape and slope.
Pulse-Jet Cleaning Cycle Analytics and Timing Optimization
iFactory tracks every pulse-jet cleaning event — recording the solenoid valve firing time, duration, compressed air pressure at the manifold, and the resulting DP reduction in each compartment. The analytics model identifies compartments where the pulse-jet timing has drifted from the programmed sequence, solenoid valves that are firing late or not firing, and cleaning cycles that are consuming excessive compressed air without producing a proportional DP reduction.
ESP Field Performance Monitoring and Spark-Rate Analytics
iFactory monitors each ESP field's primary voltage, primary current, secondary voltage, secondary current, and spark rate — comparing the actual operating parameters against the design specification for each field. When a field's spark rate exceeds the target threshold or the voltage-current relationship deviates from the expected curve, the system identifies the probable cause (TR set drift, electrode misalignment, rapping system malfunction, or gas flow distribution issue) and recommends corrective action.
Filter Bag Service Life Tracking and Predictive Replacement Scheduling
iFactory tracks the service life of each filter bag or row of bags from installation to replacement — recording the installation date, the cumulative operating hours at each temperature range, the number of cleaning cycles applied, the number of temperature excursions above 220 degrees C (the typical upper limit for polyester felt bags), and the DP trend over the life of the bag.
Opacity Correlation and Predictive Emissions Monitoring
iFactory correlates the continuous opacity monitor (COM) reading with the baghouse or ESP operating parameters — enabling the system to distinguish between opacity spikes caused by a developing bag failure versus those caused by normal process variations such as kiln startup, fuel switch, or raw mill start-stop events. When the correlation model detects that the opacity trend is driven by a developing mechanical issue rather than a process condition, the system generates a predictive alert with the estimated time to exceedance.
Dust Collection Technology Comparison — Performance, Cost, and Analytics Requirements by System Type
U.S. cement plants operate three primary types of dust collection systems — pulse-jet baghouses, electrostatic precipitators, and hybrid systems that combine both technologies in series. Each system type has distinct performance characteristics, maintenance requirements, and analytics priorities. The table below presents the key comparison parameters for each system type at cement plant scale, based on operating data from iFactory-managed plants and industry benchmarks from EPA AP-42 emission factors and PCA survey data.
| Parameter | Pulse-Jet Baghouse | Electrostatic Precipitator | Hybrid Baghouse + ESP |
|---|---|---|---|
| PM emission outlet concentration | 1-5 mg/Nm³ | 10-30 mg/Nm³ | 1-3 mg/Nm³ |
| Pressure drop (inches w.g.) | 4-8 | 0.5-2.0 | 4-8 (baghouse section) |
| Operating temperature range | 120-220°C (fabric dependent) | 120-400°C | 120-220°C |
| Sensitivity to gas temperature excursions | High — bag damage above 220°C | Low — ceramic/steel components | High — baghouse section limits range |
| Sensitivity to inlet dust loading variation | Moderate — DP responds to loading | High — collection efficiency drops with loading changes | Low — ESP dampens loading variation |
| Primary analytics priority | DP per compartment; pulse-jet timing; compressed air use | Spark rate; V-I curve per field; rapping cycle | Baghouse DP + ESP spark rate + interstage gas conditioning |
| Typical bag / electrode replacement cycle | 24-60 months (bag life) | 120-240 months (electrode life) | 24-60 months (bag section); 120-240 months (ESP section) |
| Annual maintenance cost ($/t clinker) | $0.40-0.80 | $0.15-0.35 | $0.45-0.90 |
Dust Collection System Applications Across the Cement Plant — Kiln, Cooler, Mill, and Material Handling
Dust collection systems in a cement plant serve multiple process areas — the kiln baghouse or ESP (the main dust collector serving the preheater tower and kiln), the clinker cooler baghouse or ESP, the raw mill baghouse, the finish mill baghouse, and the material handling dust collectors serving the raw material storage, additive storage, and cement transport systems. Each application has distinct gas conditions, dust loading characteristics, and performance requirements that determine the appropriate dust collection technology and the analytics parameters that matter most for that application.
Kiln / Preheater Dust Collector
The main kiln baghouse or ESP processes the entire preheater exhaust gas stream — typically 400,000 to 600,000 ACFM at 160-220°C with dust loading of 10-30 g/Nm³ (grain loading 5-15 gr/dscf) depending on raw mill operation and bypass system configuration. Analytics priority: differential pressure by compartment, pulse-jet timing optimization, temperature excursion monitoring, and continuous opacity correlation. A DP increase of 1 inch w.g. across the kiln baghouse increases the kiln ID fan power consumption by 80-120 kW — costing $50,000-75,000 per year in additional power cost at typical operating hours.
Clinker Cooler Dust Collector
The clinker cooler baghouse or ESP handles the cooler vent air stream — typically 200,000 to 350,000 ACFM at 100-200°C with higher dust loading (15-40 g/Nm³) and coarser particle size distribution than the kiln baghouse. The cooler dust collector is particularly susceptible to thermal excursions during cooler upset conditions and to abrasive wear from coarse clinker dust. Analytics priority: inlet dust loading trend, temperature excursion detection, and shell integrity monitoring for corrosion from condensation during cooler startups.
Raw Mill and Finish Mill Dust Collectors
The raw mill baghouse handles the mill exhaust stream at 80-100°C with high moisture content (15-30% by volume from raw material drying) and the finish mill baghouse handles cement mill exhaust at 80-120°C with fine particle loading. These collectors operate at lower temperatures than the kiln baghouse — making them more susceptible to condensation, bag blinding, and acid gas attack when sulfur compounds from raw materials or gypsum combine with condensed water vapor. Analytics priority: dew point margin monitoring, compartment DP comparison, and compressed air consumption tracking.
Dust Collection Analytics Readiness — What Your Plant Needs for Successful Deployment
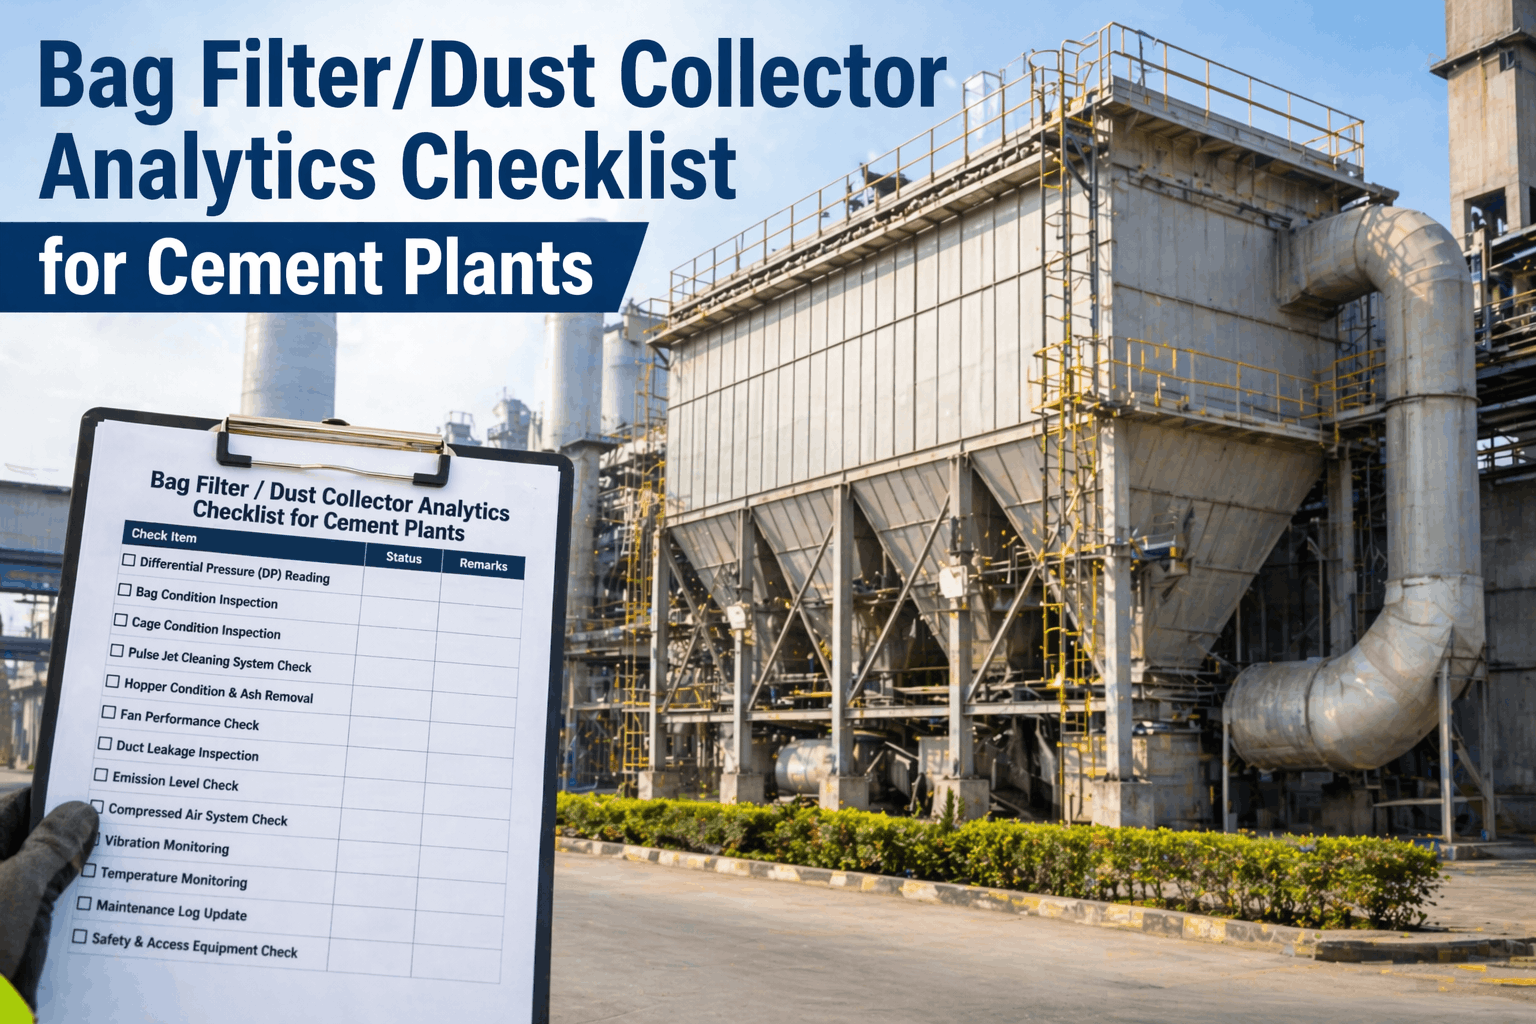
Implementing dust collection analytics at a cement plant requires preparation across five areas — data connectivity from existing controls, sensor coverage assessment, baseline performance characterization, alarm threshold definition, and team training. The checklist below covers the essential elements that iFactory's implementation team reviews during the dust collection analytics deployment at each cement plant.
Baghouse PLC or ESP controller data connectivity via OPC-UA
iFactory connects to the baghouse PLC, ESP control panel, or CEMS data logger through standard OPC-UA, Modbus TCP, or REST API protocols — reading differential pressure per compartment, pulse-jet firing count per solenoid, compressed air pressure, opacity, and flue gas temperature data without modifying the existing control logic.
Compartment-level DP sensor coverage verification
iFactory requires a differential pressure transmitter on each baghouse compartment and on each ESP field section to provide compartment-level performance visibility. Plants with a single DP transmitter for the entire baghouse will need to install compartment-level sensors — a typical retrofit cost of $2,000-4,000 per compartment including installation and wiring.
Baseline DP profile after last bag change or ESP maintenance
A baseline differential pressure profile is established for each compartment after the most recent bag change or ESP electrode cleaning — recording the DP at the start of the cleaning cycle, the DP reduction per pulse event, the DP recovery rate between cleaning cycles, and the compressed air consumption per compartment at known inlet dust loading conditions.
Compartment-level alarm threshold configuration
iFactory configures three alert levels for each compartment: a warning threshold at 80% of the high DP alarm setpoint (triggering a notification to the shift maintenance technician), a critical threshold at 95% (triggering a notification to the maintenance manager and control room), and a predictive threshold based on the DP trend slope (triggering when the model predicts the compartment will reach the alarm setpoint within the next 48 hours).
CEMS opacity data integration and correlation model calibration
iFactory connects to the plant's continuous emissions monitoring system to import opacity data at 1-minute or 6-minute intervals (depending on the plant's CEMS data reporting frequency) and calibrates the correlation model between baghouse or ESP operating parameters and the opacity trend — enabling predictive alerts that distinguish between process-driven opacity variation and equipment-driven opacity degradation.
Control room dashboard configuration and team training
iFactory configures the dust collection analytics dashboard for the control room — displaying the baghouse or ESP overview, compartment-level DP trends, pulse-jet cleaning status, compressed air consumption, opacity correlation, and active alerts. The implementation team provides two days of on-site training for control room operators, maintenance technicians, and environmental compliance staff.
Your Baghouse Is Telling You When It Will Fail — iFactory Makes Sure You Hear It
Every compartment DP trend, every pulse-jet firing pattern, every opacity reading contains the signature of developing problems — if the data is connected and analyzed in real time. iFactory connects the data, surfaces the patterns, and alerts your team before the problem becomes a reportable event. Book a demo and see the system running on a cement plant dust collection network today.
Deploying Dust Collection Analytics at a Cement Plant — A Phased Approach
iFactory's dust collection analytics module is deployed in five phases, from initial data connectivity through full operational capability. Each phase builds on the previous phase and delivers measurable value before the next phase begins — the DP monitoring dashboard is live and generating alerts before the predictive model training is complete.
Phase 1: Connect and Configure
OPC-UA connections to baghouse PLC or ESP controller; CEMS data link; compartment-level DP sensors verified or installed; baseline DP profile established. Duration: 2-3 weeks. Value: real-time DP visibility per compartment.
Phase 2: Monitor and Alert
Compartment-level DP thresholds configured; pulse-jet timing monitoring live; compressed air tracking active; opacity correlation model initial calibration. Duration: 1-2 weeks. Value: predictive alerts for developing DP and opacity issues.
Phase 3: Analyze and Predict
Pulse-jet timing optimization model trained on historical cleaning data; bag service life tracking initialized for new bag sets; ESP spark-rate analytics configured. Duration: 2-3 weeks. Value: cleaning cycle optimization and bag life prediction.
Phase 4: Optimize and Automate
Pulse-jet timing recommendations integrated with baghouse PLC (read-only advisory initially); compressed air consumption optimization model active; opacity correlation model refined with 4-6 weeks of operating data. Duration: 2-3 weeks. Value: automated cleaning cycle adjustment recommendations.
Phase 5: Continuous Improvement
Predictive models retrain on new operating data quarterly; bag life predictions updated as bags accumulate service hours; annual DP baseline re-established after bag change or ESP maintenance. Duration: ongoing. Value: sustained emission compliance and extended bag/electrode service life.
What Cement Plant Maintenance and Environmental Managers Say About Dust Collection Analytics
I have managed air pollution control equipment maintenance at two U.S. cement plants over fifteen years — one in the Ohio River Valley operating a pulse-jet baghouse on a 5-stage preheater kiln, and one in the Intermountain West operating an electrostatic precipitator on a 6-stage preheater kiln with a raw mill that runs in parallel with the kiln for 60% of operating hours. The most persistent failure mode I have seen in cement plant dust collection management is not that the equipment cannot do the job. It is that the data trail leading up to a failure is usually three to six weeks long, and no one sees it because no one is looking at the right trend in the right context. At the Ohio River Valley plant, we experienced a baghouse compartment failure in February of 2023 — a gasket leak in the tube sheet at the inlet end of compartment 3 that allowed dust-laden gas to bypass the filter bags and exit through the clean air plenum, driving opacity from 4% to 14% over a weekend when the maintenance team was not on site. The plant received a notice of violation from the state environmental agency and paid a $28,000 penalty. After the event, I reviewed the DP trend for compartment 3 for the preceding six weeks. The compartment 3 DP had been decreasing relative to the other compartments for the entire period — a downward DP trend of 0.15 inches w.g. per week that indicated a developing leak. The DP trend was there in the baghouse PLC data logger. The control room operator looked at the DP trends once per shift as part of the operator rounds log — but the downward trend in compartment 3 was visible only when the compartment 3 DP was plotted on the same axis as the other compartments and the scale was set to show the divergence. In the plant's existing SCADA system, the compartment DP trends were displayed on separate screens with auto-scaling that made each compartment's DP look normal in isolation. No one had seen the divergence because no one was looking at the compartments in comparison. At the Intermountain West plant, we deployed iFactory's dust collection analytics module and configured the compartment-level DP comparison dashboard. Within the first month of operation, the system identified a developing downward DP trend in compartment 6 of the kiln baghouse — the same pattern that had been invisible at the previous plant. The maintenance team inspected compartment 6 and found a gasket that had loosened during a recent tube sheet repair. The repair took two hours and cost $400 in labor and materials. The opacity never exceeded 5% because the problem was found before the gasket failed completely. That is what analytics does that a SCADA trend screen cannot. It compares every compartment against every other compartment, every hour of every shift, and it surfaces the divergence that a human operator scrolling through auto-scaled screens will never see.
— Air Pollution Control Maintenance Manager, U.S. Cement Manufacturing — 15 Years Baghouse and ESP Maintenance — Certified Maintenance and Reliability Professional (CMRP) — ASTM D7681 Baghouse Committee MemberCommon Questions About Dust Collection System Analytics for Cement Plants
Dust Collection Analytics Turns an Emissions Liability into a Managed Asset — If You Connect the Data
Every baghouse compartment and every ESP field in a cement plant generates a stream of data — differential pressure, pulse-jet timing, compressed air consumption, opacity, temperature, voltage, current, spark rate — that contains the signature of developing problems days or weeks before they trigger an emissions exceedance or a production stoppage. The data exists. The sensors are in place. The PLCs and data loggers are recording. What is missing in most cement plants is the analytics layer that connects those data streams, compares each compartment against every other compartment every hour of every shift, and surfaces the divergence that signals a developing problem before it becomes visible in the opacity reading or the DP alarm.
iFactory's Preventive Analytics and Environmental Monitoring modules provide cement plant maintenance and environmental managers with the digital infrastructure to monitor every dust collection compartment's performance in real time — detecting pulse-jet timing drift before it causes a DP spike, identifying developing bag leaks before they trigger an opacity exceedance, tracking ESP spark-rate trends before collection efficiency degrades, and predicting filter bag service life so that replacements are scheduled during planned outages rather than emergency stoppages. The 40 to 60% reduction in unscheduled baghouse stoppages, the 12 to 18% increase in filter bag service life, and the elimination of opacity exceedances caused by equipment problems at iFactory-managed plants are not the result of better dust collection equipment. They are the result of having an analytics platform that makes the performance of every compartment visible, comparable, and actionable — every shift, every day. Book a Demo to see how iFactory's platform manages dust collection analytics, predictive emissions monitoring, and filter bag service life tracking for your plant's baghouse and ESP systems.
Your Baghouse Data Already Contains the Pattern of the Next Failure — iFactory Finds It Before the Opacity Spikes
Every compartment DP trend, every pulse-jet firing pattern, every opacity fluctuation is a data point that iFactory connects into a predictive picture of your dust collection system health. Book a demo and see the system configured for your plant's baghouse or ESP today.