-improvement-in-cement-plants.png)
In cement manufacturing, **MTBF (Mean Time Between Failures) improvement** has evolved from a simple metric into a mission-critical financial driver. Every high-capacity kiln and grinding mill depends on the stability of hundreds of mechanical and electrical sub-systems — and yet most facilities still track reliability through reactive spreadsheets, manual logbooks, and "guess-work" benchmarking. The gap between a world-class 98% availability target and the reality of frequent "nuisance trips" is where lost production margin, energy waste, and maintenance overtime breed. Understanding MTBF analytics requirements for cement plants is the foundation of a proactive, data-driven reliability culture. If you want to see how leading cement producers drive continuous reliability improvement, you can book a demo of our production intelligence platform today.
Is Your Cement Facility Maximizing the Time Between Failures?
Deploy real-time reliability dashboards, automated downtime root-cause classification, and AI-driven MTBF benchmarking — all in one connected system.
What MTBF Improvement Means for Cement Plant Performance
Mean Time Between Failures (MTBF) is the primary measure of a process's stability. In a cement plant, it represents the average runtime between unplanned stops of critical assets like the kiln or raw mill. Improving MTBF extends beyond just "fixing machines faster" (which is MTTR); it involves a structural shift toward **Reliability Centered Maintenance (RCM)** — identifying and eliminating the root causes of failure before they occur. For cement producers, every hour of unplanned downtime represents a "Thermal Shock" to the kiln and a massive spike in specific energy consumption during the reheat cycle. High MTBF isn't just about production volume; it's about process stability, refractory life, and carbon footprint reduction.
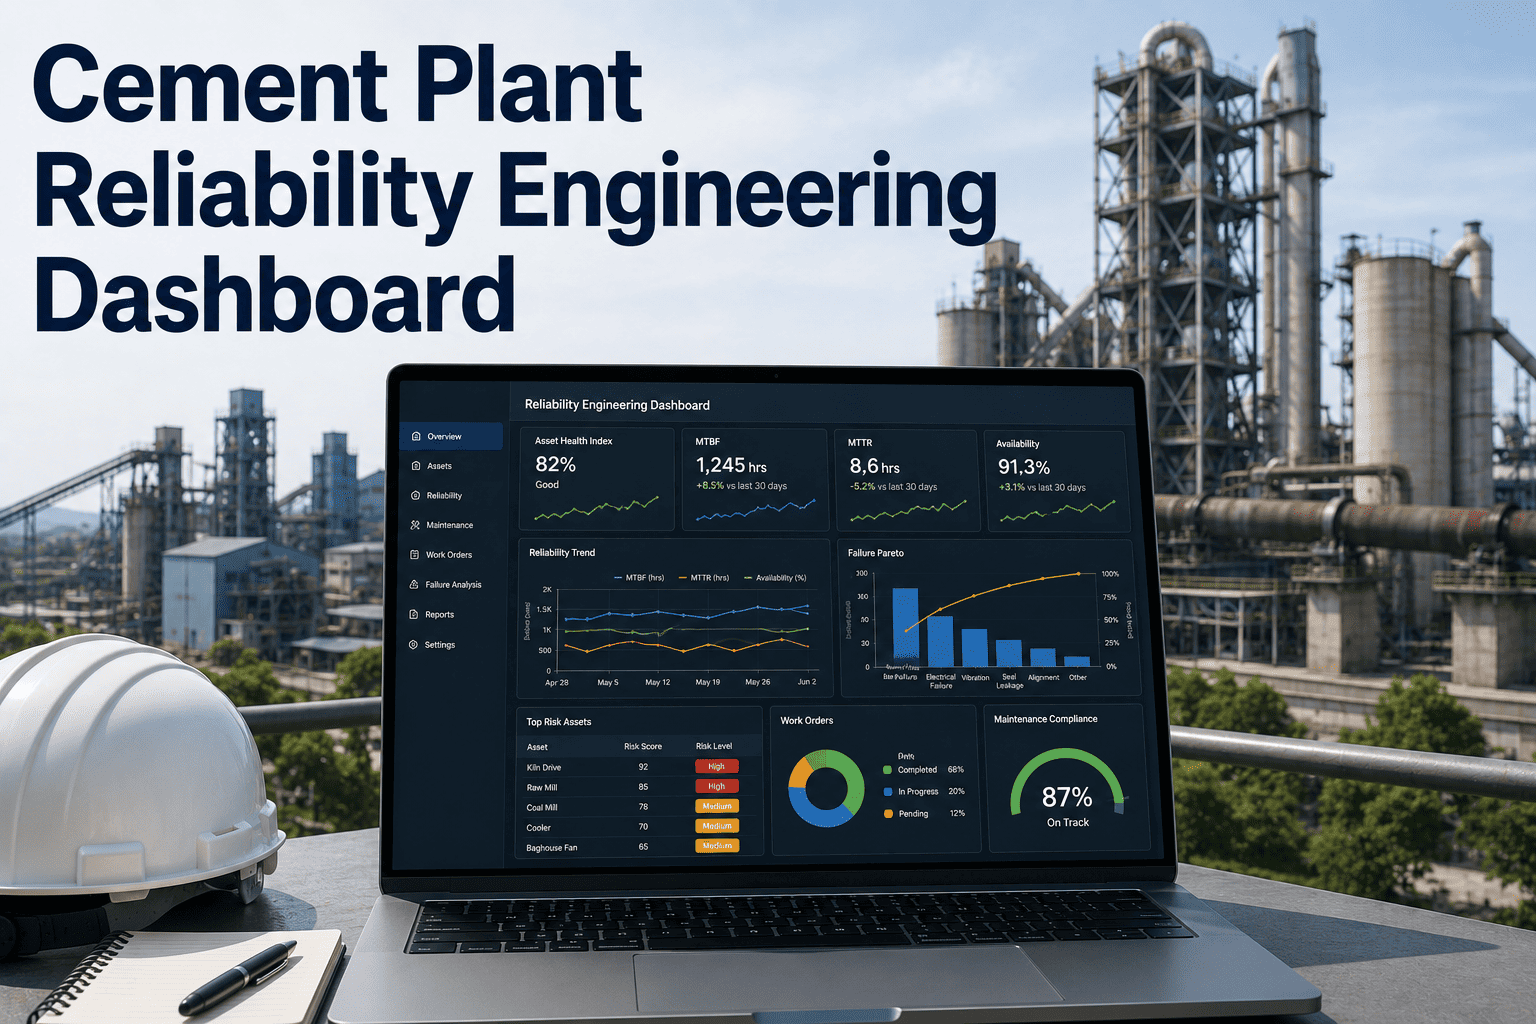
Modern reliability analytics platforms address this by connecting directly to SCADA and MES systems — capturing every stop event, no matter how brief, and delivering automated "Bad Actor" reports that highlight which assets are dragging down plant-wide OEE. The shift from manual downtime logging to proactive MTBF analytics is a structural improvement in how cement manufacturers manage asset risk. You can book a demo to explore how real-time reliability tracking works across different cement equipment categories.
Downtime Event Capture
Every reliability programme begins with the automated capture of every stop event — from 1-minute nuisance trips to multi-day outages — without manual operator entry.
Automated RCA Trigger
When MTBF drops below a specific threshold, the platform automatically initiates a Root Cause Analysis (RCA) workflow, ensuring that failures aren't just "fixed" but permanently eliminated.
MTBF vs. MTTR Analytics
The system correlates "Time Between Failures" with "Time To Repair," identifying whether downtime issues are driven by poor equipment reliability or slow maintenance response.
Bad Actor Identification
AI scans the plant-wide asset list to identify the top 5 "Bad Actors" — the assets responsible for 80% of unplanned stops — focusing engineering resources where they drive the most ROI.
Reliability Centered Maintenance
Integrating FMEA (Failure Mode and Effects Analysis) data to ensure that maintenance tasks are directly mapped to the specific failure modes that impact MTBF most frequently.
KPI Benchmarking
Automated comparison of plant reliability metrics against industry standards and multi-site benchmarks, providing management with clear visibility into operational performance.
MTBF Reliability Benchmarks: Cement Asset Performance Standards
Not all cement assets are designed for the same MTBF. A kiln, designed for continuous operation over months, requires a much higher stability index than a packing machine. The specific MTBF targets and availability requirements vary significantly by asset type and its position in the production flow. The table below provides a benchmark overview of typical "World Class" MTBF targets for primary cement plant equipment. For any facility where reliability improvement is being formalised, these benchmarks provide the "North Star" for your analytics configuration.
| Asset Type | MTBF Target (Hrs) | MTTR Target (Hrs) | Availability Index | Criticality |
|---|---|---|---|---|
| Cement Kiln (Main Drive) | 1,200+ Hours | < 8 Hours | 98%+ | Critical |
| Raw Mill / VRM | 450+ Hours | < 6 Hours | 95%+ | Critical |
| Primary Crusher | 300+ Hours | < 4 Hours | 92%+ | Critical |
| ID Fan / Process Fans | 2,500+ Hours | < 12 Hours | 99%+ | Critical |
| Clinker Cooler System | 600+ Hours | < 8 Hours | 96%+ | High |
| Belt Conveyor Systems | 1,000+ Hours | < 2 Hours | 99%+ | Medium |
| Bucket Elevators | 800+ Hours | < 5 Hours | 97%+ | High |
| Cement Packing Line | 150+ Hours | < 1 Hour | 85%+ | Medium |
These benchmarks represent standard "Tier 1" reliability targets and should be adjusted based on the age of your equipment, the abrasive nature of your raw materials, and your specific local operating environment. To build a reliability dashboard mapped to your facility's MTBF targets, you can book a demo with our reliability team.
How MTBF Improvement Architecture Works in Cement Manufacturing
The architecture of a successful MTBF improvement programme operates across five interconnected layers — from the shop-floor stop event to the executive KPI dashboard. Leading cement manufacturers who have implemented data-driven reliability programmes consistently report 15-20% higher kiln availability and significantly lower maintenance costs per ton. The cascade of value runs from accurate data capture upward — ensuring that every minute of downtime is used as a learning event to prevent the next one.
Automated Event Capture Layer
iFactory connects directly to PLCs and SCADA systems to capture the exact start and end times of every stop event. This eliminates the "Data Gap" created by manual operator logs, which often miss up to 30% of short stops.
Root Cause Classification Engine
Each stop event is classified by type — mechanical, electrical, process, or external — using AI to analyze the trip signals. This provides a clear "Pareto Chart" of downtime drivers without manual analysis.
MTBF Trend & Outlier Detection
The platform continuously tracks the MTBF trend for every asset. If an asset's MTBF drops below its historical baseline, the system flags it as an "Outlier," triggering a proactive reliability review before a major failure occurs.
RCM Action Integration
Identified failure patterns are linked back to the preventive maintenance (PM) programme. If an asset is failing frequently due to "bearing wear," the system recommends an adjustment to the PM frequency or lubrication strategy.
Corporate Reliability Benchmarking
All reliability data is compiled into high-level dashboards for plant and corporate management. This enables multi-site producers to compare performance and share "Best Practice" maintenance strategies across the group.
The Strategic Impact of MTBF Improvement: Beyond Just Downtime Reduction
MTBF improvement is the "Master Metric" for industrial efficiency. In a cement mill, the impact of a 20% improvement in MTBF reaches every department — from energy management to environmental compliance. Reliability is the prerequisite for sustainability; you cannot have an energy-efficient cement plant if it is constantly stopping and starting. Digital MTBF management addresses the three biggest bottlenecks in cement plant profitability. You can book a demo to see how automated reliability tracking can transform your plant's bottom line.
Every unplanned kiln stop requires a massive reheat cycle that wastes gigajoules of thermal energy. Improving MTBF directly reduces your plant's fuel consumption and carbon footprint per ton of clinker produced.
Thermal cycling is the #1 enemy of kiln brickwork. By maximizing the Mean Time Between Failures, you maintain a stable thermal profile, potentially extending refractory life by 15-25% and avoiding expensive annual relining.
Planned maintenance costs 3x-5x less than emergency repairs. Higher MTBF allows your maintenance team to move from "Firefighting" to "Precision Maintenance," reducing overtime and emergency part premiums.
Processes are most unstable during startup and shutdown. High MTBF means the plant stays in "Steady-State" longer, resulting in more consistent chemical properties and higher clinker quality yields.
MTBF Improvement Strategy: From Data Capture to Reliability Culture
The documentation and physical burden of a comprehensive reliability programme is substantial. Many cement plants struggle not with a lack of data, but with a lack of *actionable insights*. Most maintenance teams are overwhelmed by "Noise" — thousands of sensor alerts and log entries that don't point to a specific solution. Intelligent MTBF improvement systems transform this data into a strategic roadmap for engineering teams. If your facility is managing high-criticality assets and your current reliability posture relies on manual reporting, you can book a demo to review how our platform prepares your reliability strategy automatically.
Eliminate "The Ghost in the Machine" (Nuisance Trips)
Use automated event capture to identify the short-duration stops (under 5 minutes) that operators often forget to log. These "Nuisance Trips" are often early indicators of larger electrical or sensor failures that will eventually lower MTBF.
Correlate Reliability with Process Conditions
Linking MTBF data with process variables like kiln speed, feed rate, and vibration. This identifies if specific operating modes are "Asset Killers," allowing for the optimization of set-points for both throughput and reliability.
Implement a "Closed-Loop" RCA Workflow
Ensure that every significant MTBF deviation triggers a formal Root Cause Analysis. The platform tracks the implementation of "Action Items" from the RCA, ensuring that the same failure mode never happens twice.
Optimize Spares Inventory for Critical Assets
Use MTBF data to forecast part consumption. If an asset's MTBF is 500 hours and it uses a specific seal, the system can predict exactly when that seal will be needed — ensuring parts are on-site without excessive inventory costs.
Conduct Multi-Site Reliability Benchmarking
For multi-plant producers, use the analytics platform to compare MTBF across identical assets (e.g., ID Fans at Plant A vs. Plant B). This surfaces the best operating and maintenance practices across the entire organization.
Manual vs. Digital MTBF Management: The Reliability Performance Gap
The performance difference between manual reliability tracking and a digital MTBF improvement programme is not marginal — it is structural. Facilities that have transitioned to real-time digital monitoring consistently report measurable improvements across every KPI, from kiln availability to maintenance budget adherence. When expressed in terms of production tonnage and energy waste, the financial case for digital reliability monitoring is typically decisive. To understand what a transition would look like for your specific facility, you can book a demo with our reliability team.
| Reliability Dimension | Manual / Spreadsheet-Based | iFactory MTBF Analytics | Performance Gain |
|---|---|---|---|
| Event Capture Accuracy | ~70% (Manual entry errors) | 100% (PLC-Direct Capture) | Critical |
| "Bad Actor" Identification | Months of manual data mining | Instant (Automated Dashboard) | High |
| Downtime Classification | Subjective (Operator opinion) | Objective (Logic-based tagging) | High |
| RCA Adherence Rate | Often skipped for small stops | Automated Workflow Enforcement | Critical |
| Kiln Availability | 88-92% (Standard) | 96-98% (World Class) | Critical |
| Maintenance Planning Lead Time | Reactive (Hours) | Predictive (Weeks/Months) | High |
| Energy Waste per Stop | High — Unmanaged thermal cycling | Low — Minimized unplanned trips | Medium |
Stop Guessing Why Your Plant Stopped. Start Improving Your Reliability with Data.
Our production intelligence platform gives cement producers automated KPI tracking, downtime root-cause analysis, and multi-site MTBF benchmarking — all in one connected system.
Frequently Asked Questions: MTBF Improvement for Cement Plants
What is the difference between MTBF and MTTR?
MTBF (Mean Time Between Failures) measures equipment reliability — it tells you how long a machine runs before it fails. MTTR (Mean Time To Repair) measures maintenance efficiency — it tells you how long it takes to fix it. A high-performance plant strives for the highest possible MTBF and the lowest possible MTTR.
How does improving MTBF reduce cement plant energy costs?
Unplanned stops are the #1 cause of thermal energy waste in a cement kiln. Every time the kiln stops, it begins to cool. Reheating the kiln to clinkerization temperature (1450°C) requires a massive, inefficient spike in fuel consumption. High MTBF keeps the process in "Steady-State," maximizing the thermal efficiency of every gigajoule of fuel.
What is a "Bad Actor" in reliability engineering?
A "Bad Actor" is an asset that is responsible for a disproportionate amount of downtime or maintenance cost. In many cement plants, 20% of the equipment causes 80% of the failures. AI-driven MTBF analytics automatically identifies these assets, allowing you to focus your engineering resources on the problems that matter most.
How can I accurately calculate MTBF for a kiln with dozens of sub-systems?
iFactory uses "Sub-System Tagging." We link the MTBF of the main kiln asset to its critical sub-systems (main drive, lubrication system, pre-heater fans). When the kiln stops, the system identifies which sub-system triggered the trip, giving you a granular MTBF breakdown of your most complex assets.
What is "Reliability Centered Maintenance" (RCM)?
RCM is a strategy that focuses on maintaining the specific functions of an asset that are critical to the process. Instead of doing "Generic" maintenance, RCM uses MTBF data and FMEA to decide which maintenance tasks are actually necessary to prevent the specific failure modes that cause downtime.
Can the platform track "Nuisance Trips" that last only a few seconds?
Yes. By connecting directly to the PLC, iFactory captures every stop event down to the millisecond. Tracking these "micro-stops" is critical for MTBF improvement, as they are often early-warning signs of failing sensors, loose electrical connections, or process instabilities that will eventually lead to major failures.
How does MTBF improvement impact refractory life?
Thermal shock from sudden stops causes kiln bricks to spall and crack. By increasing MTBF, you reduce the number of thermal cycles the refractory must endure. This significantly extends the life of the kiln lining, potentially pushing a relining outage from 12 months to 15 or 18 months.
What is the "Kiln Reliability Factor"?
The Kiln Reliability Factor is a specific cement industry benchmark (Actual Runtime / Planned Runtime). While MTBF measures the time between stops, the Reliability Factor measures how well you hit your production schedule. iFactory tracks both, providing a complete picture of operational stability.



.png)