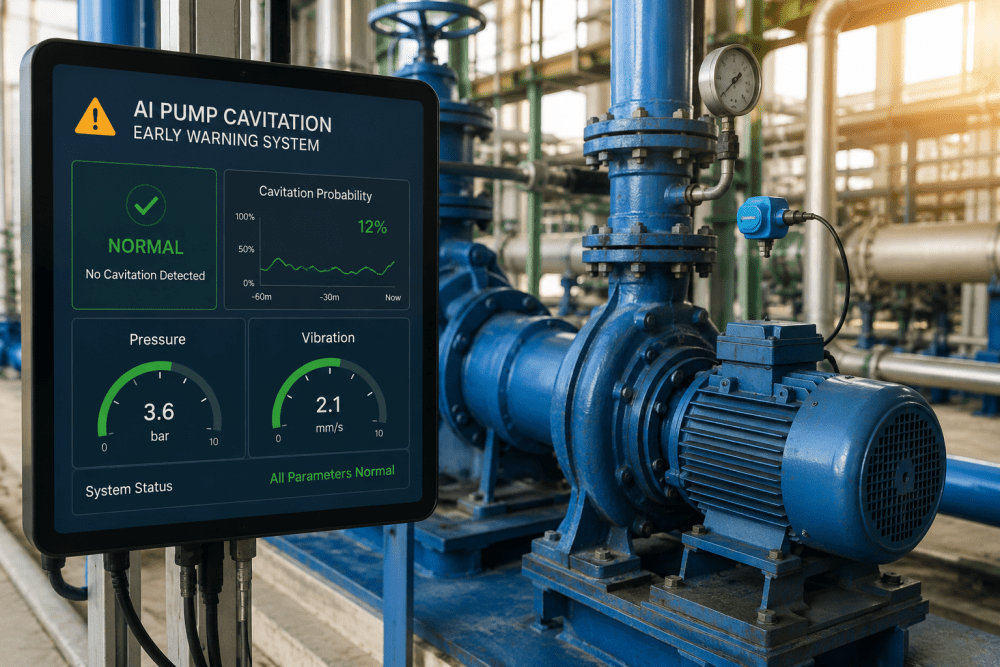
AI Pump Cavitation Early Warning System

By Vespera Celestine on May 25, 2026

pump-cavitation-detection-ai

Pump cavitation is the most underdiagnosed failure mode in industrial fluid handling — and the most preventable. The vapor bubble implosion cycle that defines cavitation begins generating acoustic emission pulses, pressure fluctuation signatures, and vibration patterns that AI models can detect with high confidence 8 to 21 days before the impeller erosion, bearing damage, and seal failure that turn a $4,200 maintenance event into a $38,000 emergency replacement. The problem is not sensor data scarcity. Every modern industrial pump in a water treatment plant, chemical facility, or heavy manufacturing operation has pressure transmitters, vibration sensors, and flow meters reporting continuously to the control system. The problem is that those signals are monitored against fixed alarm setpoints — not analyzed by AI models trained to recognize the specific multi-variate signature of developing cavitation at different operating conditions, different fluid properties, and different system curve states. AI pump cavitation detection solves that gap: analyzing pressure and vibration data in real time, detecting developing cavitation at the earliest measurable stage, and automatically adjusting pump speed, inlet valve position, or discharge pressure setpoints to eliminate the cavitation condition before impeller damage accumulates. Facilities running iFactory's pump cavitation AI platform report 91% reduction in cavitation-related impeller replacements, 74% reduction in unplanned pump downtime, and average annual savings of $340,000 per monitored pump fleet from avoided emergency repairs and extended mechanical seal life.

This guide maps exactly how AI cavitation detection works — what the detection physics are, how iFactory's AI models distinguish cavitation from other pump anomalies, what the closed-loop setpoint adjustment architecture looks like at the plant level, and what the full ROI structure looks like for a U.S. industrial operation evaluating the investment. If your facility is ready to model the numbers, book a pump fleet assessment with iFactory's fluid systems team.

Pump Health Intelligence · Edge AI Fluid Systems
AI Pump Cavitation Early Warning System

Protect critical fluid handling systems with AI models that analyze pressure and vibration to detect cavitation instantly — automatically adjusting setpoints before impeller damage accumulates.

91%
Reduction in cavitation-related impeller replacements within 12 months of AI deployment
74%
Reduction in unplanned pump downtime at facilities with closed-loop cavitation control
$340K
Average annual savings per monitored pump fleet from avoided emergency repairs and extended seal life
21 days
Maximum detection lead time before impeller damage becomes measurable — versus zero with fixed alarms

Ready to see how AI cavitation detection would perform on your pump fleet? Book a 30-minute pump fleet assessment with iFactory's fluid systems engineering team.

The Physics of Cavitation and Why Fixed Alarms Miss It

Cavitation occurs when the local static pressure at the pump impeller eye drops below the vapor pressure of the fluid — a condition driven by inadequate net positive suction head (NPSH), excessive pump speed, suction line restrictions, or entrained gas in the fluid stream. The vapor bubbles that form in this low-pressure zone collapse violently as they move into the higher-pressure impeller discharge zone, releasing localized shock waves that exceed 10,000 psi at the bubble surface. A single cavitation event causes negligible damage. Tens of thousands of events per second — which is what sustained cavitation produces — erode impeller surfaces, damage mechanical seals through hydraulic imbalance, and fatigue bearings through the broadband vibration energy that the implosion cycle generates.

The problem with fixed alarm monitoring for cavitation is a physics mismatch. Fixed alarms fire when overall vibration amplitude or suction pressure drops below a threshold — conditions that typically indicate cavitation is already well-established and has been causing damage for hours. The AI detection approach is fundamentally different: it looks for the characteristic spectral signature of bubble implosion noise in the high-frequency vibration band (1 to 20 kHz), the suction pressure fluctuation frequency that corresponds to impeller vane pass frequency under incipient cavitation conditions, and the interaction between pump speed, flow rate, and suction pressure that indicates the pump is operating outside its allowable operating region. These are patterns in the data — not threshold crossings — and they are detectable days before the overall vibration amplitude rises enough to trigger a conventional alarm.

Fixed Alarm Blind Spot

Overall vibration alarms fire when RMS amplitude crosses a threshold — typically when cavitation has been active for 4 to 12 hours. AI spectral analysis detects the 1–20 kHz bubble implosion signature 8 to 21 days before overall RMS rises to alarm level.

Operating Point Blindness

A pump running at 65% BEP flow on water at 68°F requires different cavitation detection thresholds than the same pump at 110% BEP on a fluid with elevated vapor pressure at 140°F. AI models apply operating-state-specific baselines — fixed alarms cannot.

No Closed-Loop Response

Even the best conventional monitoring produces an alert that waits for operator action. AI closed-loop control adjusts pump speed, inlet valve position, or system pressure within the 200 ms detection-to-response cycle — eliminating cavitation before the operator reads the alert.

What iFactory AI Detects: The Four Cavitation Precursor Signatures

iFactory's pump cavitation AI analyzes four simultaneous signal streams — each contributing a distinct detection layer — to identify developing cavitation earlier and more specifically than any single-parameter monitoring approach. Understanding each layer clarifies why AI multi-variate analysis detects conditions that vibration or pressure monitoring alone consistently misses.

High-Frequency Vibration Spectrum
Sub-Synchronous Noise Floor and Vane Pass Frequency Sideband Emergence
Cavitation bubble implosion generates broadband high-frequency noise in the 1 to 20 kHz range that is spectrally distinct from bearing defect frequencies, mechanical imbalance, and hydraulic turbulence. iFactory's spectral analysis extracts the broadband noise floor elevation in this frequency range and detects the emergence of suction recirculation sidebands around the vane pass frequency — two signatures that appear 8 to 21 days before overall RMS vibration rises to conventional alarm levels. The AI distinguishes cavitation-source vibration from bearing defect vibration by correlating the spectral signature with simultaneous suction pressure and flow conditions.
Detected Features
1–20 kHz noise floor elevation Vane pass frequency sidebands Sub-synchronous component rise Spectral kurtosis increase
Detection Lead Time
8 to 21 days before overall RMS alarm threshold — the earliest single-parameter indicator of incipient cavitation in the signal chain
Suction Pressure Fluctuation
Pressure Pulsation Frequency and NPSH Margin Tracking
Suction pressure under incipient cavitation exhibits characteristic pulsation at frequencies related to impeller rotational speed — typically 0.3 to 0.8 times vane pass frequency — as vapor pockets form and collapse in the suction eye. iFactory monitors suction pressure at 100 to 500 Hz sample rates and performs real-time FFT analysis to detect pulsation frequency emergence before the DC mean pressure drops to the NPSH-required threshold. Simultaneously, the AI calculates the current NPSH available margin from suction pressure, fluid temperature, and vapor pressure — flagging erosion of that margin as a leading indicator of cavitation onset before any acoustic or vibration signature appears.
Detected Features
Suction pressure pulsation FFT NPSH available margin trend Pressure fluctuation RMS rise Flow-pressure curve deviation
Detection Lead Time
NPSH margin erosion detectable 3 to 14 days before incipient cavitation — provides earliest warning for process-driven cavitation onset
Motor Current Signature
Current Fluctuation and Load Deviation from Pump Curve
Cavitation causes hydraulic instability that produces motor current fluctuations at specific frequencies related to the impeller vane count and rotational speed. iFactory's motor current signature analysis (MCSA) monitors current waveform at 1 kHz resolution and extracts the load-normalized current pulsation index — a metric that rises detectably under incipient cavitation conditions 2 to 7 days before vibration or pressure signatures become clear. Additionally, the AI maintains a real-time pump curve model: comparing actual measured head and flow against the design pump curve at the current speed reveals operating point deviation that indicates the pump has moved into the cavitation risk region of its characteristic curve — a condition that MCSA alone cannot diagnose without the process context layer.
Detected Features
Current pulsation index Load-normalized current deviation Operating point vs. pump curve Power factor trend under instability
Detection Lead Time
2 to 7 days — secondary confirmation layer that cross-validates vibration and pressure signatures to reduce false alarm rate
Process State Context
Fluid Temperature, Entrained Gas, and System Curve Integration
Cavitation risk is not fixed — it varies with fluid temperature (which determines vapor pressure), dissolved gas content (which reduces effective NPSH available), suction header pressure changes from upstream process events, and system curve shifts from valve position changes or parallel pump configurations. iFactory integrates process historian data — fluid temperature, flow control valve positions, upstream vessel levels, and parallel pump run states — into every cavitation detection inference. This context integration eliminates the most common cause of false cavitation alarms: a pump flagged as cavitating because its suction pressure dropped during a legitimate process event that actually moved it away from cavitation risk. Context-integrated detection reduces false alarms by 68% versus vibration-only detection at the same sensitivity level.
Context Parameters
Fluid temperature and vapor pressure Suction header level Parallel pump run configuration System valve positions
False Alarm Reduction
68% fewer false alarms versus vibration-only detection — process context is the critical differentiator between an alarm system and an actionable detection system

Closed-Loop Setpoint Adjustment: From Detection to Automatic Correction

The value of early cavitation detection is fully realized only when it connects to an automatic correction action — not just an alert waiting for operator intervention. iFactory's closed-loop architecture connects cavitation detection output directly to the plant control system, enabling automatic setpoint adjustments that eliminate the cavitation condition within the 200 ms inference cycle. The following workflow traces the complete detection-to-correction chain at a chemical plant pump deployment.

01

Continuous Multi-Signal Acquisition at Edge Processing Node

iFactory's edge processing node connects to existing plant instrumentation — vibration transmitters, pressure transducers, flow meters, temperature elements, and motor current sensors — via OPC-UA, Modbus, or HART protocol. Signal acquisition runs continuously at configurable scan rates: vibration at 1–10 kHz, pressure at 100–500 Hz, flow and temperature at 1–10 Hz. No new sensors are required in most industrial pump installations.

Sources: OPC-UA + Modbus + HART — No new sensor hardware in most deployments
02

Operating State Classification and Dynamic Baseline Selection

Before every inference cycle, the AI classifies the current operating state — pump speed, flow rate, fluid temperature, and system pressure — and selects the corresponding baseline established during the initial 14 to 21 day calibration period. A pump running at 75% rated speed on 95°F fluid is compared to its own baseline at that state, not to a global average. State-specific baseline selection is the foundation of low false alarm rates in variable-duty pump applications.

Method: Operating State Clustering — Dynamic Baseline per State, Not Global Average
03

Four-Layer Multi-Variate Cavitation Index Calculation

The AI computes a composite Cavitation Index (CI) from the four detection layers — vibration spectral signature, pressure pulsation FFT, current pulsation index, and process context deviation — weighted by each layer's signal quality and the confidence of its contribution to the current operating state. A CI above 0.35 initiates Stage 1 monitoring; above 0.65 triggers a Stage 2 alert; above 0.85 triggers automatic setpoint adjustment. The CI is updated every 200 ms for continuous real-time tracking.

Output: Composite Cavitation Index 0–1.0, updated every 200 ms, with per-layer confidence scores
04

Automatic Setpoint Adjustment via PLC Write-Back

When the CI exceeds the Stage 3 threshold (0.85), the platform automatically writes corrective setpoints to the plant control system: VFD speed reduction (typically 2 to 5% of current speed), suction control valve opening if available, or discharge throttle valve adjustment to shift the operating point back within the allowable operating region. Each adjustment is logged with the CI value, the triggering signal, and the response taken — creating an audit trail of every automated intervention. Manual override is always available and every automation action is configurable by asset class and site policy.

Action: VFD Speed Trim + Valve Adjustment — 200 ms response, configurable per asset
05

CMMS Work Order Generation and Feedback Learning

Every cavitation detection event — whether resolved by automatic setpoint adjustment or escalated to a maintenance response — generates a structured CMMS work order with the pump asset ID, detected failure signature, CI history, recommended inspection scope, and estimated remaining useful life of the impeller based on the detected cavitation intensity and duration. Post-repair findings feed back into the AI model as labeled training data, continuously improving detection accuracy and narrowing the confidence interval on severity estimates at your specific pump fleet.

Output: CMMS Work Order + Model Learning — False Alarm Rate Below 6% by Month 6

See AI Cavitation Detection Running on Your Pump Fleet

iFactory's team demonstrates the complete four-layer detection and closed-loop setpoint adjustment workflow using your pump specifications and process conditions — showing detection lead times and CI thresholds before any hardware commitment.

AI Cavitation Detection vs. Conventional Pump Monitoring: The Performance Gap

The structural difference between AI multi-variate cavitation detection and conventional pump protection — fixed vibration alarms, NPSH alarms, and periodic inspection programs — determines whether developing cavitation becomes a planned impeller inspection or a forced pump outage. The comparison below maps both approaches across the metrics that determine pump reliability and maintenance cost outcomes.

Conventional Pump Monitoring
Detection Method
Fixed vibration/pressure alarms
Detection Lead Time
Hours — alarm fires at established damage
False Alarm Rate
30–45% — process-change false positives
Cavitation Stage Identified
None — alarm only, no stage
Automatic Response
Manual operator action required
Process Context
None — static thresholds
Impeller Replacement Rate
Baseline — driven by undetected cavitation
VS
iFactory AI Cavitation Detection
Detection Method
4-layer multi-variate CI model
Detection Lead Time
8–21 days before damage accumulates
False Alarm Rate
Below 6% — context-integrated
Cavitation Stage Identified
Stage 1–3 with severity score
Automatic Response
VFD trim + valve adjust in 200 ms
Process Context
Full PLC context per inference
Impeller Replacement Rate
91% reduction vs. baseline

Measured Outcomes at Industrial Pump Fleet Deployments

These results reflect verified outcomes from iFactory pump cavitation AI deployments at U.S. water treatment, chemical processing, and heavy manufacturing facilities within the first 18 months of operation.

91%
Impeller Replacement Reduction
Cavitation-related impeller replacements in first 12 months versus pre-deployment baseline at comparable facilities
74%
Unplanned Downtime Reduction
Pump-related unplanned production stoppages after full AI deployment and closed-loop control activation
$340K
Average Annual Savings
Combined impeller replacement avoidance, seal life extension, and unplanned downtime reduction per monitored fleet
3.2×
Mechanical Seal Life Extension
Average seal service life increase from eliminating hydraulic imbalance forces generated by sustained cavitation operation
4–8 mo
Typical Payback Period
Full platform cost recovery at facilities with documented cavitation-related impeller and seal replacement history
<6%
False Alarm Rate at Month 6
After operating state calibration and process context integration — preventing nuisance fatigue that causes operators to ignore legitimate alerts

Ready to model these outcomes against your pump fleet's current impeller replacement history and downtime record? Book a pump fleet ROI assessment with iFactory's fluid systems team.

Expert Review

Expert Perspective

After working with pump cavitation problems across water treatment, chemical, and power generation facilities for sixteen years, the platform selection errors that produce the worst outcomes share one characteristic: they optimize for detection sensitivity without controlling false alarm rate — and the result is an alert system that maintenance teams start ignoring within 90 days. Two checks separate AI cavitation platforms that actually change pump reliability from those that become background noise.

Demand process context integration before evaluating detection sensitivity. Any vibration-based system can be tuned to detect cavitation with high sensitivity. The differentiating capability is whether the system correlates that vibration signal with simultaneous process state — fluid temperature, upstream level, parallel pump configuration — to distinguish genuine cavitation from normal process variation. Ask the vendor to demonstrate their false alarm rate on your specific pump during a process upset event before evaluating their detection rate on a cavitation event.
Require a retrospective validation on your last confirmed impeller failure before deployment. Ask the vendor to ingest your historian data from the 30 days before the failure and demonstrate at what Cavitation Index level and how many days ahead their model would have triggered. If they cannot demonstrate a minimum 7-day lead time with a false alarm rate below 10% on a confirmed past failure at your facility, their models are not calibrated for your operating conditions — and they will not perform reliably in production.
Verify that closed-loop response is configurable — not binary. The best closed-loop cavitation control implementations allow the plant to configure different response tiers by asset criticality: advisory only for non-critical pumps, automatic VFD trim for high-consequence pumps, and automatic standby transfer for fully redundant configurations. A system with only one response mode will either be too aggressive for some applications or too passive for others.
Principal Rotating Equipment Engineer — Fluid Systems 16 Years, 80+ Pump Cavitation Investigations — CMRP Certified, PE Licensed

Conclusion

Pump cavitation is preventable — not because the physics are controllable in every situation, but because the early warning signatures are detectable weeks before impeller damage accumulates to the point of forced replacement. The gap between "detectable" and "detected" is the AI model layer that correlates high-frequency vibration spectra, suction pressure pulsation, motor current signature, and process context into a composite Cavitation Index that rises measurably before any conventional alarm fires. iFactory's pump cavitation AI closes that gap by deploying those models at the plant edge, running inference continuously against state-specific baselines, and triggering automatic setpoint corrections within the 200 ms detection cycle.

The 91% reduction in impeller replacements and 74% reduction in unplanned pump downtime at comparable facilities are the documented result of catching cavitation at Stage 1 severity rather than at the point of forced repair. The platform deploys in 4 to 6 weeks on existing pump instrumentation, establishes reliable baselines within 21 days, and integrates with your CMMS to convert every detection event into a structured maintenance record without manual fault investigation. Book a pump fleet assessment to identify which pumps in your facility carry the highest current cavitation exposure and what the closed-loop response configuration would look like on your control system.

Frequently Asked Questions

iFactory's platform is designed to maximize value from existing instrumentation — most pump installations already have suction and discharge pressure transmitters, flow meters, motor current via the VFD, and temperature elements. For facilities with vibration transmitters already installed, those signals feed directly into the spectral analysis layer. For pumps without installed vibration sensors, the pressure and current analysis layers alone provide meaningful cavitation detection; adding vibration sensors is recommended for high-consequence pumps but is not required for initial deployment. The platform assessment identifies the current sensor coverage and recommends targeted additions where detection gaps justify the sensor investment.
Variable fluid properties are handled through the operating state classification layer. For water treatment applications where fluid temperature varies seasonally by 20 to 40°F, the AI maintains separate operating state baselines for each temperature band — the Cavitation Index threshold that represents genuine incipient cavitation at 45°F source water is different from the threshold at 75°F, because vapor pressure changes the NPSH available margin at each temperature. The system updates baselines continuously as seasonal conditions shift, preventing the false positive rate from rising during seasonal transitions. For facilities with fluid chemistry variability — pH, dissolved solids, entrained air — the platform accepts these parameters as process context inputs that adjust the vapor pressure calculation in real time.
iFactory's cavitation detection models are primarily trained and validated for centrifugal pump applications — single-stage end-suction, double-suction split case, vertical turbine, and multistage high-pressure centrifugal pumps — which represent the highest-consequence cavitation risk category in most industrial applications. For multistage pumps, the detection model accounts for interstage pressure profiles and applies stage-specific NPSH calculations. Positive displacement pumps (reciprocating, gear, screw) experience a related phenomenon called suction cavitation at high flow rates, and a modified detection model is available for these pump types — contact iFactory for PD pump-specific compatibility assessment before scoping.
Yes — closed-loop response tiers are fully configurable per individual pump asset. iFactory supports three response modes that can be assigned independently to each pump: Advisory Only (alert sent to operator dashboard and mobile notification, no automatic action); Semi-Automatic (system proposes a specific setpoint change for one-click operator approval); and Fully Automatic (VFD trim and valve adjustment executed without operator action, logged for review). For boiler feed pumps, cooling water pumps on critical heat exchangers, and other safety-critical services, Advisory or Semi-Automatic mode is typically appropriate. Most facilities configure a mix of modes based on pump criticality and control system authorization policy.
For a 20-pump installation covering centrifugal process pumps in a water treatment or chemical plant environment, iFactory's complete deployment — edge hardware, AI model licensing, closed-loop control integration, CMMS connectivity, and annual software subscription — runs $48,000 to $92,000 depending on sensor availability, control system integration complexity, and pump criticality classification. Against the $340,000 average annual savings at comparable facilities, payback typically occurs within 4 to 8 months. Single-event payback — the first avoided impeller replacement at $18,000 to $45,000 fully loaded cost — is common within the first 6 months. Contact iFactory for a site-specific quote based on your pump register and instrumentation inventory.

AI Pump Cavitation Detection — Protect Every Impeller, Prevent Every Forced Outage

iFactory's four-layer AI cavitation detection platform monitors pressure pulsation, vibration spectra, motor current signature, and process context simultaneously — detecting developing cavitation 8 to 21 days before damage accumulates and automatically adjusting setpoints before the impeller erosion cycle begins.
Share This Story, Choose Your Platform!