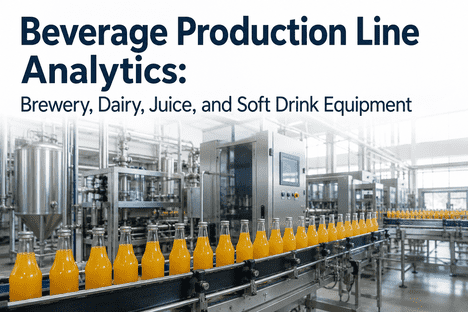
Beverage production line analytics has become the backbone of competitive operations in breweries, dairies, and juice processing facilities. As production demands intensify and regulatory compliance tightens, plant managers who rely on reactive maintenance and manual data collection are losing ground — fast. Modern beverage plant analytics platforms connect pasteurizers, fillers, CIP systems, and carbonation equipment into a single intelligence layer, enabling teams to detect failures before they occur, maximize throughput, and generate audit-ready compliance records automatically. This guide explores how AI-driven analytics is transforming beverage manufacturing operations across the industry. Book a demo to see how your facility can achieve measurable results in under 90 days.
Why Beverage Production Analytics Is No Longer Optional
The beverage manufacturing sector operates at the intersection of food safety regulation, consumer demand volatility, and relentless cost pressure. Breweries managing fermentation cycles, dairies running continuous pasteurization lines, and juice processors handling high-acid product flows all face one shared operational reality: equipment failures don't announce themselves. They accumulate — through micro-vibrations in filler heads, gradual temperature drift in heat exchangers, and incremental pressure loss across carbonation circuits. Facilities deploying brewery analytics and dairy line analytics platforms are documenting 30–40% reductions in maintenance spend, significant OEE gains, and compliance postures that withstand FDA, USDA, and third-party audits without manual documentation overhead. Book a demo to see how the platform maps to your production environment.
Core Equipment Covered by Beverage Plant Analytics
Effective beverage plant analytics must cover the full equipment stack — not just high-value assets. Every component in the production chain contributes to throughput, product quality, and compliance risk. Here is how leading platforms address each critical asset class.
Pasteurizer Analytics for Dairy and Juice Processing
Pasteurizers are the highest-consequence equipment in dairy and juice processing. A temperature deviation event that goes undetected doesn't just risk product quality — it triggers regulatory action, product holds, and potential recalls. Pasteurizer analytics platforms monitor heat exchanger performance in real time, flagging thermal efficiency degradation, flow rate anomalies, and divert valve response lag before they compromise product safety. Continuous CCP monitoring replaces manual temperature log checks, and audit-ready records are generated automatically for every production run.
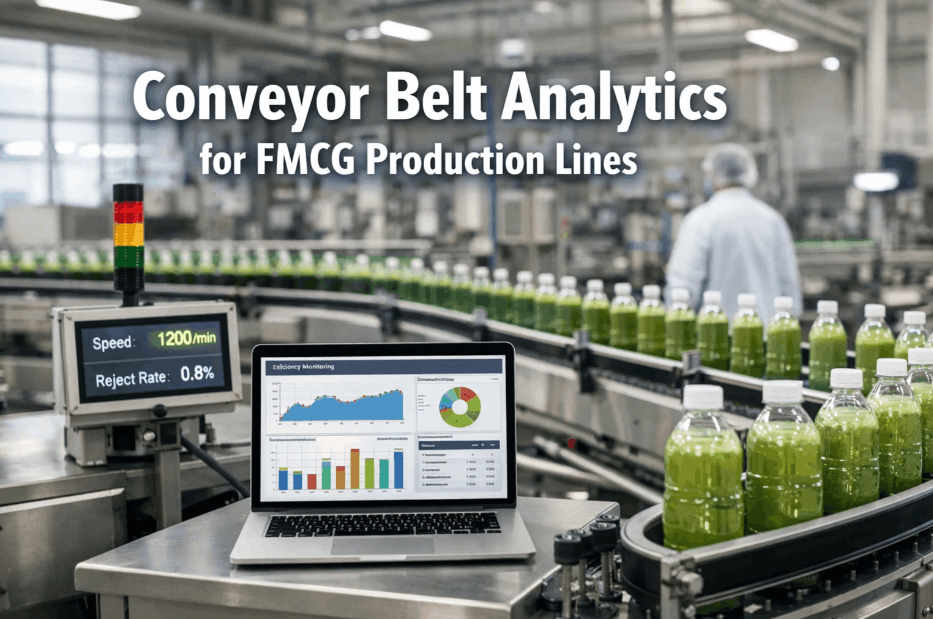
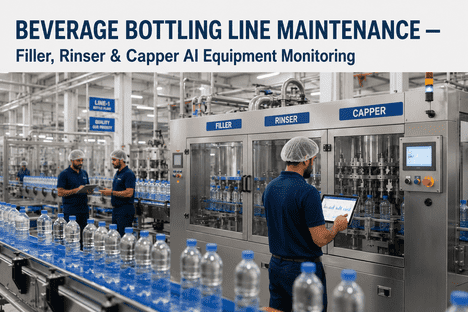
Beverage Filler Analytics: Reducing Waste and Improving Line Efficiency
Filling lines are the throughput bottleneck in most beverage facilities. Beverage filler performance directly determines OEE scores — and filler heads are among the highest-frequency failure points on any production floor. Analytics platforms that monitor fill weight variance, valve cycle timing, and head pressure consistency catch drift patterns that predict seal failures, under-fill events, and changeover inefficiencies. Predictive alerts allow maintenance teams to schedule interventions during planned downtime rather than scrambling during production runs.
CIP Beverage System Monitoring and Compliance Verification
Clean-in-place systems are the invisible compliance engine of every beverage facility. CIP failures — whether from concentration deviations, temperature shortfalls, or inadequate contact time — create microbial risk that isn't visible until a product failure or audit finding surfaces it. CIP beverage analytics platforms monitor every parameter of every CIP cycle in real time, verify completion against defined protocols, and flag deviations before they reach closure. Non-compliant cycles are flagged, documented, and escalated automatically — creating a continuous compliance record without manual log review. Book a demo to see how CIP monitoring integrates with your existing SCADA or PLC infrastructure.
Carbonation Equipment Analytics for Brewery and Soft Drink Lines
Carbonation equipment performance directly affects product consistency and consumer quality perception. CO₂ pressure variance, dissolution rate instability, and inline dissolved oxygen ingress are among the most difficult parameters to track manually at production speed. Analytics platforms that integrate with carbonation skids and inline analyzers detect process drift in real time — enabling immediate correction before product is packaged out of specification. For brewery equipment PM programs, carbonation monitoring data feeds directly into predictive maintenance models that schedule compressor service based on actual performance degradation rather than calendar intervals.
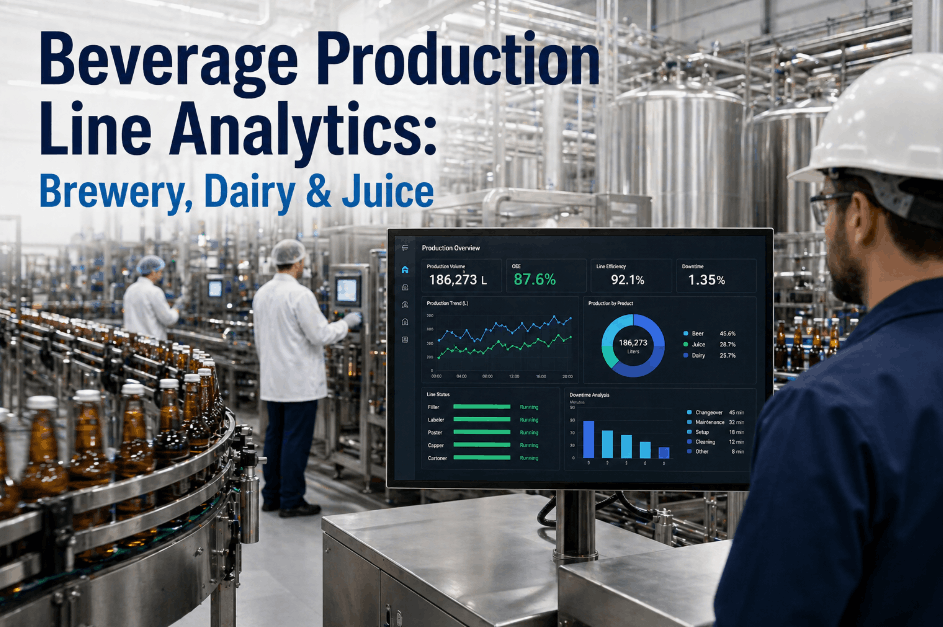
Brewery Analytics: From Fermentation to Packaging
Brewery analytics covers a uniquely complex production environment. Unlike continuous-flow beverage manufacturing, brewing involves batch fermentation cycles that vary by recipe, yeast strain, and seasonal temperature — creating an analytics challenge that requires both equipment monitoring and process intelligence. Leading brewery analytics platforms address this by integrating fermentation vessel monitoring, cellar equipment performance, and packaging line analytics into a unified operations dashboard, with brewery equipment PM programs benefiting from filler, seamer, and labeler performance data that identifies wear patterns and component fatigue before they produce downtime events or quality escapes.
Dairy Line Analytics: Continuous Production, Continuous Compliance
Dairy processing facilities operate under some of the most demanding regulatory and quality requirements in the food industry. HTST pasteurization, UHT processing, separator performance, and homogenizer pressure all require continuous monitoring — and the consequences of monitoring gaps extend from product quality failures to regulatory enforcement action. Dairy line analytics platforms purpose-built for dairy environments address this through deep integration with pasteurizer PLCs, separator sensor arrays, and packaging equipment networks — auto-generating HTST charts, CIP records, and deviation documentation that eliminate the manual documentation burden consuming significant QA team capacity. Book a demo to walk through how dairy-specific compliance documentation is handled within the platform.
Juice Production Analytics: Managing High-Acid Processes and Quality Consistency
Juice production analytics addresses the specific challenges of high-acid product processing: evaporator performance degradation, enzyme inactivation verification, Brix consistency across filling runs, and cold chain integrity from pasteurizer to distribution. These parameters are critical to both product quality and FSMA juice HACCP compliance — and monitoring them manually at production speed is functionally impossible. Analytics platforms integrated with juice processing equipment track evaporator thermal efficiency, inline Brix and pH analyzer performance, and filler temperature consistency, with each month of operation adding facility-specific calibration data that improves anomaly detection accuracy and sharpens the predictive maintenance models driving proactive intervention scheduling.
Key Features of a High-Performance Beverage Production Analytics Platform
Not all analytics platforms are built for the operational complexity of beverage manufacturing. When evaluating beverage production analytics solutions, these are the capabilities that separate operational-grade platforms from generic monitoring tools.
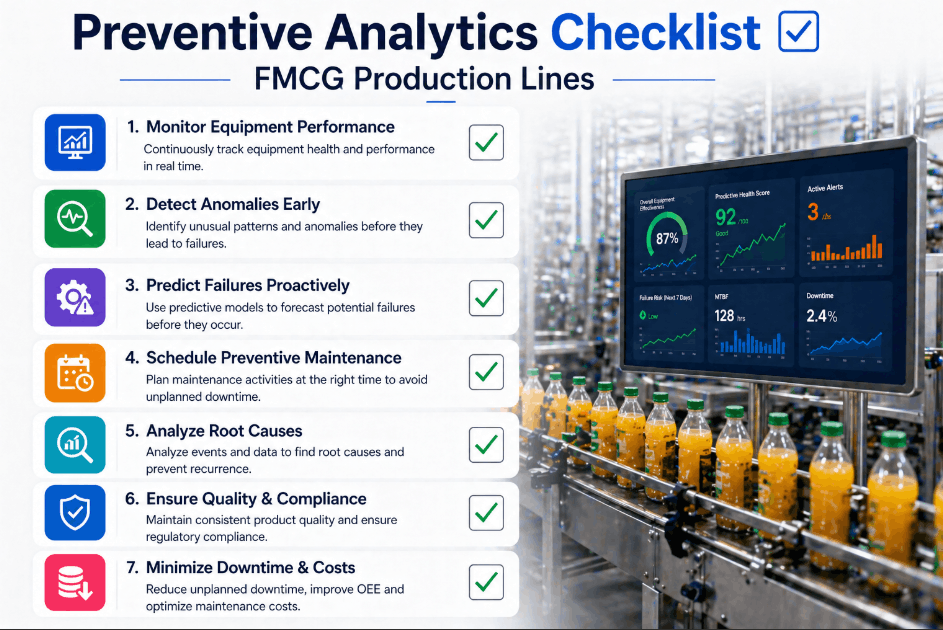
Continuous sensor data ingestion from pasteurizers, fillers, CIP systems, carbonation skids, and packaging equipment — with anomaly detection that flags deviation patterns before failures occur.
Machine learning models trained on facility-specific failure history predict component degradation timelines and auto-generate work orders that align maintenance with planned downtime windows.
Every CIP cycle is monitored against protocol parameters in real time. Non-conforming cycles are flagged and documented automatically — creating a continuous compliance record without manual review.
Overall Equipment Effectiveness scores calculated continuously across all production lines, with root cause attribution for every downtime event and trend analysis that identifies recurring failure points.
FDA, USDA, SQF, and customer-specific audit documentation generated on demand — including HTST charts, CCP records, CIP logs, and deviation histories with complete corrective action closure documentation.
Enterprise-level visibility across all production lines and plant locations — with role-based access controls, shift-level reporting, and executive KPI dashboards that connect operational performance to business outcomes.
Implementation Timeline: From Deployment to Full Analytics Coverage
Beverage facilities evaluating beverage production analytics platforms consistently ask the same question: how long before we see results? The answer depends on facility complexity and deployment scope — but structured implementation programs deliver measurable outcomes from the first phase.
- Sensor integration commissioned on priority equipment
- Real-time equipment health monitoring activated
- Initial OEE baseline established per production line
- QA team onboarded in under 8 hours
- Automated CIP compliance verification activated
- Predictive maintenance models initialized
- Corrective action workflows deployed across all deviation categories
- First unplanned downtime events prevented
- Analytics extended to all production lines and shifts
- Audit package auto-generation activated
- OEE improvement targets confirmed against baseline
- Predictive models refined with facility-specific failure data
- Documented OEE gains and downtime reduction reported
- Maintenance spend reduction quantified
- Clean regulatory audit posture verified
- Analytics accuracy improving continuously with operational data
Beverage Analytics ROI: Before and After Deployment
The operational and financial impact of beverage production analytics is measurable across every key performance category. The table below reflects documented outcomes from facilities that have deployed integrated analytics platforms across brewery, dairy, and juice processing environments.
| Performance Metric | Before Analytics | After Deployment | Improvement |
|---|---|---|---|
| Unplanned Downtime Events / Month | 8–12 events | 2–3 events | ~72% reduction |
| OEE Score (Production Lines) | 54–61% | 72–85% | +28–38% improvement |
| CIP Compliance Verification | Manual log review | Real-time auto-verification | 100% automated |
| Regulatory Audit Preparation Time | 3–5 days | Under 30 minutes | -95% |
| Mean Time to Detect Equipment Anomaly | Post-failure identification | 3–14 days before failure | Proactive detection |
| Maintenance Cost per Production Line / Year | Baseline | 30–40% reduction documented | Significant savings |
| QA Documentation Hours / Week | ~18–25 hours | ~5–7 hours | ~70% reduction |
Choosing the Right Beverage Analytics Platform for Your Facility
The beverage production analytics market includes a wide range of platforms — from generic industrial IoT monitoring tools to purpose-built food and beverage compliance systems. Juice plant analytics and dairy equipment analytics platforms purpose-built for food processing environments integrate equipment monitoring with CCP verification, automated corrective action workflows, and regulatory documentation generation — creating a unified compliance and operations platform. When evaluating, prioritize native integration with beverage industry equipment protocols, automated audit documentation generation, and a deployment model that does not require production interruption. Book a demo to see how ifactory's beverage-specific platform accelerates time to value.

![fmcg-production-line-preventive-analytics-[complete-guide]](./manage-post-2k26/uploads/fmcg-production-line-preventive-analytics-[complete-guide].png)