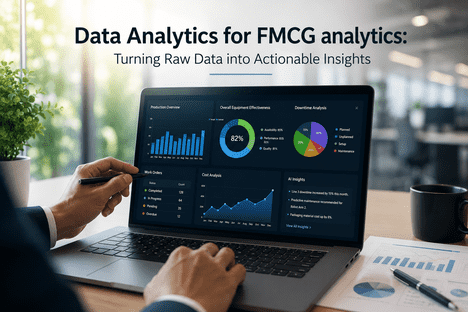
FMCG manufacturing plants generate terabytes of data every day work order histories from maintenance execution, time-series sensor readings from production lines, robot performance metrics from automated packaging cells, quality inspection results from every batch, and cost data from every production run. Yet the vast majority of FMCG plants use less than 10% of this data for decision-making. Spreadsheets, tribal knowledge, and reactive firefighting remain the primary tools for plant performance management, while the data that could predict failures, optimize schedules, and reduce costs sits unused in historians, CMMS databases, and ERP systems. iFactory Analytics Dashboard and AI Insights platform bridges this gap — connecting to every data source in the FMCG plant, applying machine learning models to detect patterns no human can see, and delivering actionable recommendations directly to the maintenance planner, production manager, and plant engineer. Book a Demo to see how iFactory transforms raw FMCG plant data into decisions that improve OEE by 12–18% and reduce maintenance costs by 20–35% within the first six months of deployment.
Work Order Analytics From Reactive History to Predictive Intelligence
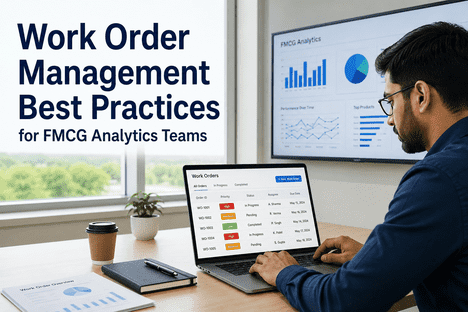
Every work order in an FMCG plant tells a story the filler machine that jammed three times last shift, the packaging robot that drifted out of alignment over six weeks, the conveyor bearing that failed at 11:47 PM on a Saturday. But when work orders exist only as individual records in a CMMS database, the patterns that connect those stories remain invisible. iFactory's Work Order Analytics module aggregates work order history across all FMCG production lines, applies natural language processing to extract failure modes from technician notes, and correlates work order patterns with production data, sensor readings, and shift schedules to identify root causes that span multiple data domains.
The impact of work order analytics on FMCG maintenance operations is measurable and consistent. Plants that deploy iFactory's Work Order Analytics typically see a 40–55% reduction in corrective maintenance work orders within 12 months as repeating failure patterns are identified and eliminated at the root cause. Mean time between failures for critical FMCG assets increases by 35–60% as the platform identifies the specific operating conditions, ingredient formulations, or packaging material specifications that correlate with premature asset failure. The platform automatically generates failure mode dashboards that rank the most frequent, most costly, and most safety-critical failure patterns across the plant, enabling maintenance and reliability teams to focus their continuous improvement efforts on the 20% of failure modes that cause 80% of production losses. Book a Demo to see how iFactory Work Order Analytics can transform your FMCG plant's maintenance data into a predictive reliability engine.
Sensor Data Analysis — Converting Time-Series Noise into Actionable Signals
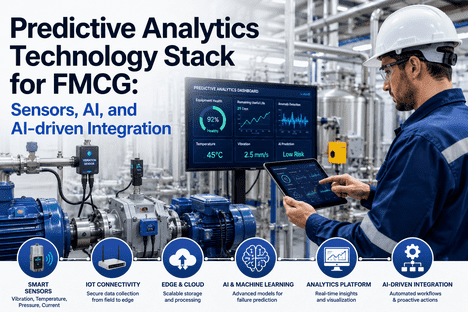
An FMCG production line generates sensor data at intervals ranging from milliseconds (vibration monitoring on high-speed fillers) to minutes (temperature profiles across baking ovens) to hours (energy consumption across production shifts). The volume and velocity of this data make it impossible for human analysts to identify the subtle patterns that precede equipment failure or quality deviation. iFactory's Sensor Data Analysis engine ingests time-series data from every sensor type in the FMCG plant — vibration, temperature, pressure, flow, current, torque, speed, and position — and applies machine learning models that learn the normal operating envelope for each asset under every product recipe and production speed combination.
When sensor readings deviate from the learned normal envelope, iFactory's AI Insights engine generates actionable alerts that specify not just what is wrong, but what is likely causing the deviation and what corrective action is recommended. For example, the platform can detect that a horizontal form-fill-seal machine's sealing jaw temperature profile is trending toward the upper control limit specifically during the production of a high-fat-content product at line speeds above 120 packs per minute — and recommend a preventive intervention before the seal quality drifts out of specification. This level of sensor data analysis transforms the FMCG plant from a reactive operation that responds to failures after they occur to a predictive operation that intervenes at the optimal moment — maximizing asset utilization while minimizing maintenance cost and quality risk.
Robot Performance Analytics Maximizing Automation ROI in FMCG Lines
Modern FMCG plants deploy robots across every stage of production palletizing, case packing, pick-and-place, carton forming, and end-of-line automation. Each robot generates performance data including cycle times, pick success rates, gripper engagement forces, joint positions, motor currents, and fault codes. But most FMCG plants monitor robots only at the aggregate level — overall robot uptime and total cycle count missing the granular performance trends that indicate impending degradation. iFactory's Robot Performance Analytics module ingests robot controller data from every automation cell in the FMCG plant and applies machine learning models that detect performance degradation patterns weeks before they cause a stoppage.
The platform tracks robot performance metrics at the individual axis and gripper level, detecting trends such as increasing joint friction in a palletizing robot's wrist axis, declining gripper engagement force in a case packer, or increasing cycle time variance in a pick-and-place robot that signals bearing wear. When a robot performance metric crosses the configured threshold, the AI Insights engine generates a diagnostic alert with the probable root cause, the recommended corrective action, and the optimal intervention window based on production schedule and spare parts availability. FMCG plants using iFactory Robot Performance Analytics report a 50–70% reduction in unplanned robot downtime and a 15–25% increase in robot throughput as performance-optimizing adjustments identified by the platform are implemented during planned maintenance windows. Book a Demo to see iFactory Robot Performance Analytics configured for your FMCG automation lines.
Cost Analytics — Connecting Maintenance Spend to Production Value
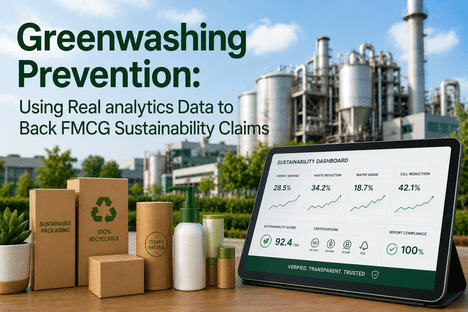
In most FMCG plants, maintenance cost data lives in the ERP system, work order data lives in the CMMS, and production data lives in the manufacturing execution system. These systems do not talk to each other in a way that enables plant leadership to answer the most important cost question: Are we spending the right amount on the right assets at the right time? iFactory's Cost Analytics module bridges these data silos, connecting maintenance spend data from the ERP with work order history from the CMMS and production output data from the MES to create a complete cost-per-unit picture at the asset, line, and plant level.
The platform automatically calculates maintenance cost per production unit for every asset in the FMCG plant, normalized by product type and production speed to enable apple-to-apple comparison across different operating conditions. Assets with maintenance costs that exceed the statistical threshold for their asset class and operating context are flagged for reliability review — enabling plant leadership to identify the specific assets where reliability improvement investment will deliver the highest return. The Cost Analytics module also tracks the cost impact of maintenance strategies — comparing the total cost of reactive, preventive, and predictive maintenance approaches for each asset class — and recommends the optimal maintenance strategy mix that minimizes total cost of ownership while maintaining production reliability targets.
AI-Driven Reporting From Static Reports to Intelligent Recommendations
Traditional analytics reporting in FMCG plants follows a predictable pattern: someone in the plant or corporate engineering team spends 10–20 hours per week pulling data from multiple systems, building Excel reports, and distributing them via email — and by the time the report reaches the decision-maker, the data is 2–7 days old and the decisions it could inform have already been made. iFactory's AI-Driven Reporting module eliminates this cycle entirely. The platform continuously ingests data from every connected source and generates exception-based reports that surface only the situations requiring human attention — an asset whose failure probability has crossed the alert threshold, a production line whose OEE trend is declining for the third consecutive shift, or a maintenance strategy whose cost per unit is exceeding the budget target.
The AI Insights engine goes beyond exception reporting to generate prescriptive recommendations — specific actions that plant personnel should take, prioritized by their impact on production output, maintenance cost, and quality performance. For example, the platform might recommend: "Postpone the preventive overhaul scheduled for the case packer on Line 3 from next Tuesday to next Thursday based on current condition indicators, and instead advance the filler valve inspection on Line 1 to Tuesday based on early-stage degradation detected in the fill weight trend." These AI-generated recommendations are linked to the specific data that triggered them, enabling plant personnel to review the evidence, accept or modify the recommendation, and track the impact of their decision on the next analytics report. Book a Demo to see how iFactory's AI-driven reporting can eliminate manual report generation and deliver actionable intelligence directly to every role in your FMCG plant.
Predictive Analytics Analytics From OEM Recommendations to Asset-Specific Models
Equipment manufacturers provide general preventive maintenance guidelines — change the oil every 2,000 hours, replace the belt every 6 months, overhaul the gearbox every 5 years — based on average operating conditions that rarely match the actual conditions in an FMCG plant. A packaging line producing high-moisture products at 95°F ambient temperature has fundamentally different failure mechanisms than the same line producing dry products in a climate-controlled facility. iFactory's Predictive Analytics module replaces OEM-generic maintenance intervals with asset-specific prediction models that learn from each asset's actual operating history, sensor data, and failure patterns.
The platform's machine learning models are trained on each asset's historical data — combining work order failure records, sensor readings leading up to past failures, production data at the time of failure, and quality inspection results — to predict remaining useful life with precision that improves over time as more data is collected. Unlike generic predictive models that trigger alerts only when sensor readings exceed fixed thresholds, iFactory's models learn the interaction between multiple variables — understanding, for example, that a specific combination of vibration amplitude increase, temperature gradient change, and product recipe switch predicts bearing failure on a vertical form-fill-seal machine with 94% accuracy at 72–96 hours before failure occurs. This predictive capability enables FMCG plants to replace the right component on the right asset at the right time — eliminating unnecessary preventive maintenance while preventing unplanned failures.
Analytics Trend Analysis Visualizing FMCG Performance Across Time, Line, and Shift
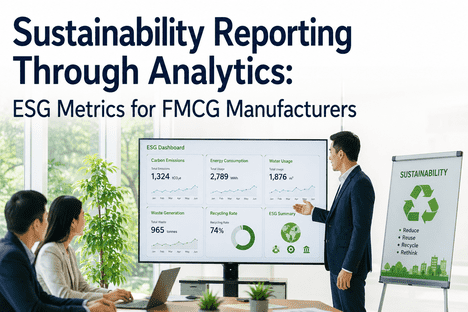
Trend analysis in FMCG plants requires comparing performance across multiple dimensions — time (shift-over-shift, day-over-day, week-over-week), line (which lines perform best under which conditions), product (which SKUs are associated with higher downtime or quality loss), and shift (which crews achieve the best OEE). Traditional BI dashboards provide static views of these dimensions individually, but the insights emerge at the intersection — understanding, for example, that the night shift on Line 5 achieves 8% higher OEE when running low-sugar products on high-humidity days. iFactory Analytics Dashboard provides interactive trend analysis that enables plant personnel to explore performance data across all dimensions simultaneously, with AI-powered correlation detection that surfaces the statistically significant relationships hidden in the data.
The trend analysis engine automatically generates weekly and monthly performance summaries that highlight the most important changes in plant performance — the line whose OEE has declined for three consecutive weeks and the most likely root cause, the asset whose vibration trend has shifted above its normal envelope and the recommended intervention, or the maintenance strategy whose cost per unit is trending upward and the alternative approach that would reduce it. These trend summaries are delivered through the iFactory Analytics Dashboard and can be configured for automated email distribution to plant leadership, eliminating the need for manual report generation while ensuring that every decision-maker has access to the most current intelligence about plant performance. Book a Demo to see iFactory Analytics Dashboard configured for your FMCG plant's performance data.
Analytics BI Dashboard Role-Specific Intelligence for Every Decision in the FMCG Plant
Different roles in an FMCG plant need different analytics the maintenance planner needs to know which assets are approaching their failure probability threshold and which parts are needed for the recommended interventions, the production manager needs to know which lines are at risk of missing the daily production target and what corrective actions have been taken, the plant engineer needs to know which failure modes are driving the highest maintenance cost and whether reliability improvement projects are delivering the expected ROI, and the plant manager needs to know whether the plant is on track to meet its monthly OEE, cost-per-unit, and quality targets. iFactory Analytics BI Dashboard provides role-specific views into the same unified data model, ensuring that every decision-maker sees the intelligence most relevant to their responsibilities.
The platform's BI dashboards are not static report pages they are interactive analytics environments that enable users to drill from a high-level plant performance summary down to the individual sensor reading or work order record that contributed to the aggregate metric. A plant manager reviewing the weekly OEE dashboard can click on a line that is underperforming to see the specific downtime events, then click on a specific downtime event to see the work order details, the technician notes, and the sensor data leading up to the failure all within the same dashboard, without switching between systems. This unified analytics experience eliminates the data fragmentation that has historically prevented FMCG plants from connecting the dots between maintenance activity, production performance, and financial outcomes. Book a Demo to configure iFactory Analytics BI Dashboard for your role and your FMCG plant's performance metrics.
Data-Driven Decisions FMCG The Analytics Maturity Model for FMCG Plants
iFactory's analytics platform is designed to support FMCG plants at every stage of analytics maturity — from the plant that has never connected its CMMS data to its production data to the plant that has deployed multiple data systems and needs a unified analytics layer to extract intelligence from the data they already collect. The platform's analytics maturity model defines five stages: descriptive (what happened), diagnostic (why it happened), predictive (what will happen), prescriptive (what should we do about it), and autonomous (the system takes action automatically within defined boundaries). iFactory Analytics Dashboard supports all five stages, enabling FMCG plants to progress from basic reporting to autonomous decision-making at their own pace, with each stage delivering measurable value that funds the investment in the next stage.
The transition from descriptive to diagnostic analytics alone typically delivers $200,000–$500,000 in annual value for a mid-size FMCG plant by identifying the root causes of the most frequent and most costly failure modes. The transition from diagnostic to predictive analytics typically adds another $300,000–$800,000 in annual value by eliminating unplanned downtime on the assets where failure prediction is most impactful. And the transition from predictive to prescriptive analytics delivers the highest return — $500,000–$1.5 million in annual value — by optimizing maintenance timing, resource allocation, and spare parts inventory across the entire plant based on AI-generated recommendations. iFactory's platform is the only analytics solution purpose-built for FMCG manufacturing that covers the full analytics maturity spectrum in a single, integrated platform.
Frequently Asked Questions: FMCG Data Analytics and AI-Driven Insights
Typical deployment timeline for iFactory Analytics Dashboard in an FMCG plant is 6–10 weeks from project kickoff to go-live. The deployment process includes data source identification and connection (weeks 1–2), data model configuration and historical data ingestion (weeks 3–4), machine learning model training and validation (weeks 5–6), dashboard configuration and role-based access setup (week 7), user training and acceptance testing (week 8), and go-live with post-deployment support (weeks 9–10). The platform is designed for rapid deployment with pre-built connectors for major CMMS, ERP, PLC, historian, and quality system platforms commonly used in FMCG manufacturing. Book a Demo to discuss your plant's specific deployment timeline during the consultation.
iFactory Analytics Dashboard integrates with over 50 data source types commonly found in FMCG plants, including CMMS platforms (SAP PM, Maximo, Infor EAM, WorkTech, UpKeep), ERP systems (SAP S/4HANA, Oracle EBS, Microsoft Dynamics 365, IFS), PLC and SCADA platforms (Siemens, Rockwell, Wonderware, Ignition, GE iFIX), sensor historians (OSIsoft PI, Canary Labs, GE Historian, AspenTech IP.21), quality management systems (Sparta Systems, ETQ, Qualio, MasterControl), robot controllers (ABB, Fanuc, KUKA, Yaskawa, Universal Robots), and energy management systems. Custom API connectors can be developed for any data source with a documented API within 2–4 weeks.
No. iFactory Analytics Dashboard is a software-only platform that connects to data sources already present in the FMCG plant — existing CMMS databases, ERP systems, PLC networks, sensor historians, robot controllers, and quality management platforms. The platform does not require installation of additional sensors, hardware, or edge devices. For FMCG plants that do not have sensor data collection infrastructure in place, iFactory offers a complementary sensor integration package that includes wireless vibration, temperature, and current sensors that can be installed during a planned maintenance window without production interruption.
iFactory Analytics Dashboard delivers measurable ROI within the first 90 days of deployment. The initial value comes from descriptive and diagnostic analytics that identify the highest-impact failure modes and improvement opportunities — typically delivering $50,000–$150,000 in value from avoided failures and optimized maintenance planning within the first quarter. By months 4–6, predictive analytics models begin generating actionable failure predictions that further reduce unplanned downtime, adding another $75,000–$200,000 in quarterly value. The full ROI — including prescriptive analytics and AI-generated recommendations — typically results in the platform paying for itself within 4–6 months and delivering 5–8x annual return on investment thereafter. Book a Demo for a detailed ROI assessment based on your FMCG plant's specific production data, maintenance spend, and performance targets.
Conclusion: The FMCG Plant of the Future Runs on Analytics, Not Intuition
The FMCG plants that will lead the industry in OEE, cost efficiency, and quality performance over the next decade will be those that have mastered the transition from data-rich, insight-poor operations to data-driven, AI-powered decision-making. The technology to transform raw plant data into actionable insights exists today — machine learning models that predict equipment failure before it happens, analytics dashboards that connect maintenance data with production data and cost data in a single view, and AI systems that generate prescriptive recommendations optimized for each plant's unique operating conditions. The difference between FMCG plants that capture this value and those that do not is not technology availability — it is the decision to deploy an integrated analytics platform that connects every data source, serves every decision-maker, and continuously improves as more data is collected.
iFactory Analytics Dashboard and AI Insights platform provides the fastest path to data-driven FMCG operations — pre-built connectors for the systems already in your plant, machine learning models trained on FMCG-specific failure patterns, role-specific dashboards that serve every decision from the control room to the boardroom, and a deployment methodology that delivers measurable value in the first 90 days. For FMCG plant maintenance, reliability, and operations leaders who are ready to turn their plant's data into a competitive advantage, iFactory's analytics engineering team is available for a no-obligation demonstration. Book a demonstration with iFactory's FMCG analytics team to review your current data landscape and build a deployment roadmap for the platform.