Sustainability Reporting Through analytics: ESG Metrics for FMCG Manufacturers
By Seren on June 18, 2026
Every FMCG sustainability manager knows the reporting tension. The plant has invested in energy meters, water flow sensors, and waste tracking systems that generate thousands of data points every hour. The corporate sustainability team has set net-zero targets for 2035, water reduction goals of 30 percent per tonne of production, and zero-waste-to-landfill commitments that require monthly progress tracking. But the data required for ESG reporting energy consumption by production line, water usage by shift, waste diversion rates by waste stream, Scope 1 and Scope 2 emissions by fuel type is scattered across utility bills, manual meter readings, production logs, and waste disposal manifests that are never reconciled with the operational data the plant already collects. The consequence is a credibility gap: FMCG manufacturers report sustainability metrics using manual data aggregation methods that produce results with a 15 to 25 percent error margin, and when the auditor, regulator, or customer asks for the source data behind a reported number, the plant cannot trace it back to the production shift, equipment unit, or material batch that generated it. iFactory AI's Energy and Sustainability Tracking module closes this gap by connecting operational analytics data energy consumption, water usage, waste generation, emissions directly to ESG reporting frameworks, generating audit-ready sustainability reports from the same data stream that drives production monitoring, maintenance scheduling, and quality control decisions. Book a Demo to see how iFactory AI's sustainability tracking platform generates audit-ready ESG reports from your FMCG plant's operational analytics data.
Energy Tracking · Water Monitoring · Waste Analytics · Emissions Reporting · ESG Dashboard
ESG Reports Built from Operational Data Not Manual Spreadsheets. The Same Analytics Stream That Tracks Production Efficiency Should Generate Your Sustainability Metrics Without Duplicate Effort.
iFactory's Energy and Sustainability Tracking platform connects production-line energy meters, water flow sensors, waste tracking systems, and emissions monitoring to GRI, SASB, and CDP reporting frameworks — generating audit-ready sustainability reports from operational data without manual aggregation or spreadsheet reconciliation.
Error margin in ESG metrics when FMCG manufacturers rely on manual data aggregation from utility bills, meter reading forms, and waste manifests instead of automated operational analytics
3–5 Days
Person-days per reporting cycle spent manually collecting, reconciling, and formatting ESG data from disparate sources — time that adds zero accuracy to the reported metrics
30–40%
Energy reduction opportunities identified within the first year when production-line energy data is analysed at equipment level rather than aggregated at facility level using monthly utility bills
60–80%
Reduction in ESG report preparation time when sustainability metrics are generated automatically from operational analytics data streams rather than compiled manually from disconnected sources
The Three Sustainability Data Gaps That Analytics-Driven ESG Reporting Resolves
Every FMCG manufacturer that has committed to ESG reporting targets encounters the same three data gaps that undermine the credibility, timeliness, and operational value of sustainability reporting. Analytics-driven ESG reporting is designed to close each one without adding dedicated sustainability data collection infrastructure that duplicates existing operational monitoring.
The Three Data Gaps in FMCG ESG Reporting — and What Analytics-Driven Reporting Does to Each
Data Granularity Gap — Facility-Level Aggregation Hides Equipment-Level Performance
Most FMCG plants report energy consumption, water usage, and waste generation at the facility level — total kWh per month, total kilolitres per quarter, total tonnes of waste per year. This aggregation masks the performance of individual production lines, equipment units, and shifts. A facility-level energy intensity of 0.8 kWh per kg of product may look acceptable, but when analysed at the production-line level, Line 3 — an ageing aseptic filler with a failing steam trap — consumes 1.6 kWh per kg while the other three lines operate at 0.55 kWh per kg. The facility-level number hides the Line 3 problem because the other lines compensate. Analytics-driven ESG reporting breaks sustainability metrics down to the equipment level, shift level, and product SKU level — so that the facility-level number is the sum of verifiable, traceable component metrics, not an opaque aggregate that conceals poor performers.
ESG impact: Equipment-level energy variance of 2:1 or higher on the same product type within the same facility is invisible to facility-level reporting
Data Timeliness Gap — Quarterly and Annual Reporting Cannot Drive Real-Time Operational Action
ESG reporting cycles — quarterly for CDP and GRI, annually for SASB and TCFD — operate on a cadence that is disconnected from the operational decisions that actually determine sustainability performance. A water leak that increases the plant's water intensity by 40 percent for a full production shift is detected by the flow meter in real time but is not reflected in the monthly water report until the utility bill arrives 45 days later. By that time, the leak has consumed 14,000 additional kilolitres, the maintenance team has not been alerted because no one was watching the flow data at the equipment level, and the ESG report for the quarter will show a water intensity spike that the sustainability manager cannot explain or trace to a root cause. Analytics-driven ESG reporting bridges this gap by running sustainability metrics at the same cadence as operational data — real-time for critical metrics (energy intensity, water flow, effluent quality), daily for batch-level metrics (waste generation per SKU, material yield per shift), and weekly for trend-based metrics (carbon intensity trajectory, energy reduction programme progress).
ESG impact: Water leaks, steam trap failures, and compressed air losses persist for 30-60 days before detection in monthly reporting cycles
Data Traceability Gap — Reported Numbers Cannot Be Audited Back to Source Operations Data
When an ESG auditor, regulatory inspector, or customer sustainability team asks for the source data behind a reported sustainability metric — for example, "Show us the energy consumption data for production Line 2 during May that produced your reported Scope 2 emissions for that period" — the typical FMCG manufacturer cannot produce a direct data trace. The reported number came from a utility bill that covers the entire facility, not a specific line. The allocation methodology (square footage, headcount, or production volume) is documented in a spreadsheet that may or may not match the current production configuration. The auditor flags the allocation as an uncertainty factor, and the reported emissions number carries a qualification that reduces its credibility with customers and investors. Analytics-driven ESG reporting assigns every sustainability data point to a specific production asset, shift, batch, and time stamp at the point of generation — creating a traceability chain from the reported ESG metric back to the operational data source without allocation estimates or manual reconciliation.
ESG impact: Utility-bill-based allocation creates 15-25 percent uncertainty in Scope 2 emissions reporting for multi-line FMCG facilities
How Analytics-Driven ESG Reporting Works in an FMCG Manufacturing Plant
The architecture of analytics-driven ESG reporting for FMCG manufacturing is built on three capabilities that manual sustainability reporting processes cannot provide: automated data ingestion from operational sources, sustainability metric calculation aligned to reporting frameworks, and audit-ready traceability from reported number to source data point.
Capability A
Automated Data Ingestion and Normalisation
Connecting operational data sources to ESG metrics without manual data entry
The platform ingests sustainability-relevant data from the same operational sources the plant already uses for production monitoring and maintenance management: energy meters (electricity, natural gas, steam, compressed air) connected via Modbus, OPC-UA, or MQTT protocols; water meters at the facility inlet, production line, and effluent discharge points; waste tracking data from the CMMS or Shift Logbook where waste generation events are logged by material type, disposal method, and waste stream category; and emissions data from continuous emissions monitoring systems, fuel consumption records, and refrigerant make-up logs. Each data point is normalised to a standard unit and time stamp at the point of ingestion, eliminating the unit conversion errors, time zone mismatches, and data format inconsistencies that plague manual ESG data compilation.
For FMCG plants that do not yet have sub-metering at the production-line or equipment level, the platform supports virtual metering — using equipment runtime, load factor, and OEM-rated power consumption to estimate energy use by equipment until physical meters are installed. The virtual metering model is calibrated against the facility-level meter and updated monthly to maintain accuracy within 5 percent of measured values, providing an intermediate data source that enables equipment-level ESG reporting without waiting for the sub-metering capital project to be approved and installed.
Capability B
Framework-Aligned Metric Calculation
Sustainability metrics calculated to GRI, SASB, CDP, and TCFD standards automatically
Raw operational data — kWh consumed, kilolitres discharged, tonnes of waste generated — is not an ESG metric until it has been calculated against the reporting framework's specific methodology. The platform pre-configures metric calculations for the frameworks most commonly used by FMCG manufacturers: GRI 302 (energy), GRI 303 (water and effluents), GRI 305 (emissions), GRI 306 (waste), SASB FB-PF (processed foods) and SASB FB-NB (non-alcoholic beverages), CDP Climate Change and Water Security questionnaires, and TCFD-aligned climate risk disclosures. Each metric is calculated automatically from the ingested data using the framework's methodology — Scope 1 emissions from natural gas and refrigerant consumption with the applicable emission factors (EPA, IPCC, or DEFRA, configurable by region), Scope 2 emissions from purchased electricity and steam using location-based or market-based methods, water withdrawal by source type and discharge by receiving water body, and waste diversion rate calculated by disposal method and material stream.
Metric calculations are versioned and logged with the emission factor source and calculation date, so the same data set can produce reports under different framework versions (for example, GRI 303:2018 vs GRI 303:2025) without manual recalculation. When the sustainability manager needs to update a metric for a new reporting standard or a correction to an emission factor, the platform recalculates the entire affected data series from the same source data — preserving the traceability chain from reported number to operational data point.
Capability C
Audit-Ready Traceability and Report Generation
Every reported number links directly to its source operational data point
The traceability architecture assigns every sustainability metric to a specific data lineage record that documents the source data points, the calculation methodology, the emission factors used, and the time stamp range covered by the metric. When the ESG report is generated — either as an automated export to the sustainability reporting system (Workiva, Persefoni, Salesforce Net Zero Cloud) or as a PDF report in the corporate template — each reported number carries a link to its data lineage. The sustainability manager, auditor, or customer sustainability reviewer can click any reported metric and see the underlying data set: the specific energy meter readings for each hour of the reporting period, the emission factor applied to each fuel type, the allocation methodology (if applicable) and the basis for that allocation, and the production volume denominator used to calculate intensity metrics.
For FMCG manufacturers subject to the EU Corporate Sustainability Reporting Directive (CSRD) or the SEC climate disclosure rule, this traceability architecture directly satisfies the requirement for auditable sustainability data. The platform generates the complete data lineage as an exportable audit package in the format required by the reporting framework — eliminating the 3 to 5 person-days per reporting cycle that manual data compilation consumes and replacing it with automated generation that requires only the sustainability manager's review and sign-off before submission.
GRI · SASB · CDP · TCFD · CSRD · SEC
ESG Reporting Should Be an Output of Operational Analytics — Not a Separate Data Collection Process. The Same Platform That Tracks OEE and Maintenance Should Generate Your Sustainability Metrics.
iFactory's Energy and Sustainability Tracking platform — automated data ingestion from production-line meters and sensors, framework-aligned metric calculation for GRI, SASB, CDP, and TCFD, and auditable traceability from every reported number back to the source data point — eliminating manual ESG data compilation for FMCG manufacturers.
The Sustainability Manager's Dashboard: ESG Metrics View
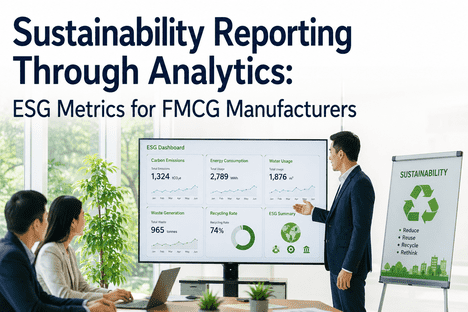
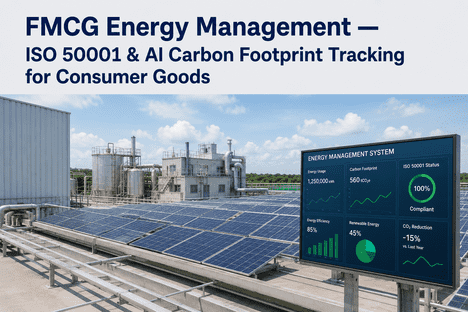
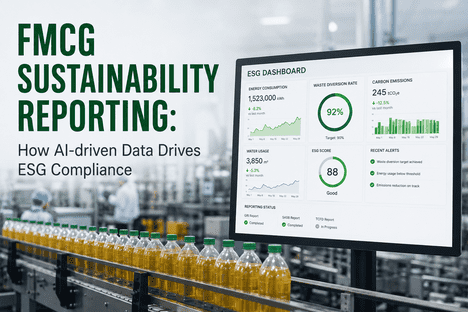
The sustainability manager's dashboard presents ESG metrics — energy intensity, water intensity, waste diversion rate, Scope 1 and Scope 2 emissions — alongside the production data that drives operational decisions. The sustainability view is integrated into the same iFactory analytics interface the plant uses for OEE, maintenance, and production monitoring — eliminating the separate sustainability reporting tool that would require duplicate data entry and reconciliation.
Dashboard View 01
Live Energy and Water Intensity — By Production Line and Shift
Energy intensity (kWh per tonne of product) and water intensity (kilolitres per tonne of product) are displayed as live metrics for each production line, updated at the same frequency as the meter data — typically every 15 minutes for production-line sub-meters and every hour for facility-level meters. The sustainability manager sees whether each line is operating within its target intensity range or whether a deviation requires investigation. The intensity metric is calculated against the current production rate and product SKU, so a change in intensity can be immediately correlated with a change in production conditions — a line running at reduced speed for a rush order will show higher intensity per tonne, and the dashboard reveals whether the intensity increase is legitimate (caused by lower throughput) or indicates an actual energy or water efficiency problem (failing steam trap, leaking valve, plugged nozzle). Intensity trends are displayed as a 24-hour, 7-day, and 30-day moving average so the manager sees both short-term deviations and long-term trajectory.
ESG action enabled: Equipment-level intensity deviation detected within 15 minutes. Root cause investigation initiated before the deviation compounds across multiple production shifts.
Dashboard View 02
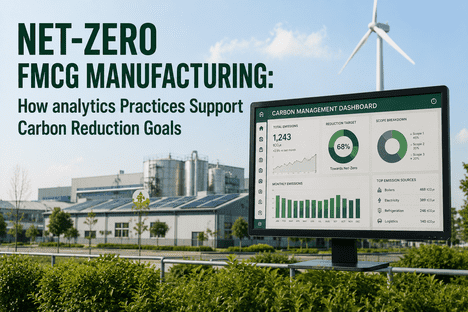
Scope 1 and Scope 2 Emissions Tracking — Real-Time and Cumulative
Scope 1 emissions from natural gas combustion in boilers, ovens, and dryers, plus refrigerant make-up from cooling systems, are calculated in real time from gas meter data and refrigerant log entries. Scope 2 emissions from purchased electricity and steam are calculated from the facility's power meter and steam flow meter, using the applicable emission factors for the grid region (EPA eGRID for US facilities, DEFRA for UK, AIB for EU, or custom factors for other regions). The manager sees cumulative emissions for the current reporting period — month, quarter, year — compared to the budgeted trajectory and the emissions reduction target. When a piece of emissions-intensive equipment — a gas-fired oven on a biscuit line, a boiler supplying steam to a CIP skid — operates outside its expected emissions profile, the dashboard flags the deviation with the equipment ID, the emissions increase rate, and the estimated impact on the quarterly emissions budget if the condition persists.
ESG action enabled: Quarterly emissions budget deviation detected at the equipment level within hours, not weeks. Corrective action taken before the reporting period closes.
Dashboard View 03
Waste Diversion Rate and Material Stream Analytics
Waste reports logged in the Shift Logbook or CMMS — by waste type (plastic packaging, cardboard, organic waste, hazardous waste), disposal method (recycling, composting, incineration, landfill), and generating production line — are automatically aggregated into the waste diversion rate calculation. The dashboard displays the current diversion rate against the zero-waste-to-landfill target, segmented by material stream and by production line. The manager sees which waste streams are at or above the diversion target and which streams — typically flexible plastic packaging, mixed-material laminates, or contaminated organic waste — are driving the landfill fraction. Waste reduction initiatives can be tracked at the material stream level: when a packaging change reduces plastic waste from Line 1 by switching from multi-material laminates to monomaterial recyclable film, the dashboard shows the waste reduction in kilograms per shift and the corresponding improvement in diversion rate, providing measurable evidence for the ESG report.
ESG action enabled: Waste reduction initiative impact measured at the material stream and production line level — not estimated from facility-level waste hauler invoices.
Dashboard View 04
ESG Report Generation and Framework Compliance Status
The report generation view shows the current status of each ESG reporting framework the plant uses — GRI, SASB, CDP, TCFD — displayed as a compliance score that indicates the percentage of required metrics that are being automatically populated from operational data versus manually entered or estimated. Each metric within each framework is displayed with its current value, its data lineage status (automated, manually entered, or estimated), and its variance from the previous reporting period. The manager can identify at a glance which metrics need attention — typically waste metrics where the waste hauler's monthly report has not yet been reconciled with the plant's internal waste log, or emissions metrics where an emission factor update has created a variance that requires review. When all metrics for a framework reach the automated or reviewed status, the platform generates the complete report package — data tables, methodology notes, emission factor sources, and data lineage records — in the format required by the reporting framework or the corporate sustainability team.
ESG action enabled: Report preparation time reduced from 3-5 person-days to a single review session. Audit-ready data lineage generated automatically for every reported metric.
"
We were spending 4 person-days every quarter pulling energy data from utility bills, water data from manual meter reads, and waste data from hauler invoices — each on a different schedule with different units and different date ranges. Reconciling them into our GRI report was a full-week exercise for one of my team members, and the error reconciliation always took another day. When our corporate sustainability team asked us to align with CDP reporting on top of GRI, I knew the manual approach would not scale. iFactory's sustainability tracking platform connected directly to our production-line meters and waste tracking system — the data we already had but were not using for ESG. The first quarterly report we generated from the platform took 90 minutes. The auditor asked for source data on our Scope 2 emissions, and we showed them the hour-by-hour power meter data for each production line with the eGRID factors applied. They accepted the report without qualification. We have not run a manual ESG data pull since.
— Sustainability Manager, Multinational FMCG Manufacturer — 4 Plants, 12 Production Lines, GRI and CDP Reporting Framework
What Analytics-Driven ESG Reporting Means for GRI, SASB, CDP, and CSRD Compliance
Each ESG reporting framework imposes specific requirements on the quality, granularity, and traceability of sustainability data. Analytics-driven ESG reporting is designed to satisfy these requirements through automated data ingestion, framework-aligned metric calculation, and auditable data lineage — eliminating the manual processes that create uncertainty, delay, and compliance risk in sustainability reporting.
GRI 302 requires disclosure of energy consumption within the organisation broken down by energy source type. Analytics-driven reporting provides this at equipment and production-line granularity from sub-meter data, not facility-level allocation. GRI 303 requires water withdrawal by source type and discharge by receiving water body — traceable from each water meter point. GRI 305 requires Scope 1, 2, and 3 emissions by source, calculated automatically with configurable emission factors. GRI 306 requires waste generation by disposal method and material stream — linked to each waste log entry in the Shift Logbook or CMMS with time stamp and production line ID.
SASB Framework
SASB FB-PF and FB-NB — Processed Foods and Non-Alcoholic Beverages
SASB FB-PF requires energy and water intensity metrics calculated per unit of production, fleet fuel consumption for refrigerated transport, and refrigerant management disclosure. The platform calculates energy and water intensity automatically from production-line meter data and production volume data from the MES or Shift Logbook. Fleet fuel tracking and refrigerant make-up logs are ingested from the CMMS where maintenance events are recorded. Each SASB metric is mapped to the specific accounting metric code in the SASB standards, and the report export matches the format expected by the Sustainability Accounting Standards Board.
CSRD / ESRS
EU Corporate Sustainability Reporting Directive — European Sustainability Reporting Standards
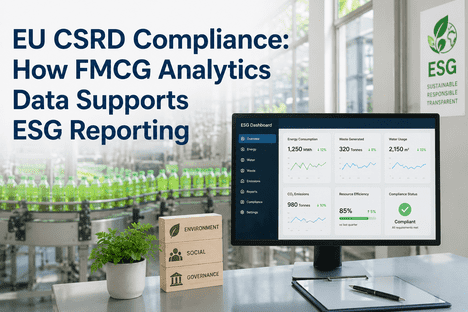
The CSRD requires double materiality assessment, auditable sustainability data with limited assurance (moving toward reasonable assurance by 2028), and digital tagging of reported metrics using the ESRS taxonomy. Analytics-driven ESG reporting provides the auditable data lineage that limited assurance requires — every metric is traceable to source data with calculation methodology, emission factor version, and time stamp. The platform generates the data lineage in the format required by the CSRD assurance provider, including the digital tagging information for metrics that require ESRS taxonomy codes. For FMCG manufacturers with EU operations, the platform's traceability architecture directly satisfies the CSRD's requirement for sustainability data that can be assured to the same standard as financial data.
Conclusion: Sustainability Reporting Is an Analytics Integration Problem, Not a Data Collection Problem
FMCG manufacturers do not lack sustainability data. They lack the integration architecture that connects operational data — energy meters, water flow sensors, waste tracking logs, emissions monitors — to ESG reporting frameworks without manual data extraction, spreadsheet calculations, and reconciliation cycles that consume 3 to 5 person-days per reporting period and produce metrics with a 15 to 25 percent error margin. The operational data that drives production monitoring, maintenance scheduling, and quality control decisions is the same data that should drive sustainability reporting. The only difference is the calculation methodology applied to that data — and that methodology is a configurable transformation, not a reason to build a separate data collection infrastructure.
Analytics-driven ESG reporting delivers this integration through three capabilities that manual processes cannot provide simultaneously: automated data ingestion from the plant's existing operational meters and monitoring systems, framework-aligned metric calculation that applies GRI, SASB, CDP, and CSRD methodologies to the same operational data without manual reformatting, and auditable traceability that links every reported number back to the specific equipment, shift, and time stamp where the source data was generated.
iFactory's Energy and Sustainability Tracking platform is built for FMCG manufacturers who need ESG reporting that matches the rigour of their operational data — not a separate, manual process that duplicates effort and introduces uncertainty. Book a Demo to see the platform configured for your plant's meter configuration and reporting framework requirements, or talk to an expert about a free ESG data readiness assessment that quantifies the gap between your current reporting process and an automated, audit-ready sustainability reporting architecture.
Frequently Asked Questions
Yes. The platform supports three methods for equipment-level sustainability metrics depending on the facility's metering infrastructure. For facilities with sub-metering at the production-line or equipment level — typically newer facilities or plants that have completed energy efficiency capital projects — the platform ingests sub-meter data directly and assigns it to the specific equipment or line. For facilities with facility-level meters only, the platform uses virtual metering: equipment energy consumption is estimated from the equipment runtime (from the CMMS or Shift Logbook), the OEM-rated power consumption at the current load factor (from the equipment master data), and a calibration factor derived from comparing the sum of all virtual meters to the facility-level physical meter reading. The virtual metering model is recalibrated monthly and maintains accuracy within 5 percent of measured facility-level consumption. For FMCG manufacturers that want to move from virtual to physical metering over time, the platform supports a phased deployment — virtual meters are replaced by physical meter data sources as sub-meters are installed, with no change to the ESG reporting output or the historical data series continuity. Talk to an expert about a metering assessment that identifies the optimal deployment strategy for your plant's current metering infrastructure and capital investment timeline.
Yes. The platform ingests operational data once and applies multiple framework-specific metric calculations to the same data set — eliminating the common practice of maintaining separate spreadsheets and data files for each reporting framework. Each framework is configured with its own metric definitions, calculation methodologies, emission factor sources, and report format templates. When the sustainability manager needs to generate both a GRI report and a CDP response from the same reporting period, the platform runs both calculation sets against the same ingested data and produces separate outputs in the format required by each framework. The platform automatically handles the differences between frameworks — for example, GRI requires energy consumption reported in joules while CDP accepts MWh — by applying the appropriate unit conversions and reporting formats without manual recalculation. The data lineage for each framework-specific metric records which methodology and emission factor version was used, so the auditor for each framework sees the calculation path specific to that framework's requirements. Book a Demo to see a multi-framework report generation configured for your plant's reporting obligations.
Scope 3 emissions for FMCG manufacturers typically represent 80 to 90 percent of total emissions and are the most data-intensive category to report. iFactory's platform supports Scope 3 calculation through a combination of automated data ingestion and structured manual input with traceability. Category 1 (Purchased Goods and Services) and Category 4 (Upstream Transportation) emissions are calculated from procurement data ingested from the ERP or supply chain system — material quantities by supplier, transportation mode, and distance — multiplied by the applicable emission factors from the EPA, DEFRA, or GHG Protocol databases. Category 12 (End-of-Life Treatment of Sold Products) emissions are calculated from the waste packaging data already logged in the CMMS or Shift Logbook — packaging material type and quantity by SKU, with disposal method assumptions from the product life cycle assessment or industry default values. Each Scope 3 category is displayed with its data quality score — calculated from the percentage of data points that are supplier-specific (highest quality), industry-average (medium quality), or proxy-based (lowest quality) — so the sustainability manager can prioritise data quality improvement efforts on the categories where the emissions impact and data quality gap are largest. Talk to an expert about configuring Scope 3 category prioritisation for your FMCG product portfolio and supply chain structure.
The typical implementation timeline for a single FMCG plant with 4 to 8 production lines is 4 to 6 weeks from project kick-off to first ESG report generation. Week 1: Meter and data source discovery — the implementation team audits the plant's existing energy meters, water meters, waste tracking processes, and emissions data sources to identify which data points are available digitally, which are recorded manually, and which require virtual metering. Week 2: Data integration — the platform connects to the available digital data sources (energy meters via Modbus or OPC-UA, water meters via MQTT, CMMS or Shift Logbook via API for waste and production data). For manual data sources, structured import templates are provided with validation rules that prevent unit conversion errors and data format inconsistencies. Week 3: Framework configuration — the ESG frameworks applicable to the plant (GRI, SASB, CDP, CSRD) are configured with the relevant metric definitions, emission factors, and report format templates. The sustainability manager reviews and approves the metric calculation methodology for each framework. Week 4-5: Dashboard configuration and user training — the ESG dashboard views are configured for the sustainability manager and plant management team. Training covers metric review, framework status monitoring, and report generation. Week 6: First report generation and validation — the platform generates its first ESG report from live operational data, and the sustainability manager validates the metrics against the previous manual report to confirm data accuracy and methodology alignment. Book a Demo to see a sample implementation timeline configured for your plant's meter configuration and reporting framework requirements.
Your ESG Report Should Be Generated from the Same Data That Tracks Your Production. Get a Free ESG Data Readiness Assessment.
iFactory's Energy and Sustainability Tracking platform for FMCG manufacturers — automated data ingestion from production-line meters, framework-aligned metric calculation for GRI, SASB, CDP, TCFD, and CSRD, and audit-ready traceability from every reported number back to the equipment, shift, and time stamp where the source data was generated — eliminating manual ESG data compilation and reducing report preparation time by 60 to 80 percent.