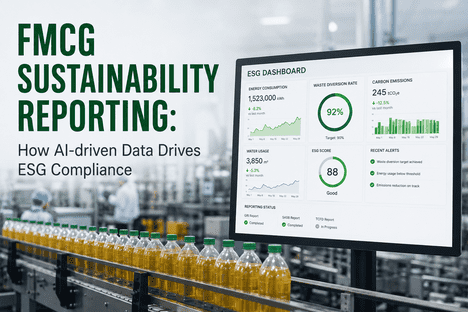
FMCG Sustainability Reporting: How AI-driven Data Drives ESG Compliance
By Seren on June 11, 2026
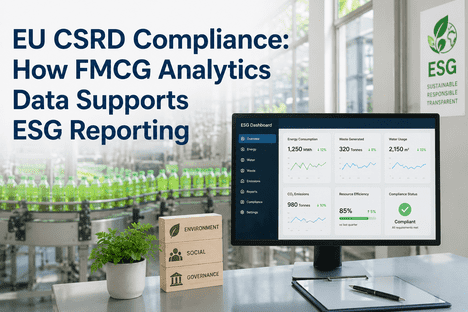
The global FMCG industry is under unprecedented pressure to produce verifiable sustainability data not aspirational commitments but auditable, production-linked environmental metrics that satisfy ESG rating agencies, regulatory bodies, and retail customers who increasingly require carbon footprint data per product unit as a procurement condition. The European Union's Corporate Sustainability Reporting Directive (CSRD) now requires approximately 50,000 companies including major FMCG manufacturers and their suppliers to report sustainability data to mandatory audit standards. The U.S. Securities and Exchange Commission's climate disclosure rules require Scope 1 and 2 emissions reporting for publicly traded companies with audited financial statements. Retailers including Walmart, Tesco, Carrefour, and Metro AG have set supplier sustainability scorecard requirements that include carbon intensity, water consumption, waste diversion rate, and renewable energy percentage and are delisting suppliers who fail to meet minimum thresholds. The problem is that most FMCG manufacturers collect sustainability data the same way they did a decade ago: manually compiling utility bills, waste disposal records, and production volumes into annual spreadsheets that are 6 to 12 months out of date by the time they are submitted. AI-driven sustainability reporting closes this gap by connecting automated data collection from energy meters, water meters, waste tracking systems, and production records into a unified ESG data platform that generates real-time sustainability metrics, automated regulatory reports, and audit-ready documentation. iFactory AI's Sustainability Dashboard and ESG Reporting module enable FMCG sustainability managers to deploy production-linked environmental tracking without replacing existing utility billing, waste management, or ERP systems. Book a Demo to see how iFactory connects production data to ESG reporting across your FMCG facility network.
Your Sustainability Data Already Exists in Your Production Systems. AI-Driven ESG Reporting Extracts It, Structures It, and Makes It Audit-Ready.
iFactory's Sustainability Dashboard connects to existing energy meters, water meters, waste tracking systems, and production records delivering real-time environmental KPIs, automated CSRD and SEC-compliant report generation, and auditor-ready documentation without manual data collection or spreadsheet consolidation.
Of sustainability reporting time spent on manual data collection, validation, and spreadsheet consolidation rather than analysis and abatement planning eliminated by automated AI-driven data ingestion
3-6 mo
Reduction in sustainability reporting cycle time from annual or quarterly manual reports to real-time dashboard updates with automated regulatory filing templates
80%+
Of consumers who pay a premium for sustainable products making verifiable ESG data a revenue driver, not just a compliance requirement
12-18%
Typical reduction in tracked environmental KPIs within 6 months of deploying automated ESG data collection driven by visibility into previously unmeasured waste and resource inefficiency
The ESG Reporting Burden in FMCG: Why Manual Data Collection Is No Longer Sustainable
The volume and complexity of sustainability reporting requirements for FMCG manufacturers have grown exponentially in the last three years, and the trajectory points toward further acceleration. A mid-size multi-line FMCG facility must now track and report 40 to 80 distinct environmental metrics across energy consumption (electricity, natural gas, steam, compressed air by source and scope), water management (total withdrawal, consumption by source, discharge volume and quality), waste management (total generation, diversion rate by stream, hazardous vs non-hazardous, recyclable content), greenhouse gas emissions (Scope 1, 2, and 3 with methodology documentation), and product-level environmental footprint data for retail customer sustainability scorecards. Each of these metrics requires data sources, calculation methodologies, and audit-ready documentation. Facilities that manage this manually dedicate 60 to 80% of sustainability team capacity to data collection and validation rather than abatement planning a structural inefficiency that automated AI-driven reporting eliminates.
The Five Reporting Mandates Driving FMCG ESG Data Requirements — and What Each Requires
Mandate 1
CSRD — European Union Corporate Sustainability Reporting Directive
Requires dual materiality assessment, detailed disclosure of environmental metrics (ESRS E1-E5), limited assurance audit standard, and digital tagging of reported data. Applies to all large companies operating in EU markets including non-EU headquartered FMCG manufacturers with EU subsidiaries. iFactory's ESG Reporting module generates CSRD-compliant reports with automated data lineage, multi-dimensional breakdowns per ESRS standard, and audit-ready documentation.
Automated ESRS E1-E5 metric population
Dual materiality data support
Limited assurance-ready documentation
Mandate 2
SEC Climate Disclosure Rule
Requires Scope 1 and 2 emissions disclosure in audited financial filings, with Scope 3 disclosure if material or if the registrant has set a Scope 3 target. Requires description of board oversight, risk management, and targets. iFactory provides automated Scope 1 and 2 tracking from meter data, verified emissions calculation using EPA eGRID or IEA factors, and audit trail generation for SEC filing support.
Scope 1 & 2 emissions per facility
Audit-ready data lineage documentation
Climate risk and target tracking
Mandate 3
Retailer Sustainability Scorecards
Walmart's Project Gigaton requires suppliers to report emissions reductions in seven categories; Tesco's Supplier Sustainability Program requires carbon footprint data per product unit; Carrefour's Transition Plan requires verified environmental data across all supplied categories. Non-compliant suppliers face delisting or reduced shelf allocation. iFactory's product-level carbon footprint tracking provides the per-unit environmental data retailers require.
Product-level carbon footprint per unit
Retailer-specific report templates
Verified reduction documentation
Mandate 4
SBTi — Science Based Targets Initiative
Nearly 500 FMCG companies have committed to SBTi near-term or long-term targets, requiring 42% Scope 1 and 2 reduction by 2030 and 90% by 2050. Target validation, annual progress reporting, and trajectory tracking require granular emissions data linked to production activity. iFactory's SBTi tracking module maps verified emissions data to validated reduction targets.
Target trajectory vs actual tracking
Annual progress report generation
Validation-ready data documentation
Mandate 5
CDP — Carbon Disclosure Project
CDP's climate, water, and forests questionnaires are the most widely used corporate environmental disclosure framework, with over 18,000 companies disclosing annually. FMCG manufacturers face specific sector-based questionnaires requiring detailed emissions breakdowns by scope, facility, product category, and supply chain. iFactory automates CDP questionnaire population from tracked sustainability data with audit-ready documentation.
Automated questionnaire population
Climate, water, and forests modules
Audit-ready data provenance
How AI-Driven ESG Data Collection Transforms Sustainability Reporting
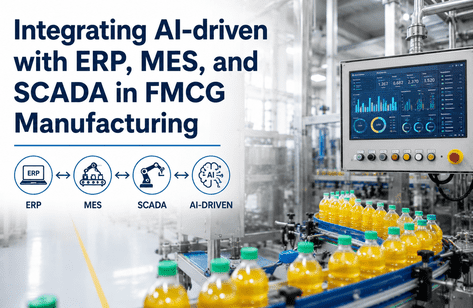
The fundamental problem with manual sustainability reporting is not that the data is unavailable — it is that the data is trapped in disconnected systems, unstandardized formats, and inconsistent time periods. A typical FMCG facility has energy consumption data in utility billing systems and interval meters, water consumption data in separate water management platforms or manual logs, waste generation data in third-party hauler invoices and weighbridge tickets, production data in the MES or ERP, and emissions factors in spreadsheets maintained by the sustainability team. AI-driven ESG data collection solves this by connecting to every data source through automated ingestion, normalizing all data to consistent units and time periods, and applying calculation methodologies automatically. Book a Demo to see how iFactory's automated data ingestion pipeline transforms disconnected operational data into audit-ready ESG reports.
Layer
Data Ingestion
Automated Connection to Every Sustainability Data Source
iFactory's data ingestion layer connects to utility interval meters via OPC-UA, Modbus, MQTT, or Green Button API; to waste management systems via hauler API or weighbridge tickets; to water meters and effluent monitoring systems; to production data from MES, ERP, or Shift Logbook; and to emissions factor databases (EPA eGRID, IEA, DEFRA, IPCC). Data from all sources is ingested at the native frequency — 15-minute interval meter data, daily waste collection records, batch-level production data — and time-aligned to a common reporting calendar. The ingestion layer handles data quality validation automatically: missing intervals, out-of-range values, and unit inconsistencies are flagged and resolved before the data enters the reporting pipeline.
Layer
Metrics Engine
Real-Time Calculation of 80+ Environmental KPIs
The metrics engine converts raw data streams into auditable environmental KPIs using the GHG Protocol, ISO 14064, and sector-specific calculation methodologies. Energy consumption is converted to Scope 1 and 2 emissions using facility-specific emissions factors with automatic factor updates. Water consumption is reported by source (municipal, groundwater, surface water, recycled) and by use category (process, cooling, sanitation, domestic). Waste generation is tracked by stream, hazard classification, and diversion method, with diversion rate calculated per the EPA WARM methodology. All KPIs are expressed in absolute terms and normalized to production output for carbon intensity, water intensity, and waste intensity tracking.
Layer
Report Generator
Automated Regulatory Report Generation
The report generator maps calculated KPIs to the specific data points required by each reporting framework: CSRD ESRS E1-E5 disclosure requirements, SEC climate rule filing tables, CDP questionnaire sections, SBTi progress report templates, and retailer-specific scorecard formats. Each report is generated with full data lineage — every data point links back to its source meter reading, waste ticket, or production record — providing auditors with drill-down capability from the reported number to the original data source. Reports are generated in XBRL, PDF, and Excel formats as required by each framework.
Layer
Dashboard
Real-Time Sustainability Dashboard for All Audiences
The Sustainability Dashboard provides role-based views for facility managers, sustainability directors, and executive leadership. Facility managers see daily energy consumption, water use, and waste generation with variance alerts when KPIs deviate from target. Sustainability directors see multi-facility rollups, reduction target progress, and automated report generation status. Executive leadership sees a single-screen overview of carbon intensity trend, regulatory compliance status, and progress against SBTi and public commitments. All views use the same underlying data with consistent calculations — eliminating the spreadsheet proliferation where different versions of the same metric circulate across the organization.
The Manual Sustainability Report Takes 14 Person-Weeks to Produce. AI-Driven Reporting Produces It in Real Time — With Audit-Ready Data Lineage.
iFactory's ESG Reporting module connects to your existing utility meters, waste tracking, water monitoring, and production systems — generating CSRD, SEC, CDP, SBTi, and retailer-compliant reports with fully auditable data provenance from meter to disclosure.
Key Environmental KPIs That AI-Driven Reporting Automates for FMCG Manufacturers
An effective ESG reporting program for FMCG manufacturing covers four environmental domains — energy and emissions, water stewardship, waste management, and product-level environmental footprint — each with specific metrics, calculation methodologies, and reporting requirements. The table below documents the primary KPIs iFactory's Sustainability Dashboard tracks automatically, the data sources used, the reporting frameworks that require each KPI, and the typical improvement observed when manufacturers transition from manual to automated tracking.
Environmental Domain
Primary KPIs Tracked
Data Sources
Reporting Frameworks
Energy & Emissions
Scope 1 (tCO₂e), Scope 2 location & market (tCO₂e), energy intensity (kWh/unit), carbon intensity (kgCO₂e/unit), renewable energy percentage, peak demand (kW), base load (kW)
Utility interval meters, gas meters, steam flow meters, renewable energy certificates (RECs), power purchase agreements (PPAs)
Total water withdrawal (m³), water consumption by source, water intensity (L/unit), water discharge volume & quality, water recycling rate, water stress assessment by basin
Water meters by source, effluent monitoring sensors, water utility bills, recycling system flow meters, AWS water stewardship data
CSRD (ESRS E5), CDP Waste, GRI 306, Zero Waste certification, Ellen MacArthur Foundation
Product Environmental Footprint
Product carbon footprint (kgCO₂e/unit), water footprint (L/unit), packaging recyclable content (%), supply chain emissions allocated per product, end-of-life recyclability
Production data from MES/ERP, bill of materials, supplier emission factors, logistics data, packaging material records
EU PEFCR, retailer scorecards, ISO 14040/14044 LCA, SBTi FLAG, CDP supply chain
How iFactory's Sustainability Dashboard & ESG Reporting Module Delivers Audit-Ready Data
iFactory's Sustainability Dashboard and ESG Reporting module are purpose-built for FMCG manufacturers that already collect energy, water, waste, and production data but lack the automated platform to transform that data into audit-ready sustainability reports. The platform connects to existing instrumentation and data sources through standard protocols and provides the capabilities that sustainability teams need to meet CSRD, SEC, SBTi, CDP, and retailer reporting requirements without manual data collection or spreadsheet consolidation.
1
Automated Data Ingestion From Existing Metering & Tracking Systems
The platform connects to utility interval meters, sub-meters, water meters, waste tracking systems, and production data sources through OPC-UA, Modbus, MQTT, API, and CSV import — no new sensors or meters required. Data is ingested, validated, and normalized to the reporting calendar automatically. In facilities with metering gaps, iFactory provides estimation methodologies based on production activity data, with clear documentation of estimated vs measured data points for audit transparency.
Before: Manual data collection from 5+ disconnected sources consuming 60-80% of team capacity. After: Automated ingestion from every source — team focuses on analysis and abatement.
2
Real-Time KPI Dashboard With Target Tracking
The Sustainability Dashboard displays 40+ environmental KPIs updated at the same frequency as the underlying data — 15-minute intervals for energy and water, daily for waste, batch-level for production. Each KPI is shown with current value, trend (7-day, 30-day, 12-month), target comparison, and variance indicator. Targets are configurable per framework: SBTi reduction trajectories, CSRD targets, CDP targets, and corporate net-zero commitments can all be tracked simultaneously with progress visualization.
Before: Annual or quarterly KPI updates — data is obsolete by the time it is reviewed. After: Real-time KPI visibility — deviations identified and corrected within hours.
3
Multi-Framework Report Generation With Full Audit Trail
The ESG Reporting module generates CSRD-compliant reports mapped to ESRS E1-E5 disclosure requirements, SEC climate rule filing tables with Scope 1 and 2 breakdowns, CDP climate and water questionnaire sections, SBTi progress report templates, and retailer sustainability scorecard formats. Every reported data point includes clickable data lineage that traces from the reported number back through the calculation methodology to the original source meter reading, waste ticket, or production record — providing auditors with complete documentation without additional work from the sustainability team.
Before: Report generation takes 8-14 person-weeks per framework — each report is a manual consolidation exercise. After: Reports generated with one click — data lineage built into every data point.
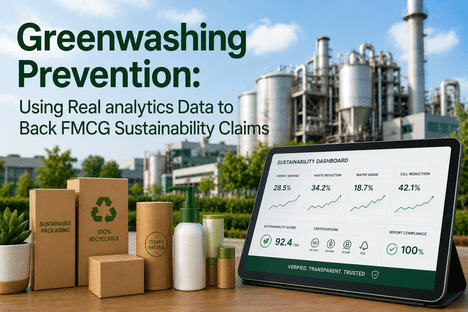
Every carbon reduction, water saving, or waste diversion action tracked in the Shift Logbook is linked to its measured environmental impact through pre- and post-implementation data. Verified savings are automatically calculated using the same metered data sources as the baseline reports, providing auditable reduction documentation for SBTi, CDP, and CSRD disclosure. The platform tracks cumulative verified reductions against targets and reports progress in the format required by each framework.
Before: Reduction claims are based on engineering estimates or intermittent measurements. After: Every reduction is verified against meter data with full audit trail.
"
Our sustainability team was drowning in spreadsheets. We had 14 facilities submitting energy data in different formats, waste data scattered across three hauler systems, and production data in a separate ERP. Producing our annual CDP report required 14 person-weeks of manual work, and by the time the report was published, the data was already 9 months old. iFactory's ESG Reporting module connected to all of our data sources in 6 weeks. Our CDP report now generates automatically with real-time data that traces back to the original meter reading. We have reduced our reporting cycle from 14 weeks to 3 days, and our sustainability team has shifted from spreadsheet consolidation to executing the abatement projects that actually reduce our carbon footprint.
— Director of Global Sustainability, Fortune 500 Food & Beverage Manufacturer, 14 Facilities, $8.2B Revenue
The Business Case for AI-Driven ESG Reporting in FMCG
The return on investment for AI-driven ESG reporting combines direct savings from reporting efficiency, compliance risk reduction, and environmental performance improvement. Facilities deploying iFactory's Sustainability Dashboard alongside their existing sustainability programs report measurable improvements across four key metrics within the first two reporting cycles.
Metric 1
60-80% Reduction in Sustainability Reporting Time
Automated data ingestion, KPI calculation, and report generation eliminates manual spreadsheet consolidation — freeing sustainability team capacity for abatement action planning and execution.
Metric 2
12-18% Reduction in Tracked Environmental KPIs
Real-time visibility into previously unmeasured waste streams, energy inefficiencies, and water losses enables targeted abatement actions that reduce environmental footprint and operational cost simultaneously.
Metric 3
Audit-Ready Data Without Additional Work
Every reported data point includes built-in audit trail from the disclosure number back to the original meter reading or source record — eliminating the pre-audit data gathering panic that consumes 2-4 weeks before every ESG audit.
Metric 4
Regulatory Compliance Risk Reduction
Automated methodology alignment with CSRD, SEC, SBTi, CDP, and retailer standards eliminates the risk of inconsistent calculations, outdated emission factors, or missing data points that trigger audit findings or regulatory penalties.
Implementation Approach for FMCG ESG Reporting Automation
iFactory follows a structured deployment methodology designed specifically for FMCG sustainability reporting programs — integrating with existing utility data sources, waste tracking systems, and production platforms without disrupting established reporting workflows. The implementation timeline for a typical multi-facility FMCG operation is 6-10 weeks from data connection to live ESG reports.
ESG Reporting Automation Deployment Phases
Weeks 1-3: Data Source Mapping & Connection
Map all utility meter data sources, waste hauler data feeds, water meter systems, and production data platforms. Establish automated data connections via OPC-UA, API, Modbus, MQTT, or CSV import. Validate data quality, frequency, and completeness for each source.
Weeks 3-5: Baseline & KPI Configuration
Platform ingests 12 months of historical data to establish environmental KPI baselines. Emissions factors, calculation methodologies, and reporting frameworks configured per facility and region. Sustainability Dashboard customized with target tracking and variance thresholds.
Weeks 5-7: Report Template Configuration
CSRD, SEC, CDP, SBTi, and retailer report templates configured with automated data mapping from KPIs to disclosure requirements. Audit trail and data lineage documentation validated. Sustainability team trained on report generation and review workflows.
Weeks 7-10: Go-Live & Validation
Sustainability Dashboard live with real-time KPI tracking. First automated report generated, reviewed, and validated against manual reporting methodology. 30-day supervised operation with weekly validation against existing reporting processes before manual processes are retired.
Conclusion
Sustainability reporting is no longer a voluntary communication exercise for FMCG manufacturers — it is a regulatory requirement, a retailer procurement condition, a customer expectation, and an investor screening criterion. The difference between companies that treat ESG reporting as a compliance burden and companies that use it as a competitive advantage is the quality and timeliness of the underlying data. Companies that rely on manual data collection and spreadsheet consolidation will find themselves increasingly unable to meet the growing volume, frequency, and audit standard of sustainability disclosure requirements.
AI-driven ESG reporting transforms sustainability data from an annual reporting exercise into a real-time management tool — providing the same granularity, timeliness, and auditability for environmental metrics that financial reporting systems have provided for financial metrics for decades. The FMCG manufacturers that deploy automated ESG data collection and reporting today will have a structural advantage in meeting CSRD, SEC, SBTi, CDP, and retailer requirements while their competitors continue to invest 60-80% of sustainability team capacity in manual data collection.
iFactory's Sustainability Dashboard and ESG Reporting module are purpose-built for FMCG manufacturers — delivering automated data ingestion from existing meters and systems, real-time KPI tracking, multi-framework report generation, verified abatement documentation, and audit-ready data lineage. Book a Demo to see the platform configured for your FMCG facility network, or talk to an expert about a free ESG reporting maturity assessment for your organization.
Frequently Asked Questions
No. iFactory's ESG Reporting module is designed to integrate with existing enterprise sustainability reporting platforms, ERP systems, and utility management platforms — not replace them. The module serves as the operational data layer that ingests granular facility-level data from energy meters, water meters, waste tracking systems, and production records; calculates environmental KPIs using auditable methodologies; and feeds consolidated data into enterprise platforms for corporate-level reporting, financial materiality assessment, and investor-grade disclosure. For companies without an existing enterprise ESG platform, iFactory's Sustainability Dashboard provides comprehensive reporting capabilities for facility-level and multi-facility ESG management. The module supports data export to Salesforce Net Zero Cloud, SAP Sustainability Management, Enablon, Greenstone, Persefoni, and other major ESG reporting platforms through API and CSV integration. Talk to an expert about integration with your existing sustainability technology stack.
iFactory maintains a dedicated regulatory intelligence team that tracks updates to emissions factors, calculation methodologies, and reporting requirements across all supported frameworks. The emissions factor library — covering EPA eGRID, IEA, DEFRA, IPCC, AIB, and national grid operator data — is updated automatically when regulatory sources publish revisions, with a complete change log for audit trail. Calculation methodologies are updated to align with the latest GHG Protocol guidance, CSRD ESRS implementation standards, SEC climate rule interpretations, and SBTi target-setting criteria. When a framework updates its requirements, the platform notifies users of the change, the impact on historical data, and the transition timeline. This automated methodology management eliminates the risk of reporting non-compliance due to outdated emission factors or calculation approaches. Book a Demo to see how iFactory manages methodology updates across multiple reporting frameworks simultaneously.
iFactory addresses Scope 3 emissions through a tiered approach that matches the level of data availability. For the highest-spend and highest-emission suppliers, the platform supports direct data collection through supplier sustainability portals where suppliers upload their facility-level energy and production data. For suppliers where direct data is not available, the platform applies spend-based emission factors from EEIO (Environmentally Extended Input-Output) models using procurement spend data from the ERP, classified by commodity category. For purchased materials and services with industry-average emission factors available (DEFRA, EPA, or industry association sources), those factors are applied automatically. All Scope 3 data is clearly labeled with its data source tier (supplier-specific, spend-based, or industry-average) for audit transparency. As more suppliers provide facility-level data over time, the platform automatically upgrades the data source tier, improving accuracy without requiring manual recalculations. The Scope 3 module covers all 15 categories defined by the GHG Protocol Scope 3 Standard and aligns with SBTi Scope 3 target-setting requirements. Talk to an expert about Scope 3 data strategy for your supply chain.
iFactory's platform is designed to work with the data infrastructure that FMCG facilities typically already have in place. The minimum requirement is access to utility bill data (electricity, gas, water) in digital format — either through utility Green Button data, online portal CSV export, or manual entry with a monthly cadence. With this minimum data, the platform provides facility-level Scope 1 and 2 emissions tracking, carbon intensity trends against production, and CSRD/SEC/CDP report generation. For facilities with interval meters (hourly or 15-minute data), the platform adds base load analysis, real-time energy consumption monitoring, and anomaly detection. For facilities with sub-meters at the line or zone level, the platform provides production-line-level carbon intensity tracking and detailed energy decomposition. For facilities with water meters, waste tracking systems, and effluent monitoring, the platform provides comprehensive multi-domain ESG reporting. The platform scales with the available data infrastructure — adding capabilities as new data sources become available — so facilities can start with utility bill data and add sub-meters, water meters, and waste tracking integration over time without reconfiguring the system. Book a Demo to discuss the optimal starting point for your facility's current data infrastructure.
Yes — multi-facility, multi-jurisdiction reporting is the most common deployment configuration for FMCG manufacturers operating across state and national boundaries. The platform maintains facility-level data models with facility-specific emissions factors (using the appropriate grid emission factor for each facility's electric utility region), waste diversion calculation methodologies (aligned with local regulations), and water stress assessment (using the WRI Aqueduct or AWS water risk data for each facility's watershed). Reports can be generated at facility level, country level, or global level with consistent methodology alignment across all jurisdictions. The platform supports the EU CSRD for European facilities, SEC climate rules for U.S. facilities, and local regulatory requirements for facilities in other jurisdictions — all from a single platform with facility-specific configuration. Consolidated reports at the corporate level aggregate across all facilities using consistent Group-level governance rules while maintaining facility-level granularity for local reporting. Talk to an expert about multi-jurisdiction rollout planning for your facility network.
Your Next ESG Report Is Due Sooner Than You Think. The Data Already Exists in Your Production Systems. iFactory's AI-Driven Sustainability Dashboard Extracts It, Structures It, and Generates the Report With Full Audit Trail Without a Single Manual Spreadsheet.
iFactory's Sustainability Dashboard and ESG Reporting module connects to your existing meters, waste tracking, water monitoring, and production systems delivering CSRD, SEC, CDP, SBTi, and retailer-compliant reports with real-time KPI visibility and auditor-ready data lineage in 6-10 weeks. No new sensors required. No manual data collection. No more spreadsheets.