A predictive analytics technology stack for FMCG manufacturing is not a single product or platform it is an integrated system of sensors, edge computing hardware, AI models, data pipelines, and workflow automation tools that work together to convert raw machine data into actionable maintenance decisions. A typical FMCG facility operating 8 to 12 production lines with 200 to 500 rotating assets — motors, pumps, gearboxes, compressors, conveyors, fans, and blenders generates vibration, temperature, current, pressure, and flow data from hundreds of measurement points every second. The challenge is not the availability of data but the architecture required to capture it at the right sampling rate, transmit it with industrial reliability, process it through AI models that detect degradation patterns, and deliver the resulting predictions to maintenance teams through workflows that trigger the right response at the right time. iFactory's AI-Powered Predictive Analytics platform provides the complete technology stack from sensor selection and edge gateway configuration through AI model deployment and CMMS integration as a single turnkey solution that replaces the fragmented combination of vendor-specific sensor systems, generic IoT platforms, and standalone analytics tools that most FMCG facilities piece together. Maintenance and reliability engineers evaluating predictive analytics infrastructure can book a demo to review how the stack maps to their specific asset types, data infrastructure, and reliability program objectives.
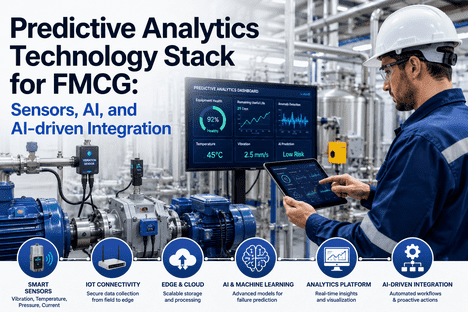
A complete predictive analytics technology stack for FMCG manufacturing consists of six technology layers that span the entire data-to-action pipeline. Each layer addresses a specific part of the predictive maintenance workflow — from sensing the physical condition of rotating equipment to triggering a work order in the maintenance management system. The table below details each layer, the technology components it includes, the deployment configuration, and the specific function it performs within the overall stack. Facility engineers evaluating technology options typically book a demo to compare how the iFactory stack integrates across all six layers versus assembling them from separate vendors.
| Layer | Technology Components | Deployment Configuration | Function in the Stack |
|---|---|---|---|
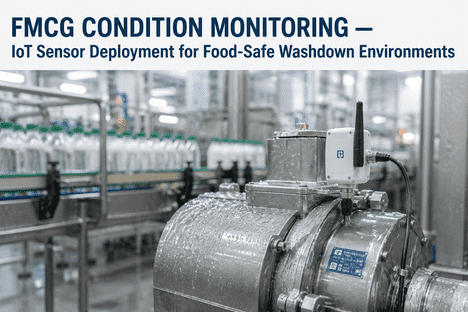
| 1. Sensor Layer | Wireless vibration sensors (tri-axial accelerometers, 0.5–10 kHz range), temperature sensors (RTD and thermocouple), current transformers, ultrasonic sensors, thermal cameras | Permanently mounted on bearing housings, motor frames, pump casings, and gearbox housings at 200–500 measurement points per 8–12 line facility; wireless mesh network with 500 m range per gateway | Captures machine condition data at programmable sampling rates — vibration velocity and acceleration spectra, temperature trends, current draw signatures, ultrasonic dB levels, and thermal image frames |
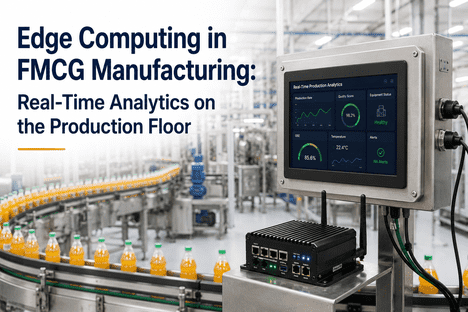
| 2. Edge Computing Layer | Industrial IoT gateways (ARM-based or x86) with local data buffering, protocol conversion (Modbus, OPC-UA, MQTT), and pre-processing capability | One gateway per production area or per 50–80 sensor points; local storage for 72 hours of continuous data; PoE or 24 VDC powered with UPS backup | Aggregates sensor data at the edge, converts proprietary sensor formats to standardized data structures, applies signal processing (FFT, filtering, averaging), and transmits compressed data to the analytics platform |
| 3. Data Pipeline Layer | Time-series database, data ingestion API, data quality validation engine, data retention and archiving policy engine | On-premise or cloud-hosted time-series database; configurable retention from 90 days to 5 years; automated data quality checks for missing values, outliers, and sensor drift | Ingests, validates, stores, and serves sensor data to the AI layer — ensures that every prediction is based on clean, complete, and correctly time-stamped data from all sensor points |
| 4. AI Model Layer | ML models for anomaly detection (autoencoders, isolation forest), remaining useful life prediction (ensemble regression, LSTM), fault classification (random forest, gradient boosting), and baseline adaptation | Trained on iFactory’s reference dataset of 50,000+ machine-years of industrial data; fine-tuned on facility-specific data within 4–6 weeks of deployment; model inference at sub-second latency on edge or cloud | Converts sensor data into predictions — detects anomalies that indicate developing faults, classifies fault types (bearing wear, imbalance, misalignment, lubrication degradation), and estimates remaining useful life for each monitored asset |
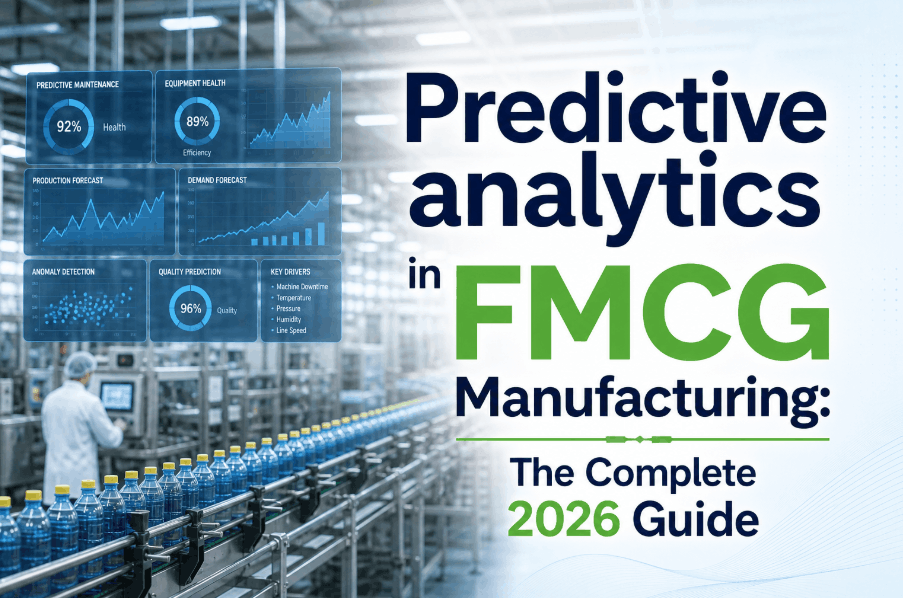
| 5. Visualization Layer | Asset health dashboard, real-time trend charts, prediction timeline, alert console, and reporting engine | Web-based dashboard accessible on desktop and mobile; role-based views for operators, reliability engineers, and plant managers; exportable reports for management reviews | Presents asset health status, active predictions, and alert history in a single interface — provides maintenance teams with at-a-glance visibility into the condition of every monitored asset |
| 6. Workflow Integration Layer | CMMS/EAM connectors (REST API), automated work order generation, parts reservation trigger, technician assignment rules, closed-loop feedback capture | Bi-directional integration with existing CMMS or built-in work order module; configurable severity thresholds for automated vs. reviewed work order creation; feedback loop for prediction validation | Converts AI predictions into maintenance actions — generates work orders with predicted fault type, affected component, recommended action, and required spare parts; captures inspection outcomes to improve model accuracy |
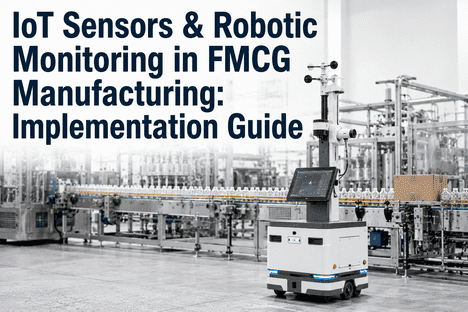
The sensor layer is the foundation of the entire predictive analytics stack, and the quality of predictions depends directly on sensor type selection, mounting method, sampling configuration, and deployment coverage. iFactory's sensor deployment methodology follows a risk-based approach that prioritizes critical assets, applies the appropriate sensor type and configuration for each asset class, and ensures data quality through standardized mounting and commissioning procedures. The comparison below illustrates the difference between ad-hoc sensor deployment and iFactory's structured sensor strategy for a typical FMCG facility.
- Sensors selected based on generic specifications without asset-specific analysis — same vibration sensor and sampling configuration applied to a 5 HP cooling fan and a 500 HP refrigeration compressor
- Mounting methods vary by installer — magnetic mount on some assets, stud mount on others, adhesive on painted surfaces — resulting in inconsistent data quality and frequency response
- Sampling rates set to default values without regard to asset operating speed — low-speed assets sampled at rates that miss early-stage degradation signals, high-speed assets oversampled with unnecessary data volume
- Coverage gaps determined by available budget rather than asset criticality — critical assets without sensors remain unmonitored until failure
- No standardized commissioning or baseline collection process — months of data required before initial models can be trained
- Asset-specific sensor selection based on operating speed, bearing type, failure modes, and mounting surface condition — tri-axial accelerometers with 10 kHz range for high-speed assets, low-frequency accelerometers for slow-speed assets, ultrasonic sensors for steam traps and valves
- Standardized mounting per iFactory installation specification — stud mount on flat machined surfaces, adhesive mount on clean surfaces within 50 mm of bearing centerline, magnetic mount only on flat unpainted surfaces with verified frequency response
- Speed-optimized sampling configuration — FFT lines set to capture 10x the fundamental rotational frequency, sufficient resolution for bearing fault frequencies, and overlap ratios that ensure statistical confidence in spectral averages
- Risk-prioritized coverage — 100 percent of critical and semi-critical assets covered in first deployment phase; remaining assets covered in phase two based on failure consequence analysis
- Structured 7-day baseline collection after commissioning — normal operating condition data captured across load and speed ranges to establish initial model baselines within the first week of operation
The AI model layer is where sensor data is converted into actionable predictions. iFactory deploys a multi-model architecture that detects anomalies in real time, classifies fault types, and estimates remaining useful life for each monitored asset. The five-stage model pipeline below describes how raw spectral data from vibration sensors and trend data from temperature and current sensors is processed through consecutive model stages to produce maintenance recommendations.
The metrics below represent average results from iFactory predictive analytics stack deployments across FMCG facilities with 8 to 12 production lines over 12-month validation periods. Individual results vary based on facility configuration, asset types, existing maintenance program maturity, and deployment scope.
I led the reliability engineering team at a 10-line FMCG facility producing 1.2 million cases per month, and we spent three years trying to build our own predictive analytics stack from separate vendors. We had vibration sensors from one supplier, an IoT gateway platform from another, a cloud data lake from a third, and we were trying to write our own AI models with a team of two data scientists. The integration problems were relentless — the sensor data format didn't match what the gateway expected, the data lake schema didn't align with the model input requirements, and the CMMS vendor charged us separately for each API integration endpoint. After eighteen months of integration work, we had managed to get data flowing from 40 percent of our sensors to the data lake, but none of our models were deployed in production because the data pipeline had too many failure points to achieve the 99.5 percent uptime that predictive maintenance requires. We replaced the entire stack with iFactory's platform in ten weeks. The sensors, gateways, data pipeline, AI models, and CMMS integration came as a single integrated system — every component was designed to work with every other component. The deployment covered 280 sensor points across all ten lines, and we had our first validated anomaly detection alerts within 14 days of sensor commissioning. The difference between assembling a stack from separate vendors and deploying an integrated platform is the difference between spending your engineering budget on integration and spending it on reliability improvement.
The six-layer predictive analytics technology stack — sensors, edge computing, data pipeline, AI models, visualization, and workflow integration — delivers the full value of predictive maintenance only when all six layers are deployed as an integrated system with each component designed to work with the others. FMCG facilities that attempt to assemble the stack from separate vendors face integration costs that typically exceed the component costs by a factor of 2 to 3, deployment timelines measured in years rather than weeks, and data pipeline reliability that falls short of the 99.5 percent uptime threshold required for production-critical predictive maintenance. iFactory's AI-Powered Predictive Analytics platform provides the complete, integrated stack as a single turnkey solution — from sensor selection through CMMS integration — deployed in 8 to 12 weeks and delivering validated predictions from day one. For FMCG facilities making the transition from reactive to predictive maintenance, the technology stack decision is the most consequential infrastructure investment they will make, and the choice between integration and assembly will determine whether predictive analytics becomes a transformative capability or a perpetual integration project.