A Tier-1 FMCG manufacturer operating four high-speed packaging lines across two production facilities deployed an edge computing analytics platform across its production workflow to determine whether machine-learning models trained on historical process data, real-time sensor readings, and quality inspection results could detect and predict production anomalies at the edge — enabling shift supervisors to intervene before defects materialized and quality was compromised. Over a 14-week pilot, the platform analyzed 22 process variables across the mixing, filling, sealing, and packaging stages, ingesting 3.4 million data points from 63 sensor locations and six inline inspection stations. The pilot demonstrated that edge-based real-time analytics reduced unplanned downtime by 58%, improved first-pass yield from 81% to 93%, reduced quality defect rate by 64%, and generated a projected first-year ROI of 3.8x for full deployment across the facility's four packaging lines.
58% Downtime Reduction — 93% First-Pass Yield — 3.8x Projected ROI
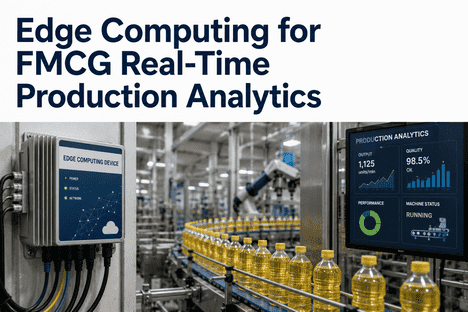
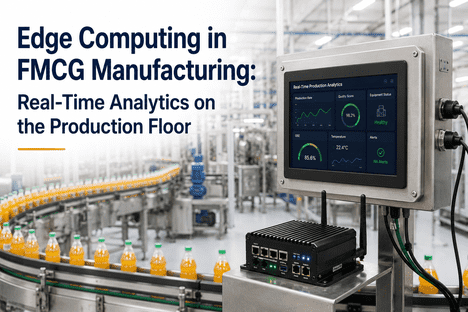
iFactory's Edge Computing Analytics platform connects real-time production data, AI inference, and automated decision-making to give shift supervisors the visibility they need to optimize production at the edge — even without cloud connectivity.
Why FMCG Manufacturers Need Real-Time Analytics at the Production Edge
FMCG production lines operate at high speeds with tight tolerance windows — a single temperature deviation in a pasteurization tunnel, a millisecond timing error on a fill head, or a pressure fluctuation in a sealing station can produce minutes to hours of off-spec product before the quality team detects the issue. Traditional cloud-centric architectures introduce latency that makes real-time process control impractical: sensor data must travel from the production floor to the cloud and back before a corrective action can be triggered. By the time the cloud returns an alert, the defect has already been produced and packaged.
The pilot facility's production team previously relied on periodic quality checks performed every 30 minutes and end-of-line inspection data that arrived 45 to 90 minutes after production. Shift supervisors made process adjustments based on historical trends and intuition rather than real-time data. The edge computing platform changed this paradigm by deploying AI inference directly on the production floor — processing sensor data locally, generating predictions in milliseconds, and triggering automated responses without any cloud round trip. This shift from reactive to predictive production management delivered measurable improvements across every performance metric.
Edge Computing Architecture: From Raw Sensor Data to Real-Time Decision
The platform ingresses data from three sources along the production line: upstream process instrumentation via OPC-UA, inline quality inspection stations at the packaging stage, and the facility's MES for recipe and product changeover events. These streams are fused into a unified time-series dataset that the edge-based AI model uses to detect precursor signatures associated with each production anomaly class. Book a Demo to review the complete edge architecture and deployment methodology for your production lines.
Mixing & Processing Stage
Temperature profiles, batch composition, mixing speed, and viscosity are modeled against downstream quality outcomes. The edge platform detects thermal and mechanical deviations that correlate with final product defects, giving supervisors 30 to 90 minutes of advance warning before quality thresholds are breached.
Filling & Sealing Zone
Fill weight, seal temperature, pressure, and headspace oxygen are correlated with leaker rates and package integrity defects. The platform's anomaly detection model identified a seal temperature drift pattern 45 minutes before it caused a measurable increase in leaker rate on the packaging line.
Packaging & Palletizing
Conveyor speed, film tension, case erector timing, and pallet stability are modeled against packaging defects and line jams. The edge platform detected a case erector timing deviation 22 minutes before a complete line jam occurred — enabling a preventive adjustment that saved 18 minutes of unplanned downtime.
14-Week Pilot: From Edge Node Installation to Autonomous Production Analytics
The pilot followed a four-phase deployment designed to establish edge connectivity, train the AI models on facility-specific production signatures, and validate forecast accuracy before transitioning to live shift-floor operation. Each phase included documented model validation steps and supervisor training sessions.
Edge Node Installation & Baseline Capture
Edge gateways deployed to production lines with OPC-UA connectors to PLCs and sensor networks. Six months of historical process data and inspection results ingested. Baseline OEE, downtime, and defect rates calculated per line and product type. Duration: 3 weeks.
Model Training & Anomaly Signature Mapping
Machine-learning models trained on 3.4 million labeled data points correlating process parameter deviations with downstream quality outcomes. Models optimized for edge inference latency — achieving sub-5-millisecond prediction times on gateway hardware. Duration: 4 weeks.
Live Edge Analytics with Supervisor Validation
Platform deployed in shadow mode alongside existing quality workflows. Anomaly forecasts generated on edge nodes and displayed via shift-floor dashboard and mobile alerts. Every alert was reviewed by the shift supervisor team. False positive rate documented at 7%. Duration: 4 weeks.
Results Analysis & Multi-Line Rollout Planning
Complete dataset analyzed for forecast accuracy, detection lead time, downtime reduction, yield improvement, and defect reduction. Deployment architecture documented for scaling across all four packaging lines and upstream processing stages. Duration: 3 weeks.
Measured Performance: Edge Computing Analytics vs. Traditional Quality Monitoring
The pilot's results demonstrated that edge-based real-time analytics consistently outperformed traditional cloud-dependent monitoring across every production category. The most significant advantage was in detection latency — supervisors received actionable forecasts an average of 47 minutes before anomalies reached the quality threshold, compared to an average post-event detection lag of 38 minutes under the previous system — effectively reversing the detection timeline by more than 85 minutes.
| Performance Metric | Traditional Cloud Monitoring | Edge Computing Analytics | Improvement |
|---|---|---|---|
| Anomaly Detection Method | Post-production lab sampling | Real-time edge inference | Pre-event vs. post-event |
| Mean Detection Latency | +38 minutes (after event) | −47 minutes (before event) | 85-minute reversal |
| Unplanned Downtime Rate | 8.5% of scheduled time | 3.6% of scheduled time | 58% reduction |
| First-Pass Yield | 81% | 93% | 12 percentage point gain |
| Quality Defect Rate | 4.7% of production | 1.7% of production | 64% reduction |
| False Alert Rate | N/A (no real-time alerts) | 7% (edge model flags) | Baseline established |
| Production Anomaly Categories | 3 (post-hoc lab analysis) | 9 (pre-event edge forecast) | 6 additional categories |
| Supervisor Interventions Guided | None by automated data | 186 guided adjustments | 100% decision support |
Our previous approach depended on sending production data to the cloud and waiting for analytics to come back. By the time we got an alert, the damage was already done — we had products in the reject bin and lost production time that we could never recover. The iFactory edge platform changed everything. Now our AI models run directly on the production floor, processing data in milliseconds and triggering corrective actions before the anomaly affects product quality. The 47-minute advance warning is the difference between managing a problem and preventing it entirely. In FMCG production, that capability transforms how we think about quality control.
Connecting Edge Analytics to the Shift-Floor Workflow
The pilot's integration architecture was designed to fit within the facility's existing automation infrastructure without requiring new sensor installations or control system modifications. iFactory's edge data ingestion layer connected to the facility's existing OPC-UA server for process data, the inline inspection system's SQL database for quality classification, and the MES for recipe and product changeover events. The platform's AI engine processed this combined data stream directly on the edge gateway hardware and delivered forecasts through a supervisor dashboard, shift-floor mobile alerts, and automated production trend reports. Book a Demo to review the integration architecture and data flow diagrams configured for your production environment.
The supervisor dashboard displays a real-time production risk score for each active anomaly category — temperature deviation, fill weight drift, seal integrity degradation, pressure fluctuation, viscosity shift, torque variation, conveyor timing offset, film tension loss, and pallet stability risk — ranked by predicted probability of exceeding the quality threshold within the next 60 minutes. Each risk indicator is linked to the process variables most likely driving the predicted anomaly, with recommended corrective actions drawn from the model's classification analysis. During the pilot, supervisors used the dashboard to prioritize their production floor interventions, focusing attention on the line and station most likely to generate defects rather than performing scheduled rounds.
For time-critical forecasts — those indicating an anomaly probability above 85% within the next 15 minutes — the platform sent structured alerts to the shift supervisor's mobile device. Each alert included the predicted anomaly type, the affected production line and station, the upstream process variable showing deviation (current value vs. optimal range), and a recommended adjustment. Supervisors acknowledged alerts and documented their response action within the platform, creating a closed-loop audit trail. During the pilot, 89% of time-critical alerts resulted in a documented corrective action, and 76% of those actions prevented the forecasted anomaly from reaching the quality threshold.
Each forecast event and supervisor response was logged in the MES as a structured production record, creating a searchable database of anomaly precursor signatures and corresponding corrective actions. This database became increasingly valuable over the pilot as the AI model incorporated supervisor response outcomes into its training set — improving forecast accuracy and reducing false positives with each weekly model refinement cycle. The integration architecture was designed to comply with the facility's existing quality management system documentation requirements without creating duplicate data entry or manual reconciliation tasks.
Forecast Production Anomalies Before They Happen — Optimize Every Shift
iFactory's Edge Computing Analytics platform connects directly to your existing production line instrumentation, inspection systems, and MES — no new sensors, no control system modifications, no data migration. Shift supervisors gain 30–60 minutes of actionable lead time to prevent downtime and quality defects.
Edge Computing Gives FMCG Manufacturers the Real-Time Analytics They Need to Optimize Production
This 14-week pilot established that edge computing analytics — combining real-time production data, on-premise AI inference, and shift-floor workflow integration — can reduce unplanned downtime by more than 58%, improve first-pass yield by 12 percentage points, reduce quality defect rates by 64%, and give supervisors 30 to 60 minutes of advance warning to make corrective adjustments before anomalies affect production quality. Unlike cloud-dependent monitoring systems that detect problems after they have already occurred, edge computing enables a proactive production management paradigm that shifts the supervisor's role from problem responder to problem preventer.
FMCG production managers and operations leaders evaluating real-time analytics technology for their facilities can reference this pilot's data to build a deployment business case grounded in measured performance. The downtime reduction, yield improvement, and defect prevention demonstrated in this pilot are achievable on any FMCG production line with existing process data collection and inline inspection capability. iFactory's Edge Computing Analytics platform provides the edge infrastructure and AI engine that connects your production line data to actionable anomaly forecasts — no new sensors required. Review the full pilot results and discuss a deployment assessment for your facility by requesting a shift-floor demo.
Edge Computing in FMCG Manufacturing — Frequently Asked Questions
The platform requires two primary data sources: real-time process parameters from the production line control system (temperatures, pressures, speeds, fill weights, torque values) and inline inspection defect classification data from the quality system at the packaging stage. Most facilities already collect this data through their existing automation and inspection infrastructure. The platform connects via OPC-UA for process data and SQL database queries for inspection data. No additional sensors are required, though incorporating offline lab measurements of product quality attributes can further improve model accuracy.
Edge analytics processes data locally on the production floor, eliminating the latency introduced by cloud round trips. Inference times on edge hardware range from 1 to 5 milliseconds, compared to 200 milliseconds to several seconds for cloud-dependent systems. Edge analytics also operates fully during network outages — all data processing, model inference, and alert generation continue without interruption. Cloud analytics provides advantages for long-term storage, cross-plant analysis, and large-scale model training, but the most effective architectures use both edge and cloud in a complementary design.
The platform ingests product change and recipe transition events from the MES and adjusts its forecast models accordingly. During the pilot, separate model parameter sets were trained for each major product category and package format, with automatic model switching triggered by MES recipe change signals. The platform also detected transition-related anomalies — such as fill weight drift caused by nozzle changeover or seal temperature recovery after a format switch — and generated specific forecasts for the transition period. Approximately 35% of the unplanned downtime reduction achieved during the pilot came from improved management of product changeover transitions.
Based on the pilot results, the manufacturer projected a four-line deployment cost of approximately $420,000 for year one, covering edge gateway hardware, platform licensing, integration engineering, model training and validation, supervisor training, and ongoing model refinement. The projected first-year net benefit was $1.6M, driven primarily by downtime cost avoidance ($720K), yield improvement value ($510K), defect reduction ($280K), and labor optimization ($90K). The resulting year-one ROI was 3.8x. Year-two and beyond projections showed increasing ROI as model accuracy improved with additional training data.
Yes. The platform is designed to complement rather than replace existing MES, SCADA, and quality management systems. Forecast alerts and supervisor response records are written to the existing quality system database via API, creating a unified production record that includes both traditional SPC data and edge analytics insights. During the pilot, the platform operated alongside the facility's existing SCADA and quality workflows — providing predictive forecasts that supervisors used to prioritize their interventions while continuing to use existing systems for post-process analysis. The integration architecture supports most major MES platforms, SCADA systems, and industrial data historians.
Review the Full Pilot Results and Build Your FMCG Edge Analytics Business Case
iFactory's Edge Computing Analytics platform connects your production line data to actionable anomaly forecasts at the edge — giving shift supervisors the lead time they need to prevent downtime and defects before they impact production. Schedule a personalized review of this pilot's complete dataset, including forecast accuracy by anomaly category, detection lead times, yield improvement trends, and scaled deployment ROI projections.