Compressed air systems account for 10 to 30 percent of total electricity consumption in the average FMCG manufacturing plant, making them the single largest energy end-use in most facilities after process heating. The United States Department of Energy estimates that 20 to 50 percent of all compressed air generated in industrial plants is lost to leaks, inefficient end-uses, and inappropriate system configuration. A systematic compressed air system audit covering generation, treatment, storage, distribution, and end-use identifies the specific losses in each segment and quantifies the energy-saving and reliability-improving opportunities that exist at every point in the system. This checklist provides the step-by-step audit framework that FMCG reliability engineers, energy managers, and plant maintenance teams use to baseline their compressed air system performance, prioritize corrective actions, and establish continuous monitoring protocols that sustain the savings over time. Every plant that completes this audit and implements the recommended actions typically recovers 15 to 35 percent of its compressed air energy costs within the first 12 months, with capital project payback periods of 6 to 24 months for the highest-impact measures.
Why Compressed Air Audits Matter for FMCG Plants
Compressed air is the most expensive utility in an FMCG plant on a per-unit-of-energy basis. The Compressed Air and Gas Institute estimates that a typical industrial compressor requires 7 to 8 horsepower of electrical input to deliver 1 horsepower of pneumatic work an efficiency of 12 to 14 percent. The remaining 86 to 88 percent of the electrical energy is converted to heat and rejected to the atmosphere through the cooling system and radiation. Every kilowatt-hour that enters the compressor room faces two conversion losses: the compressor inefficiency that wastes 85 percent as heat, and the distribution system inefficiency that wastes another 20 to 50 percent through leaks, pressure drops, and inappropriate uses. The result is that only 5 to 12 percent of the electrical energy used to generate compressed air ever performs useful work at the end-use point. An audit identifies every leak, every pressure drop, every filter restriction, every dryer malfunction, and every inappropriate end-use that drags that delivered efficiency below the plant's achievable baseline.
In FMCG plants operating multiple production lines with pneumatic actuators, blow-offs, air knives, conveying systems, and packaging equipment, the compressed air system is subject to continuous variability in demand. Production line startups, shift changes, product changeovers, and cleaning cycles all produce demand-side events that the compressor control system must respond to. The audit evaluates whether the control system architecture load/unload, variable-speed drive, or network-based sequencing is matched to the demand profile and whether the storage capacity, dryer sizing, and distribution piping are adequate for peak demand events without excessive pressure drop.
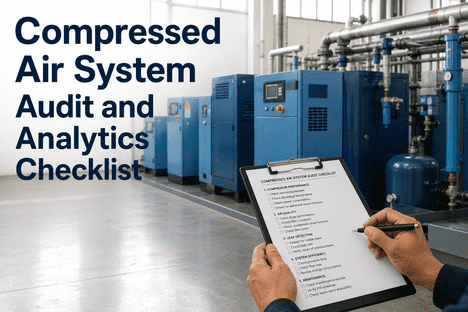
The Compressed Air Audit Checklist: Six Audit Domains
The complete compressed air system audit covers six domains. Each domain contains specific checklist items that the auditor inspects, measures, or analyzes. The checklist is designed to be applied systematically across the entire system, from the compressor inlet to the end-use point of use, with quantitative measurements taken at each stage to establish the baseline against which improvement is measured.
We completed our first full compressed air audit in Q1 2025 across three FMCG production lines. The ultrasonic leak survey found 47 leaks totaling 185 CFM — approximately 28 percent of our average system demand. The refrigerated dryer was operating at a pressure dew point of 62 degrees Fahrenheit, which meant we were sending saturated air into the distribution piping. The pressure at the furthest packaging line dropped 17 psi from the receiver outlet during peak production, forcing the compressor control pressure band to be set 22 psi wide. We repaired 39 of the 47 leaks, replaced the dryer controller, and installed a 500-gallon secondary receiver near the packaging area. Total project cost was $43,000. Our annual compressed air energy cost dropped 31 percent, saving $117,000 per year. The payback was 4.4 months.
— Plant Engineering Manager, Multinational FMCG Company — 3-Line Beverage and Snack FacilityPressure Drop Analysis: The Hidden Efficiency Killer
Pressure drop is the single most misunderstood parameter in industrial compressed air systems. Every pound per square inch of pressure drop that is caused by undersized piping, clogged filters, restricted dryers, or leaking fittings must be compensated for by raising the compressor discharge pressure setpoint. The Compressed Air Challenge training program documents that every 2 psi increase in system pressure increases compressor energy consumption by approximately 1 percent at full load. A plant with a 15 psi pressure drop across the distribution system is wasting 7.5 percent of its total compressed air energy just to overcome the resistance in the pipes and components — energy that produces no useful work at the end-use point.
The audit must measure static and dynamic pressure at key nodes throughout the system: compressor discharge, receiver outlet, dryer inlet and outlet, filter inlet and outlet, header branch points, and the furthest end-use point on each production line. The pressure differential between each pair of measurement points identifies the component or segment responsible for the drop. An audit that measures pressure only at the compressor discharge and the furthest end-use point cannot identify whether the pressure loss is in the dryer, the filter, the header, or the branch line — and therefore cannot target the corrective investment to the segment that will deliver the highest return. The pressure profile should be measured during both peak demand and low demand periods to separate fixed pressure losses from flow-dependent losses.
Leak Detection Methodology and Quantification
Leaks are the largest single source of wasted energy in compressed air systems. The DOE Compressed Air Tip Sheet on leak detection states that a single 1/4-inch diameter leak at 100 psi line pressure can lose 104 CFM of compressed air — the equivalent output of a 25-horsepower compressor running continuously. The financial impact is directly calculable: 104 CFM at 100 psi requires approximately 24 kW of electrical input, which at $0.10 per kWh costs $21,024 per year in continuous operation. A comprehensive ultrasonic leak detection survey during the audit identifies, quantifies, tags, and prioritizes every leak in the system so that repair resources are allocated to the highest-return leaks first.
Dryer and Filter System Analytics
The air treatment train — aftercooler, separator, dryer, filters — is the most commonly overlooked segment of the compressed air system during energy audits. Plant engineers focus on compressor efficiency and leak repair, but the treatment system can account for 10 to 18 percent of the total compressed air energy cost when dryers, filters, and drains are operating below design efficiency. A refrigerated dryer that is contaminated with oil on the heat exchanger surfaces, has a fouled condenser coil, or is set to an unnecessarily low dew point temperature can consume 100 to 200 percent more energy than the same dryer in clean condition. A desiccant dryer with a worn or damaged desiccant bed or an incorrectly set purge rate can waste 15 to 20 percent of the system flow as purge air.
The audit checklist for the treatment system includes measurement of dryer inlet and outlet pressure dew point temperature, filter differential pressure, condensate drain cycle frequency and duration, and dryer energy consumption in kWh per 1000 standard cubic feet of air treated. These parameters are compared against the dryer and filter manufacturer's published performance curves at the actual operating flow rate. A dryer that is oversized for the actual flow rate will have a higher energy consumption per unit of air treated than a correctly sized dryer, because the refrigeration system must reject heat at the design rate regardless of the thermal load from the air stream. Similarly, a filter element that is replaced at calendar intervals rather than differential pressure intervals may be changed before it is loaded or left in service after it has reached maximum allowable differential pressure — both outcomes are detectable during the audit and correctable through the implementation of predictive filter replacement scheduling.
Energy Optimization Strategies: From Audit to Implementation
The audit produces a prioritized list of energy-saving opportunities ranked by cost of implementation, energy savings, and payback period. The highest-return opportunities typically fall into three tiers. The first tier includes zero-cost operational measures: repairing identified leaks, resetting pressure bands, eliminating inappropriate uses, and optimizing dryer setpoints. The second tier includes low-cost engineering measures: installing secondary receivers at high-demand zones, replacing open blowing with engineered nozzles, converting timer drains to zero-loss drains, and upgrading compressor controls from individual pressure switches to network-based sequencing. The third tier includes capital projects with 12- to 24-month payback: replacing undersized distribution piping, adding VSD trim compressor capacity, installing heat recovery systems, and commissioning a system master controller with flow-based load sequencing.
Implementing Continuous Monitoring with iFactory
A compressed air audit is a point-in-time assessment. The savings from the audit are sustained only if the plant implements continuous monitoring of the key performance indicators that were measured during the baseline audit. iFactory's energy monitoring and sustainability tracking platform provides the data acquisition, visualization, alerting, and reporting infrastructure that turns the audit from a one-time event into a continuous improvement process. The system integrates with flow meters, pressure transducers, power meters, dew point sensors, and compressor controllers to provide real-time dashboards of system specific power (kW/100 CFM), system pressure profile, leak load percentage, filter differential pressure trends, and dryer energy consumption per unit volume of air treated.
The platform automatically generates work orders when filter differential pressure exceeds the 5 psi threshold, when dryer dew point rises above the setpoint, or when specific power increases beyond the baseline established during the audit. iFactory's shift logbook feature captures operator observations of unusual compressor cycling, unexpected pressure drops, or audible leaks — turning the production team into the first line of defense against compressed air system degradation between annual audit cycles. Book a demo to see how iFactory integrates compressed air audit data into ongoing energy management and sustainability reporting, or talk to an expert about setting up continuous compressed air monitoring for your FMCG facility.
Frequently Asked Questions
Conclusion
Compressed air is the most expensive utility in the FMCG plant on a per-unit-energy basis, and it is also the utility with the largest gap between current performance and achievable performance. The systematic audit framework described in this checklist — covering generation, treatment, storage, distribution, leak management, end-use, and continuous monitoring — provides the structure that energy managers and reliability engineers need to identify, quantify, prioritize, and capture the 15 to 35 percent energy savings that are available in every plant.
The plants that perform this audit annually, implement the prioritized recommendations, and establish continuous monitoring of system KPIs are the plants that operate compressed air systems at specific power below 20 kW/100 CFM, leak load below 5 percent, and system pressure drop below 10 psi. These plants spend 30 to 50 percent less on compressed air energy than their industry peers, and their compressors, dryers, and distribution systems deliver longer service life with fewer unplanned failures.
iFactory provides the integrated platform that turns the compressed air system audit from a manual data collection exercise into an engineered, data-driven, continuously improving process. From the initial audit checklist and data collection templates to real-time dashboards, automated work order generation, and sustainability reporting, iFactory ensures that every kilowatt-hour saved during the audit stays saved. Book a demo to see how iFactory integrates compressed air system management into your plant's energy and sustainability program, or talk to an expert about setting up a compressed air audit program for your FMCG facility.