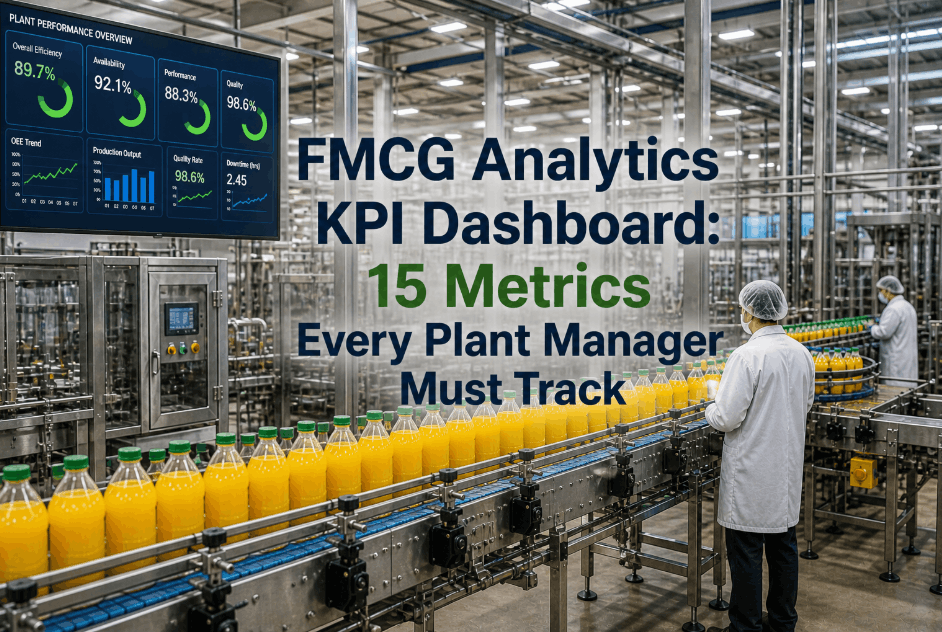
For FMCG plant managers, the challenge is no longer a lack of data, but a lack of clarity. With lines moving at breakneck speeds and multi-SKU changeovers happening daily, managing by spreadsheet is a recipe for reactive crisis management. A unified **FMCG analytics KPI dashboard** provides the "Single Source of Truth" needed to move from gut-feel decisions to data-driven operational excellence. By integrating telemetry from every filler, capper, and palletizer into a real-time intelligence layer, leadership teams can identify OEE bottlenecks and reliability gaps before they impact the bottom line. You can book a demo or consult our architects to see how a centralized dashboard delivers 360-degree visibility across your entire production fleet.
Is Your Plant Data Trapped in Silos or Driving OEE?
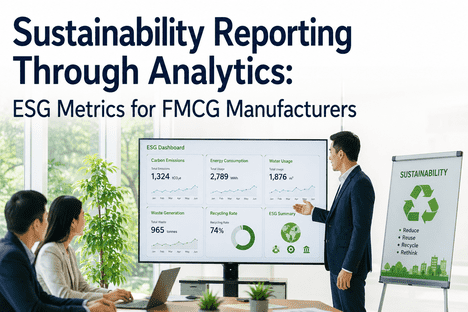
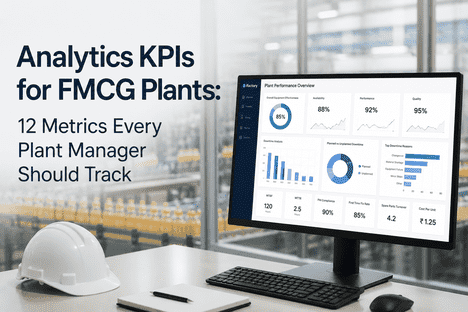
Centralize OEE, reliability metrics, and maintenance compliance into a single AI-powered dashboard for food and beverage manufacturing.
Defining the Essential KPIs for High-Growth FMCG Plants
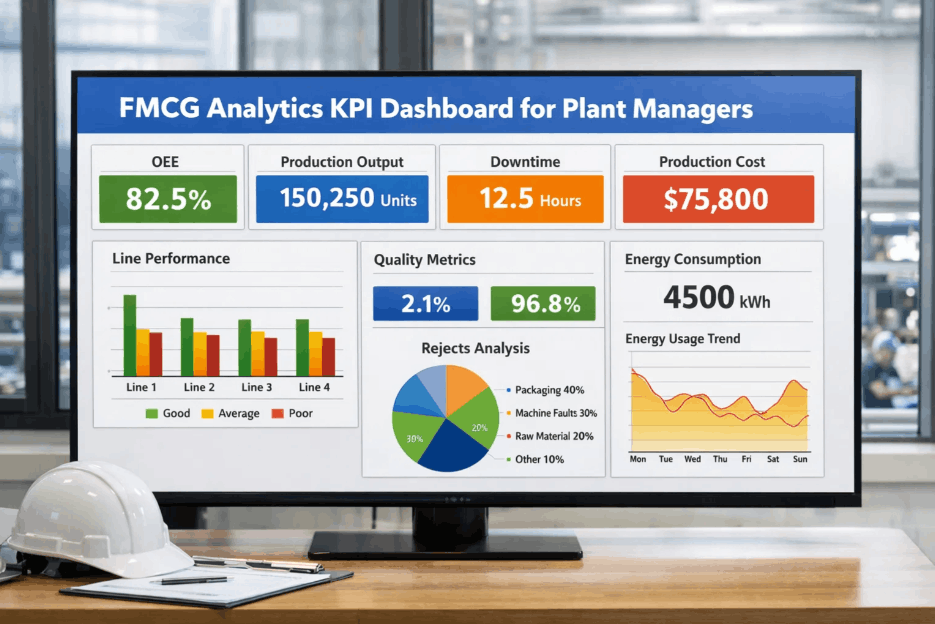
Modern **FMCG performance dashboards** must go beyond simple uptime tracking. To truly optimize a facility, plant managers need a tiered view of metrics that correlate asset health with financial output. Our integrated platform automates the collection and calculation of these KPIs, ensuring that every report is baseline-accurate and free from manual entry bias. If you'd like to book a demo, we can walk through your current data points and map them to our global benchmarking standards.
OEE Decomposition
Break down Overall Equipment Effectiveness into Availability, Performance, and Quality. Identify if your losses are coming from jams, speed-loss, or batch defects.
MTBF & MTTR
Track Mean Time Between Failures and Mean Time To Repair. Predict reliability trends and validate the effectiveness of your technical maintenance team.
Planned vs. Reactive
Monitor your PM compliance ratio. Shifting work from reactive to planned interventions is the single fastest way to reduce your maintenance OpEx.
Cost Per Unit
Correlate real-time energy draw and maintenance spend with production volume to reveal the true cost of manufacturing for every SKU in your catalog.
Legacy Reporting vs. AI-Driven Real-Time Dashboards
The transition from "looking back" at yesterday's reports to "looking forward" with real-time predictive dashboards is a fundamental shift in infrastructure management. The table below illustrates the operational delta between traditional manual systems and our integrated autonomous orchestration layer. You can consult our architects to calculate the potential ROI of eliminating data latency in your facility.
| Reporting Element | Legacy Manual System | AI-Unified Dashboard | Ops Impact |
|---|---|---|---|
| Data Latency | 24 - 48 Hours | < 1 Second (Real-time) | High |
| Accuracy | Subjective (Human Log) | Objective (Sensor-based) | High |
| Root Cause ID | Anecdotal / Guesswork | Automated Correlation | Medium |
| Scalability | Difficult (Excel-based) | Instant (Cloud-native) | Medium |
| Audit Readiness | Manual Prep Required | 100% Always-Ready | High |
Deployment Path for Enterprise FMCG Analytics Reporting
Launching a **unified KPI dashboard** for your food manufacturing facility is an iterative process that begins with high-fidelity data capture. By using non-invasive IoT sensors, you can bridge the gap between legacy PLCs and modern AI analytics without interrupting production. You can book a demo to see our 5-step implementation framework in action on a live production line.
Edge Ingestion
Connect the platform to existing PLC tags and IoT sensors. Standardize data formats across disparate vendor hardware into a unified stream.
Metric Harmonization
Define your organization's OEE and reliability logic. Ensure that "downtime" and "speed loss" are calculated identically across every plant in your fleet.
Real-Time Visualization
Deploy web-based dashboards and floor tablets. Provide operators and managers with live feedback on current performance versus shift targets.
AI-Alerting Layer
Enable predictive alerts. The platform flags metric deviations (e.g., dropping MTBF or rising energy intensity) before they trigger an E-stop.
Executive Governance
Aggregate plant-level data into global executive reports. Enable multi-site benchmarking to identify best practices and optimize CapEx allocation.
Top Challenges in Maintaining Dashboard Integrity and Actionability
Most plant managers struggle with "Dashboard Fatigue," where too much data leads to zero action. An integrated platform solves this by prioritizing "Insights over Info." Understanding these common gaps is essential for directors planning to scale their **FMCG analytics capabilities** across a national infrastructure grid.
Maintenance data in one system and production data in another, forcing managers to spend hours manual connecting dots that AI could synch in milliseconds.
Different shifts using different methods to log downtime, creating "noisy" data that hides true seasonal or hardware performance trends.
Seeing an OEE drop without knowing which SKU or material lot triggered it. Metrics without correlation are useless for root-cause analysis.
Depending on operator memory to log events. Manual logs under-report micro-stops and over-estimate performance, leading to "false comfort."
Dashboards that can't be customized for different roles. A CEO needs financial roll-ups; an operator needs real-time temperature and torque.
Dashboards that go offline during network dips. Integrated platforms must have "Edge Resilience" to ensure data integrity during outages.
Infrastructure managers can solve these gaps by moving to a unified intelligence layer. Teams frequently book a demo to benchmark their current reporting against a fully autonomous data architecture.
Analyzing Intra-Day Performance Variances
One of the most valuable insights provided by a **FMCG performance dashboard** is the identification of shift-based performance gaps. By benchmarking crews against standardized OEE targets, plant managers can identify specific training needs or tribal knowledge that is boosting performance on one shift but lacking in another. To see your plant's shift-wise variance reports, you can book a demo.
Peak Throughput
Focus on maximum line speed and production volume during high-staffed core hours. Identifying speed-loss drivers in real-time.
Operational Stability
Monitoring the transition from full-staff to lean-staff environments. Tracking how changeover efficiency maintains during the afternoon handover.
Reliability & Sanitization
Tracking critical midnight washdowns and preventative maintenance rounds. Ensuring the "Sanitation Mission" meets FDA compliance without OEE bleed.
Skeleton Fleet Ops
Managing weekend production with minimal engineering support. AI-driven guidance for autonomous troubleshooting.
Multi-Site Fleet Integration: Regional KPI Roll-Ups
For directors managing regional infrastructure, the **unified KPI dashboard** scales from a single cartoner to a global fleet. This "Control Tower" view allows for rapid benchmarking between different facilities, allowing you to move the best-performing strategies from your top plant to the rest of the network. You can consult our architects to review our multi-site data security architecture.
| Plant Location | Fleet OEE % | Energy Intensity | Audit Compliance | Predictive Grade |
|---|---|---|---|---|
| California Hub | 84.2% | Low (Solar-Edge) | A+ (Perfect) | 98.1% Acc. |
| Texas Filling 01 | 79.5% | High (Peak-Grid) | B+ (Ready) | 94.2% Acc. |
| New Jersey Logistic | 72.1% | Medium (Mixed) | C (Attention) | 88.5% Acc. |
| Atlanta Beverage | 81.3% | Medium (Mixed) | A- (Stable) | 92.8% Acc. |
Audit Readiness: Integrating EHS and Regulatory KPIs
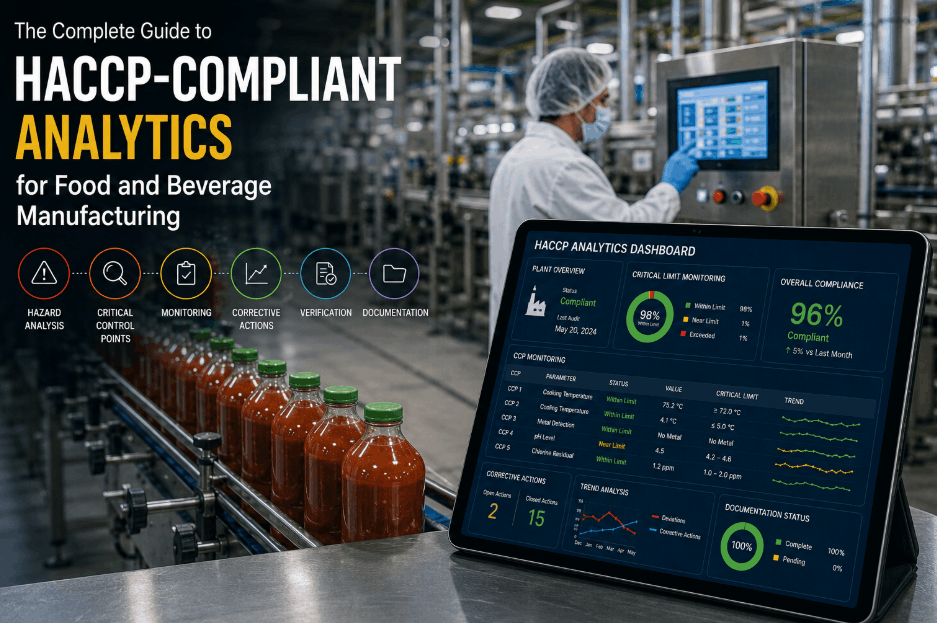
Compliance metrics are as critical as production numbers in the FMCG sector. Our dashboard automates the logging of Environmental, Health, and Safety (EHS) data, ensuring your facility is always "Audit-Ready" for FDA or OSHA inspections. Eliminating the frantic paperwork shuffle before an audit allows your team to stay focused on high-density production. Book a Demo to see our compliance audit logs.
Automated timestamps for temperature, sanitation cycles, and material lot tracing to ensure FSMA compliance across every batch.
Real-time tracking of near-misses and safety stops. AI-driven heatmaps to identify high-risk zones in the packaging floor.
Monitoring water pH, waste volume, and energy carbon-intensity to meet corporate sustainability and regulatory goals.
Checking operator certifications against current shift schedules to ensure 100% compliance with floor-safety regulations.
Predictive KPI Forecasting: Seeing Tomorrow's OEE Today
The next generation of **FMCG KPI dashboards** doesn't just show historical data; it uses AI to forecast future performance. By analyzing the "Digital Twin" of your production history, the platform can predict your month-end OEE and energy intensity with over 90% accuracy. This allows plant managers to make proactive adjustments to shift schedules, material staging, and secondary maintenance before small trends become large losses. Book a Demo to see our predictive modeling engine in action.
Own the Data, Own the Plant: Unified FMCG Analytics
Coordinate your entire production fleet in a single window to maximize OEE and minimize maintenance overhead through real-time intelligence.
Frequently Asked Questions
Can this dashboard integrate data from different machine brands?
Yes. Our platform is vendor-neutral and uses open APIs to ingest telemetry from any modern PLC (Siemens, Rockwell, etc.) as well as non-invasive IoT sensors for legacy hardware. This creates a unified view across even the most fragmented line environments.
How long does it take to deploy a multi-site KPI dashboard?
A single-line pilot is typically live in 2 weeks. Scaling to a full-plant executive dashboard usually takes 60 to 90 days, including data harmonization and custom metric definition across all departments.
What is the advantage of tracking MTTR on an FMCG dashboard?
Mean Time To Repair (MTTR) is a critical indicator of technical skill and tool availability. Reducing MTTR by just 10% can reclaim hundreds of hours of production capacity per year without any hardware CapEx. book a demo to see our reliability calculator.
Is the dashboard data secure for enterprise-scale government food labs?
Absolutely. We utilize GovCloud environments with AES-256 encryption. Every data access and modification is logged in an immutable audit trail, meeting the strictest security and compliance standards for public and regulated infrastructure.
Can I access the dashboard on mobile devices for floor-walk inspections?
Yes. The platform is mobile-native and responsive. Plant managers can pull up real-time asset health and OEE scores on any tablet or smartphone, enabling "Gemba Walks" with live data in hand.