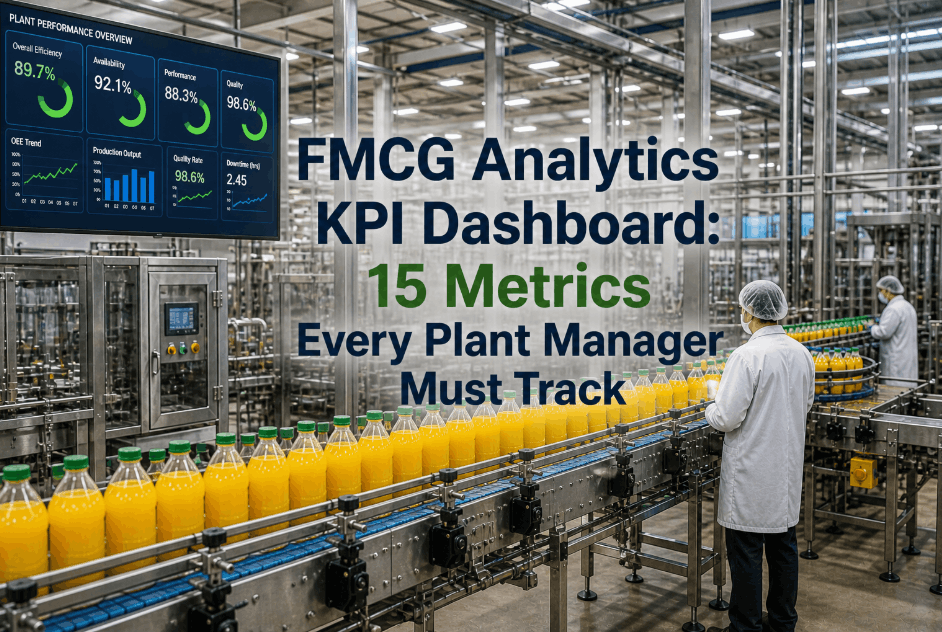
In the high-velocity world of FMCG manufacturing, intuition is no longer a competitive strategy data is. Plant managers operating without a unified analytics KPI dashboard are flying blind in an industry where every minute of downtime, every percentage point of OEE, and every unscheduled maintenance event compounds into measurable margin loss. The most successful FMCG operations in 2026 are not winning through harder work they are winning through sharper visibility. A well-architected FMCG analytics dashboard transforms raw plant-floor data into the 15 mission-critical metrics that separate top-quartile performers from struggling facilities. This guide breaks down exactly which KPIs every plant manager must track, why they matter, and how real-time analytics performance visibility drives measurable operational gains.
FMCG ANALYTICS · KPI DASHBOARD · PLANT MANAGER 2026
Build a High-Impact KPI Dashboard for Your FMCG Plant
iFactory's analytics KPI dashboard delivers real-time visibility into MTBF, MTTR, OEE, PM compliance, and 12 more mission-critical metrics purpose-built for FMCG plant managers who need decisions backed by data, not guesswork.
Why Every FMCG Plant Manager Needs an Analytics KPI Dashboard in 2026
FMCG manufacturing operates on razor-thin margins where a 2% improvement in Overall Equipment Effectiveness (OEE) can deliver millions in annual recovered value. Yet the majority of plant managers still rely on manually compiled spreadsheet reports — produced 24 to 72 hours after the events they describe. By the time a problem surfaces in a weekly report, three more shifts have passed, three more containers of product have shipped, and three more opportunities for intervention have closed. A modern analytics KPI dashboard closes this latency gap by surfacing real-time operational metrics the moment they deviate from target.
The competitive picture has shifted decisively. FMCG operations using real-time plant manager KPI dashboards report 28–34% faster decision cycles, 19–26% reductions in unplanned downtime, and 14–21% improvements in maintenance cost per unit output compared to facilities running monthly or quarterly reporting cycles. To see how leading FMCG plants are deploying real-time KPI visibility across their operations, you can book a demo with our analytics team.
34%
Faster decision cycles with real-time KPI dashboard visibility
26%
Reduction in unplanned downtime with live analytics tracking
21%
Improvement in maintenance cost per unit output
15
Critical KPIs every FMCG plant manager must track daily
Reliability Metrics
The 5 Core Reliability KPIs: MTBF, MTTR, OEE, PM Compliance, and Robot Uptime
Reliability metrics form the foundation of every credible FMCG analytics dashboard. These five KPIs answer the most fundamental questions a plant manager faces every shift: How often is equipment failing? How quickly are we recovering? How effective is our preventive maintenance? Without continuous visibility into these reliability indicators, every other operational decision is built on guesswork. To explore how reliability KPIs integrate into a unified dashboard, you can book a demo with our engineering team.
01
Mean Time Between Failures (MTBF)
MTBF tracking measures the average operating time between equipment failures and is the single most important indicator of inherent asset reliability. FMCG plants in the top performance quartile maintain MTBF figures 2.4–3.8x higher than industry averages. A declining MTBF trend is the earliest warning of degrading asset health visible in a real-time dashboard weeks before it manifests as unplanned downtime.
02
Mean Time To Repair (MTTR)
MTTR analysis measures how efficiently your maintenance team responds when failures occur. World-class FMCG operations target MTTR under 90 minutes for critical line equipment. A real-time MTTR dashboard exposes shift-level, technician-level, and asset-level variance revealing exactly where training, parts availability, or procedure documentation is bottlenecking recovery time.
03
Overall Equipment Effectiveness (OEE)
OEE dashboard visibility unifies availability, performance, and quality into a single percentage that captures the true productivity of every line. Top-quartile FMCG plants operate at 82–88% OEE, while underperforming facilities languish at 45–55%. Real-time OEE tracking exposes the precise loss bucket — micro-stops, slow cycles, or quality rejects — driving the gap between actual and theoretical output.
04
PM Compliance Rate
PM compliance rate measures the percentage of scheduled preventive maintenance tasks completed on time. Industry research shows a direct correlation: every 10% drop in PM compliance produces a 14–18% increase in unplanned downtime within 90 days. A live PM compliance dashboard ensures schedule slippage is visible immediately — not discovered during the next failure event.
05
Robot Uptime and Robotic System Availability
Robot uptime KPI tracking has become essential as FMCG operations expand robotic palletizing, packaging, and case-packing automation. Robotic system availability metrics should target 96%+ for production-critical robots. Real-time monitoring of robot uptime, cycle counts, and fault frequency prevents single-point-of-failure scenarios that can halt entire downstream packaging lines.
Workflow & Cost Metrics
5 Workflow and Cost KPIs Every Plant Manager Must Track Daily
Reliability metrics tell you how your equipment is performing — workflow and cost metrics tell you how your maintenance organization is performing. The gap between these two perspectives is where most FMCG plants leak operational value. A complete analytics KPI dashboard exposes both dimensions simultaneously, ensuring that asset health improvements translate directly into measurable cost and productivity gains.
06
Work Order Completion Rate
Work order completion rate measures the percentage of issued work orders closed within their target window. High-performing FMCG plants maintain completion rates above 92%, while struggling operations often languish below 70%. Real-time tracking exposes whether bottlenecks lie in technician capacity, parts availability, or scheduling discipline.
07
Maintenance Backlog Tracking
Analytics backlog tracking measures the cumulative hours of unaddressed maintenance work. Healthy FMCG plants maintain backlog between 2–4 weeks of crew capacity — enough to optimize scheduling, not so much that critical work is deferred. A real-time backlog dashboard prevents the silent accumulation of risk that triggers cascading failures during peak production.
08
Maintenance Cost Per Unit Output
Analytics cost per unit normalizes total maintenance spend against production volume — the single cleanest indicator of maintenance efficiency. Top-quartile FMCG operations track this metric daily and benchmark it across lines, shifts, and plants to surface anomalies before they compound into quarterly budget overruns.
09
Wrench Time Analysis
Wrench time analysis measures the percentage of a technician's shift spent performing actual hands-on maintenance versus travel, parts retrieval, paperwork, and waiting. Industry studies show average wrench time hovers around 25–35% — meaning two-thirds of skilled labor capacity is consumed by non-value activity. A real-time wrench time dashboard reveals exactly where workflow friction is destroying productivity. To see how iFactory measures wrench time automatically without manual logging,
book a demo with our team.
10
Planned vs. Reactive Maintenance Ratio
The ratio of planned to reactive maintenance hours is the clearest indicator of maintenance program maturity. World-class FMCG plants achieve 80:20 planned-to-reactive ratios, while reactive-dominant facilities operate at 40:60 or worse — paying a 3–5x cost premium for emergency interventions that proactive scheduling would have prevented entirely.
Production & Quality Metrics
5 Production and Quality KPIs That Complete the FMCG Plant Manager Dashboard
The final five KPIs in a complete FMCG analytics dashboard connect maintenance and reliability performance to the production and quality outcomes that ultimately determine commercial success. These metrics ensure that operational improvements translate into measurable business value — not just technical wins that fail to register on the P&L.
11
Throughput Rate vs. Design Capacity
Tracking actual throughput against engineered design capacity exposes the cumulative effect of micro-stops, speed losses, and changeover inefficiencies. FMCG plants frequently discover their lines are operating at 68–74% of design capacity — leaving 26–32% of latent throughput available for recovery without any capital investment.
12
First-Pass Yield (FPY) and Quality Rate
First-pass yield measures the percentage of product produced correctly the first time — without rework, recheck, or rejection. Real-time FPY tracking on the plant manager KPI dashboard exposes drift in process parameters before quality failures cascade into batch losses or customer complaints.
13
Changeover Time and SMED Performance
Changeover efficiency directly determines flexible production capacity. Top-quartile FMCG operations execute SKU changeovers in 18–35 minutes, while underperforming facilities require 90–180 minutes for identical transitions. Real-time changeover tracking exposes the steps consuming the most time and the operators executing them most efficiently.
14
Spare Parts Inventory Turn Rate
Spare parts inventory often represents 8–14% of total maintenance budget — yet most FMCG plants operate with 30–50% excess inventory due to safety-stock decisions made without analytics support. A live inventory turn dashboard exposes overstocked SKUs, understocked critical parts, and consumption anomalies that signal upstream reliability issues.
15
Energy Consumption Per Unit Produced
Energy cost per unit is becoming a board-level metric as FMCG manufacturers face escalating utility costs and Scope 1/2 emissions reporting mandates. Real-time energy tracking exposes degraded asset performance — motors, compressors, and HVAC systems consuming 12–22% more energy than baseline indicate maintenance interventions that pay for themselves in weeks.
Benchmark Data
FMCG Analytics KPI Dashboard — Top-Quartile vs. Industry Average Benchmarks
The following benchmark table compares performance ranges across the 15 critical KPIs every FMCG plant manager should track. The gap between top-quartile and industry-average operations reveals the magnitude of opportunity available through systematic analytics KPI dashboard deployment. To benchmark your own facility against these targets, you can book a demo for a personalized assessment.
FMCG Plant Manager KPI Benchmark — 2026 Performance Targets
Implementation Strategy
How to Deploy an FMCG Analytics KPI Dashboard in 90 Days
Deploying a unified analytics KPI dashboard across an FMCG operation does not require a multi-year transformation program. Plant managers can achieve full live KPI visibility within 90 days using a phased deployment approach that delivers measurable ROI at each stage. The key is sequencing — establishing data infrastructure foundations before layering analytics, and validating each KPI source before adding dependent metrics.
Days 1–30
Data Foundation and Critical KPI Activation
Audit existing CMMS, SCADA, and ERP data sources. Connect the analytics platform to primary data feeds and activate the five reliability KPIs first — MTBF, MTTR, OEE, PM compliance, and robot uptime. Validate data accuracy at the source and establish performance baselines for every critical asset.
Outcome: Live reliability KPI dashboard, validated data sources, baseline metrics
Days 31–60
Workflow and Cost KPI Integration
Layer in workflow and cost metrics — work order completion, maintenance backlog, cost per unit, wrench time, and planned-to-reactive ratio. Integrate parts inventory and labor reporting systems. Begin shift-level KPI reviews using live dashboard data and document the first wave of intervention opportunities.
Outcome: Complete maintenance KPI visibility, shift-level reviews active, intervention pipeline
Days 61–90
Production Integration and Continuous Improvement
Connect production and quality systems to complete the 15-KPI dashboard. Activate throughput, first-pass yield, changeover, inventory turn, and energy consumption tracking. Roll out plant-wide visibility, train shift leads on dashboard interpretation, and establish weekly KPI review cadence with documented improvement targets.
Outcome: Full 15-KPI dashboard live, trained operators, structured improvement cadence
Frequently Asked Questions
FMCG Analytics KPI Dashboard — Frequently Asked Questions
What are the most important KPIs for an FMCG plant manager to track daily?
The five non-negotiable daily KPIs are OEE, MTBF, MTTR, PM compliance rate, and unplanned downtime. These five metrics expose 80% of operational performance variance and should be visible on every plant manager's dashboard in real time.
How is OEE calculated on a real-time analytics dashboard?
OEE = Availability × Performance × Quality. A live OEE dashboard calculates each component automatically from sensor data, MES inputs, and quality system feeds — eliminating manual data entry and producing OEE values updated every minute or less.
What is a healthy MTBF target for FMCG packaging equipment?
Top-quartile FMCG packaging operations maintain MTBF figures of 650–950 hours for high-speed lines. Industry averages typically run 180–280 hours — meaning a 2.4–3.8x improvement opportunity exists for most facilities through targeted reliability programs.
How does PM compliance rate affect overall plant performance?
Every 10% drop in PM compliance rate produces a 14–18% increase in unplanned downtime within 90 days. Maintaining PM compliance above 94% is one of the highest-leverage actions a plant manager can take.
How long does it take to deploy a complete FMCG analytics KPI dashboard?
Most FMCG plants achieve full 15-KPI dashboard visibility within 90 days using a phased deployment — reliability metrics in days 1–30, workflow and cost metrics in days 31–60, and production and quality metrics in days 61–90.
Can analytics dashboards integrate with existing CMMS and ERP systems?
Yes. Modern FMCG analytics dashboards include pre-built connectors for SAP, Oracle, IBM Maximo, Rockwell, and Wonderware. Existing systems continue running while the analytics layer normalizes data without rip-and-replace disruption.
FMCG ANALYTICS · 15 KPIs · PLANT MANAGER DASHBOARD 2026
Deploy Your FMCG Analytics KPI Dashboard in 90 Days
iFactory's purpose-built KPI dashboard delivers real-time visibility into all 15 mission-critical FMCG metrics — MTBF, MTTR, OEE, PM compliance, robot uptime, backlog, costs, and more — empowering plant managers to make data-driven decisions every shift.