In 2026, FMCG manufacturers are no longer asking whether to invest in analytics — they are asking which analytics strategy delivers the highest return. The choice between preventive, predictive, and robotic analytics directly shapes plant uptime, quality consistency, and total maintenance cost. Understanding how these three approaches compare is the single most consequential operations decision a consumer goods plant director can make this year. To see how iFactory's analytics strategy planning module maps to your specific facility profile, Book a Demo with our manufacturing intelligence team.
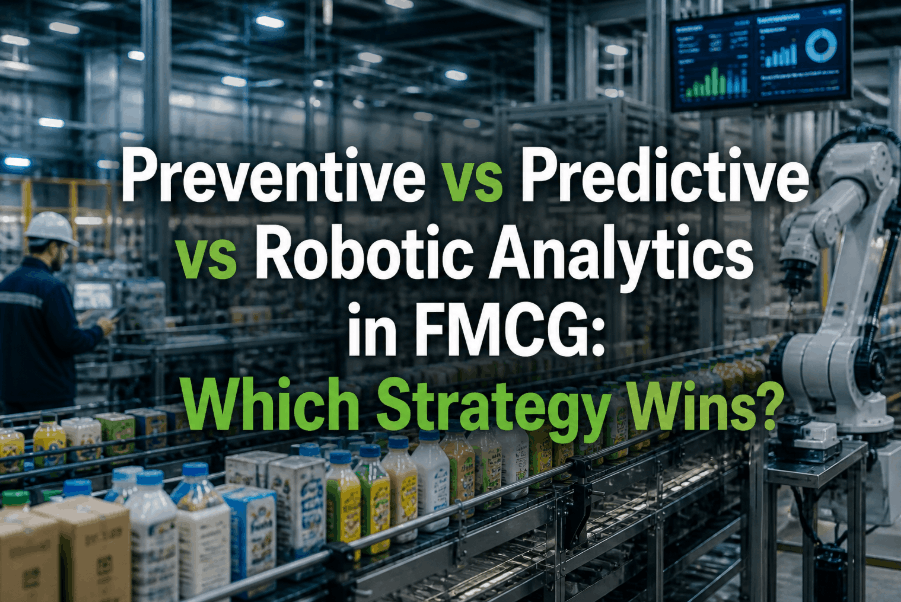
Preventive vs Predictive vs Robotic Analytics in FMCG: The Core Distinctions
Why Your Analytics Strategy Choice Defines Plant Performance in 2026
The FMCG sector has historically operated on calendar-based preventive analytics — replacing components at fixed intervals regardless of actual asset condition. This approach eliminates catastrophic failure risk but systematically over-services healthy equipment and under-services assets that degrade faster than scheduled intervals predict. Predictive analytics inverts this model entirely: machine learning algorithms analyze real-time sensor data to forecast failure windows with 14 to 60-day accuracy, enabling intervention precisely when required. Robotic analytics adds a third dimension — autonomous inspection platforms that traverse production environments continuously, capturing thermal, acoustic, and vibration data that fixed sensor arrays cannot reach. FMCG facilities that have deployed iFactory's analytics strategy planning module consistently migrate from single-strategy approaches to layered frameworks that apply each method to the asset class it serves best.
Preventive Analytics in FMCG: Reliable but Operationally Expensive
Where Calendar-Based Analytics Still Has a Role — and Where It Doesn't
Preventive analytics remains the dominant approach in FMCG globally because it integrates cleanly with existing CMMS platforms, requires no AI infrastructure, and delivers a predictable compliance documentation trail for BRC, SQF, and FSMA audit purposes. The operational cost, however, is substantial. Industry benchmarks consistently show that 30 to 40 percent of preventive analytics tasks are performed on assets that did not yet require intervention — generating labor cost, parts consumption, and production downtime with no asset life extension benefit. For low-criticality assets in ambient-temperature packaging lines, preventive schedules are an appropriate strategy. For high-duty-cycle filling equipment, homogenizers, and pasteurizers operating in washdown environments, calendar-based intervals systematically generate both over-service waste and failure-between-service risk. The cost differential between preventive-only and hybrid analytics strategies in comparable FMCG facilities typically ranges from $180,000 to $420,000 annually per site — a figure that funds predictive analytics platform investment with ROI remaining after cost offset.
Predictive Analytics in FMCG: AI-Driven Condition Monitoring at Scale
How Machine Learning Transforms Analytics Strategy for Consumer Goods Manufacturing
Predictive analytics represents the most significant shift in FMCG analytics strategy in the last decade. By deploying vibration sensors, thermal imaging arrays, oil analysis telemetry, and acoustic emission detectors across critical processing assets, AI models continuously learn the normal operating signature of each machine and detect deviation patterns that precede failure. The business case is compelling: documented FMCG deployments show predictive analytics cuts analytics costs by 25 percent compared to preventive schedules while simultaneously reducing unplanned downtime by 22 to 38 percent. The mechanism is straightforward — intervention happens once, at the optimal point before failure, rather than repeatedly at calendar intervals. FMCG plant directors evaluating predictive analytics implementation should Book a Demo to see how iFactory's FMCG-specific predictive models perform on food processing equipment classes. The critical requirement for FMCG environments specifically is model training on food and beverage equipment duty cycles — generic industrial predictive models do not account for CIP cycles, temperature shock from washdown, or the start-stop profiles of packaging line equipment. Purpose-trained FMCG predictive models consistently outperform horizontal industrial models by 18 to 31 percent on food processing asset classes.
Robotic Analytics in FMCG: Autonomous Inspection for 24/7 Coverage
Where Robotic Inspection Platforms Add Value Fixed Sensors Cannot Deliver
Robotic analytics — the deployment of autonomous inspection robots on production floors — solves a fundamental limitation of fixed sensor infrastructure: coverage gaps. Fixed sensors instrument specific measurement points on specific assets. Large FMCG production halls contain hundreds of assets, structures, pipelines, and conveyor systems that cannot economically be instrumented with fixed sensors at every relevant measurement point. Autonomous inspection robots equipped with thermal cameras, acoustic sensors, LiDAR, and gas detection traverse the production environment continuously, capturing data from the full asset population rather than a predetermined sensor network. The strategic advantage is 24/7 monitoring coverage with no shift gaps — a critical requirement for FMCG facilities running lights-out production shifts or operating in regulated environments where human inspection frequency is contractually mandated.
Robotic analytics platforms in FMCG deliver three specific capabilities that fixed sensor arrays cannot replicate: detection of thermal anomalies in electrical switchgear and motor control centers across the full facility footprint; acoustic monitoring of bearing and gear health on assets located in access-restricted or hygiene-zoned production areas; and gas and refrigerant leak detection across large cold storage and processing environments. FMCG operations leaders ready to explore robotic inspection integration can Book a Demo with iFactory's automation team to see how autonomous inspection data integrates with predictive AI models for a unified asset health picture.
Analytics Strategy Comparison: Preventive vs Predictive vs Robotic for FMCG
A Data-Driven Framework for FMCG Analytics Strategy Decision-Making
Selecting the optimal analytics strategy mix for a FMCG facility requires evaluating each approach across the dimensions that drive production outcomes and total cost of ownership. The comparison below maps all three strategies against the evaluation criteria that matter most for consumer goods plant directors and reliability engineering teams.
| Evaluation Dimension | Preventive Analytics | Predictive Analytics | Robotic Analytics |
|---|---|---|---|
| Failure Prevention Accuracy | Moderate (Schedule-Dependent) | High (AI Model-Driven) | High (Continuous Coverage) |
| Analytics Cost Efficiency | Low (Over-Service Waste) | High (Need-Based Only) | Medium (Hardware Investment) |
| Unplanned Downtime Reduction | Partial | 22–38% Documented | Complements Predictive |
| Production Floor Coverage | Asset-Specific | Sensor-Network Limited | Full Facility Traversal |
| FMCG Compliance Audit Readiness | Strong Calendar Records | AI-Documented Evidence | Supplementary Data |
| Lights-Out Production Suitability | Not Suitable | Partial (Fixed Sensors) | Purpose-Built |
| AI Infrastructure Requirement | None | Moderate | Moderate-High |
| FMCG 3-Year ROI Profile | Lowest | Highest (Standalone) | Highest (Combined) |
| Implementation Timeline | Immediate | 4–12 Weeks | 8–16 Weeks |
The Hybrid Analytics Strategy: Why FMCG Leaders Are Combining All Three Approaches
Reliability-Centered Analytics Frameworks for Consumer Goods Manufacturing in 2026
The most operationally advanced FMCG facilities in 2026 are not choosing between preventive, predictive, and robotic analytics — they are applying each strategy to the asset class and production context it serves best. This reliability-centered analytics framework assigns preventive schedules to low-criticality assets where failure consequence is minimal and replacement cost is low. It deploys predictive AI models on high-criticality processing equipment where failure causes significant downtime cost, quality risk, or safety exposure. It layers robotic inspection across the full production floor to capture the coverage gaps that fixed sensor networks leave open. The combination delivers documented OEE improvements of 29 to 38 percent — significantly higher than any single strategy achieves in isolation. FMCG plant directors ready to develop a reliability-centered analytics strategy for their specific facility should Book a Demo with iFactory's manufacturing intelligence team to receive an asset classification framework built from your production data.
Condition-Based vs Reactive Analytics: The Hidden Cost of Doing Nothing
Why Reactive Analytics Is the Most Expensive FMCG Strategy in 2026
While the preventive vs predictive vs robotic analytics debate captures most of the strategic conversation, the most costly analytics strategy in FMCG remains the default for a significant portion of consumer goods manufacturers: reactive analytics — responding to failures after they occur. Reactive analytics generates emergency labor premiums, expedited parts procurement costs, extended production downtime, and secondary damage to connected equipment that can multiply the base repair cost by three to seven times. FMCG facilities operating primarily on reactive analytics report analytics costs consuming 12 to 18 percent of plant revenue — compared to 3 to 6 percent for facilities operating hybrid proactive analytics strategies. The transition from reactive to condition-based or predictive analytics consistently delivers payback within 8 to 14 months in documented FMCG deployments.
FMCG Analytics Strategy Implementation: 4 Steps to the Right Mix
A Practical Framework for FMCG Plant Directors and Reliability Engineering Teams
Common Mistakes in FMCG Analytics Strategy Selection
Procurement Pitfalls That Undermine Analytics ROI in Consumer Goods Manufacturing
Frequently Asked Questions: Preventive vs Predictive vs Robotic Analytics in FMCG
What is the main difference between preventive and predictive analytics in FMCG?
Preventive analytics follows fixed calendar-based service intervals regardless of asset condition, generating over-service waste on healthy equipment. Predictive analytics uses machine learning models analyzing real-time sensor data to forecast failure windows, enabling intervention only when genuinely required — reducing analytics cost by 25 percent on average while improving failure prevention accuracy.
How does robotic analytics add value beyond predictive analytics in FMCG plants?
Robotic inspection platforms traverse the full production floor, capturing thermal, acoustic, and gas data from assets that cannot be economically instrumented with fixed sensors. They provide 24/7 monitoring coverage with no shift gaps, making them particularly valuable for lights-out production environments and large-footprint FMCG facilities where fixed sensor networks leave significant coverage gaps.
What analytics strategy delivers the highest ROI for FMCG manufacturers?
Documented FMCG deployments show hybrid strategies combining predictive analytics for high-criticality assets and robotic inspection for full-facility coverage deliver the highest ROI — typically 29 to 38 percent OEE improvement with full payback within 8 to 14 months. Standalone predictive analytics delivers the highest ROI among single-strategy approaches at 25 percent cost reduction versus preventive-only models.
Is preventive analytics still relevant in FMCG manufacturing in 2026?
Yes — preventive analytics remains the appropriate strategy for low-criticality, stable-duty assets where failure consequence is minimal. The error most FMCG facilities make is applying preventive schedules uniformly across their entire asset population, including high-criticality processing equipment where predictive analytics delivers substantially better outcomes at lower total cost.
How long does it take to implement predictive analytics in an FMCG plant?
Purpose-built FMCG predictive analytics platforms deliver initial failure prediction insights within 4 to 8 weeks of sensor data ingestion. Full deployment including CMMS integration, operator workflow configuration, and AI model calibration typically completes within 8 to 16 weeks depending on facility complexity and existing data infrastructure quality.
What FMCG equipment types benefit most from predictive analytics?
High-criticality FMCG processing equipment generates the highest predictive analytics ROI: filling lines, cappers, homogenizers, pasteurizers, heat exchangers, compressors, and packaging line drive systems. These assets combine high failure consequence with variable-duty cycles that calendar-based preventive schedules cannot serve accurately.