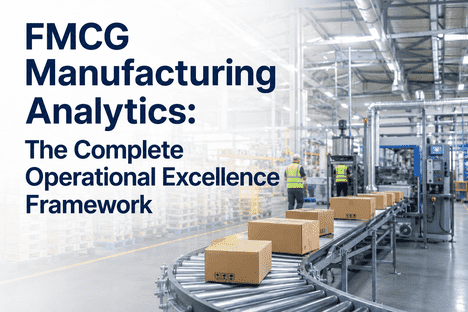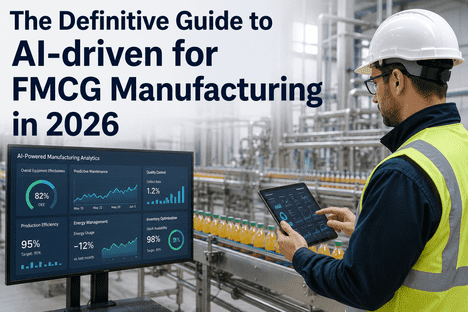
Overall Equipment Effectiveness (OEE) has become the defining performance metric for FMCG manufacturers competing in an era of compressed margins and unforgiving consumer demand. World-class OEE in manufacturing sits at 85% — yet the average food and beverage facility operates at just 60%, leaving a significant gap of measurable, recoverable value trapped inside every production line. For plant managers and operations directors ready to close that gap, Book a Demo to see how AI-powered OEE dashboards deliver real-time visibility across availability, performance, and quality — the three pillars that determine whether your factory is winning or losing on the floor.
What Is OEE and Why Does It Matter in FMCG Manufacturing?
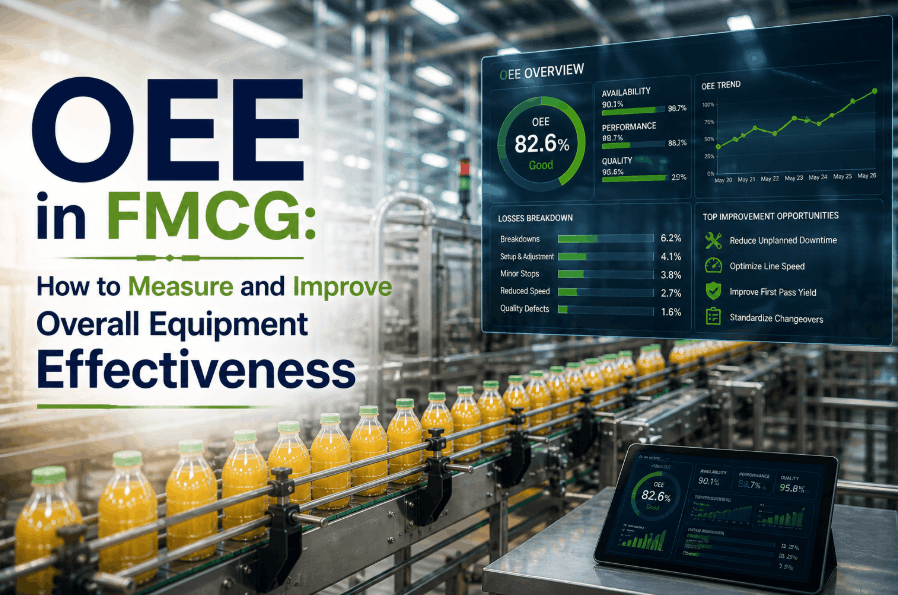
Overall Equipment Effectiveness is a composite metric that quantifies how efficiently a manufacturing facility uses its equipment relative to its full potential. In the FMCG sector, OEE in food manufacturing is the single most actionable number available to operations leadership — it captures lost time, lost speed, and lost quality in a single percentage that every department can rally around. An OEE score of 100% would mean a line runs without any unplanned stops, at full theoretical speed, producing zero defects. In reality, even world-class FMCG operations target 85%, while typical facilities hover between 55% and 65%. That 20-point gap represents millions of units of unrecovered capacity annually.
The OEE Calculation Formula for FMCG Facilities
The OEE calculation in FMCG follows a straightforward multiplication of three independent factors — each of which must be measured, tracked, and improved separately to move the overall number. Understanding each component is the foundation of any effective OEE improvement program in consumer goods manufacturing.
Measures losses from unplanned downtime, equipment failures, and changeover time. In FMCG, frequent SKU changeovers are the primary availability killer — AI-driven scheduling can reduce changeover time by up to 35%.
Captures speed losses — micro-stops, reduced cycle times, and operator-induced slowdowns. FMCG lines routinely run at 70–80% of rated speed due to undetected micro-stops that individually seem trivial but compound dramatically.
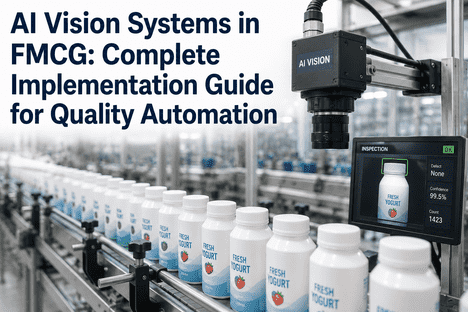
Reflects losses from defects, rework, and startup scrap. AI-powered robotic quality inspection systems now catch fill-weight deviations, seal failures, and label misalignments at full line speed — dramatically improving first-pass quality yield.
OEE Benchmarks for Consumer Goods Manufacturing
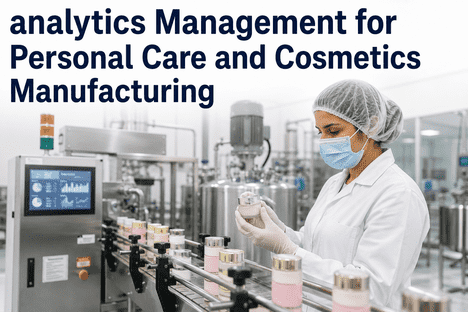
Understanding where your OEE score sits relative to industry benchmarks is essential for prioritizing investment and setting realistic improvement targets. The benchmarks below reflect published data from food, beverage, and personal care manufacturing environments — the core FMCG verticals where OEE monitoring dashboards are delivering measurable competitive advantage. If your facility falls below the typical range, Book a Demo to receive a customized OEE gap analysis benchmarked against your specific production environment.
The Six Big Losses Destroying OEE in FMCG Plants
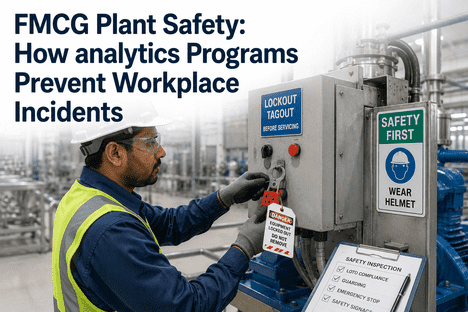
The six big losses framework — established by the Total Productive Maintenance methodology — categorizes every source of OEE degradation into six discrete loss types. In FMCG manufacturing, these losses manifest with particular intensity due to high-speed lines, diverse SKU portfolios, and strict hygiene and regulatory requirements. Identifying which of the six big losses dominates your facility is the fastest path to targeted OEE improvement in consumer goods manufacturing.
Unplanned breakdowns that halt production entirely. AI predictive maintenance models trained on vibration, temperature, and motor current data predict failures 30–90 days in advance — converting reactive repairs into scheduled interventions.
Time lost during changeovers, format adjustments, and product transitions. FMCG lines with 20+ SKU changeovers per week accumulate 8–12 hours of avoidable downtime monthly from unoptimized setup sequences.
Brief stoppages under five minutes that individually seem negligible but collectively consume 15–25% of available runtime on high-speed packaging lines. Real-time OEE monitoring dashboards surface these patterns automatically.
Operating below the equipment's rated capacity due to material variability, operator caution, or unresolved mechanical issues. Cobot-assisted analytics systems continuously measure actual versus rated throughput and flag chronic underperformance.
Scrap and rework generated during the startup phase following a changeover or breakdown restart. AI-driven process parameter optimization significantly compresses startup scrap by pre-conditioning equipment to target specifications before production commences.
Defective output produced during stable-state production — fill-weight deviations, seal failures, and label errors. Robotic quality inspection with computer vision now inspects 100% of output at full line speed, eliminating the sampling gaps that allow defects to escape.
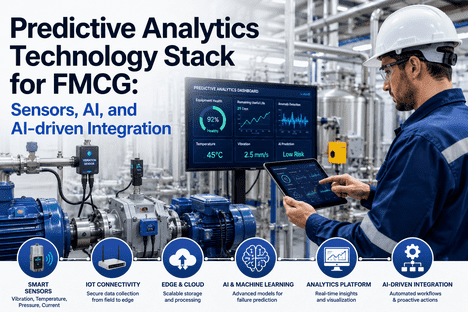
How AI-Powered OEE Dashboards Transform Real-Time Operations Visibility
Traditional OEE reporting in FMCG relied on manual data collection, end-of-shift reporting, and spreadsheet aggregation — a process that delivered insights days or weeks after the losses had already occurred. AI-driven OEE reporting platforms replace this lag with continuous, automated data ingestion from production sensors, CMMS systems, and quality inspection outputs — delivering live OEE scores at the line, cell, and facility level. Plant managers who previously made decisions based on yesterday's numbers are now responding to deviations in real time, before a micro-stop cascade becomes a full shift loss. To see how a live OEE dashboard maps onto your facility's asset profile, Book a Demo and receive a personalized platform walkthrough.
Key Capabilities of a World-Class OEE Monitoring Dashboard
The most effective OEE monitoring systems deployed across FMCG facilities share a common set of capabilities that separate genuine operational intelligence from passive data display. These are the features that convert dashboard data into production decisions.
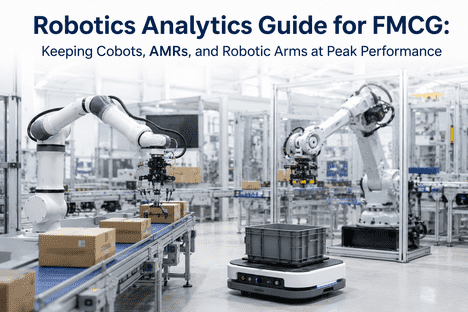
Cobot-Assisted Analytics and Robotic Quality Inspection: The OEE Multiplier
Collaborative robotics integrated with AI analytics represent the most significant OEE improvement lever available to FMCG manufacturers in the current technology cycle. Cobot-assisted analytics systems combine physical automation with machine learning intelligence — continuously monitoring process parameters, collecting quality data, and triggering corrective actions without requiring manual intervention. Robotic quality inspection systems using computer vision now routinely achieve defect detection rates that manual inspection cannot approach, particularly at modern FMCG line speeds of 400–1,200 units per minute. The direct OEE impact: quality rates that previously ranged from 94% to 97% consistently reach 99%+ under AI-driven robotic inspection regimes, and facilities serious about reaching world-class OEE benchmarks increasingly treat these systems as prerequisites rather than optional enhancements. Ready to map these capabilities to your production environment? Book a Demo for a facility-specific OEE improvement roadmap.
OEE Improvement Results: What Leading FMCG Manufacturers Are Achieving
The performance outcomes below reflect published benchmarks from food, beverage, and personal care manufacturers that have deployed integrated AI-driven OEE platforms across single and multi-site production networks. These are the numbers that define the competitive separation between AI-enabled facilities and those still operating on legacy management systems.
Implementing OEE Measurement: A Structured Deployment Path for FMCG Plants
FMCG manufacturers that achieve and sustain world-class OEE benchmarks share a structured, phased approach to deploying measurement infrastructure and AI analytics. The sequence below reflects the deployment methodology proven across food, beverage, and personal care manufacturing environments — from initial data audit through full multi-line OEE optimization. For a step-by-step implementation roadmap tailored to your facility's asset profile, Book a Demo with our operations engineering team.
Existing OEE data is audited across all production lines. IoT sensors are installed on Tier 1 assets. Baseline availability, performance, and quality rates are recorded before any AI model activation — establishing the improvement baseline that all subsequent ROI measurement references.
FoundationLive OEE scoring begins at the line level. Six big losses categorization is automated from sensor and CMMS data. First anomaly alerts surface within 30 days. Plant managers begin receiving shift-level OEE reports automatically — replacing manual spreadsheet compilation entirely.
First Insights LivePredictive maintenance models are trained on historical failure data. Robotic quality inspection outputs are integrated into the quality rate calculation. First measurable OEE improvements are recorded — typically 8–15% availability gains from predictive downtime prevention within this window.
ROI BeginsAI-driven OEE reporting rolls out across all lines and facilities. Multi-site benchmarking dashboard enables cross-plant performance comparison. Continuous closed-loop optimization drives availability, performance, and quality rates toward world-class 85%+ targets. Facilities at this stage consistently report 30–50% unplanned downtime reduction.
World-Class OEE