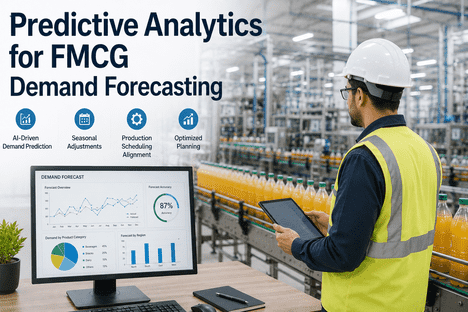
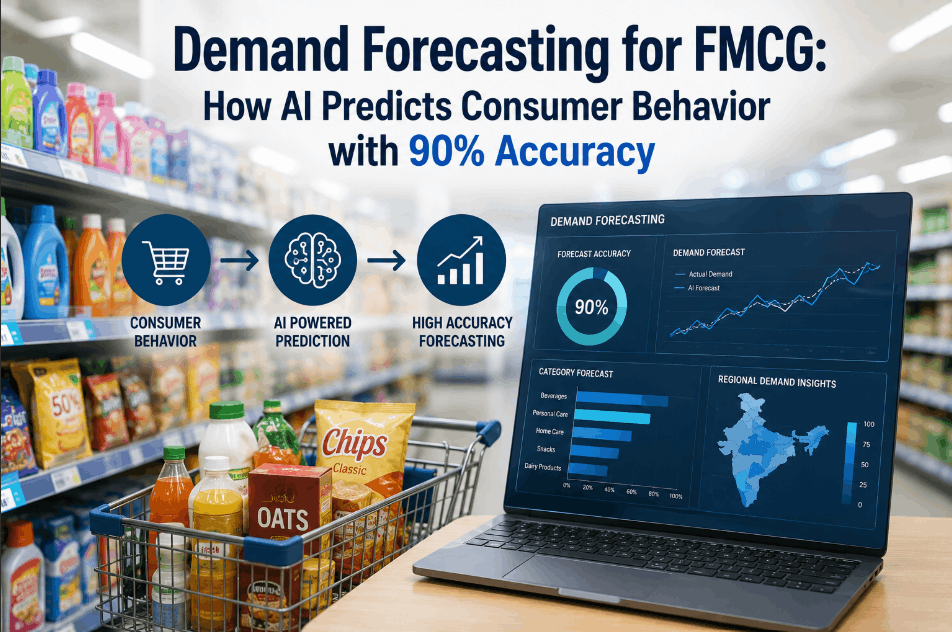
An FMCG manufacturer with 12,000 SKUs across 600 retail stores generates 3.8 million weekly sales transactions and still plans production from a spreadsheet last updated three weeks ago. The demand planner adjusts last year's numbers by a seasonal factor, adds a guess for the upcoming promotion, and sends the forecast to production. The plant runs what the spreadsheet says. Four weeks later, the warehouse has pallets of slow-moving inventory stacked to the ceiling while the retailer's top-selling SKU sits on a 14-day backorder. Inaccurate demand forecasting is not a planning problem. It is a cost problem that runs through every layer of the FMCG supply chain excess inventory carrying costs, expedited freight charges, lost revenue from stockouts, and waste from expired or damaged goods. According to the 2025 State of Food Manufacturing survey, budget constraints are the primary barrier to technology adoption for 57% of manufacturers, yet those that deploy AI-driven demand forecasting reduce forecast error by 22% and cut product waste by 15%. This guide covers the models, data architecture, and deployment strategies that make predictive analytics for FMCG demand forecasting work at production scale from LSTM networks and ensemble methods to real-time demand sensing and production scheduling integration. Traditional demand forecasting relies on backward-looking statistical methods ARIMA, exponential smoothing, moving averages that extrapolate historical patterns under the assumption that the future will resemble the past. In FMCG, that assumption rarely holds. A viral social media post can shift demand 30-40% in a week. A competitor's promotion, a weather event, a supply disruption at a key supplier each creates demand volatility that traditional models cannot anticipate because they have no mechanism to ingest external signals. Modern AI-driven predictive analytics replaces this static approach with a dynamic forecasting framework that continuously ingests multiple data streams point-of-sale data, promotional calendars, weather forecasts, economic indicators, social sentiment, and competitor pricing and produces probabilistic forecasts that express not just what demand will be, but the range of possible outcomes and their likelihood. The result is a fundamental shift in planning capability from asking "what will happen?" to asking "what should we do about it?"
AI DEMAND FORECASTING PLATFORM
Stop Forecasting From Spreadsheets. Start Predicting From Data.
iFactory's predictive analytics platform ingests POS data, promotional calendars, weather signals, and production constraints delivering SKU-level probabilistic forecasts that connect directly to production scheduling and inventory planning.
22%
Average MAPE reduction from AI-powered demand forecasting vs traditional statistical methods
92%
Forecast accuracy achieved by leading AI models compared to 75% for traditional approaches
15%
Product waste reduction from improved forecast precision in food and beverage manufacturing
90%
Forecast accuracy improvement reported by Danone after deploying AI-driven demand planning
THE FORECASTING TECHNOLOGY STACK
How AI Predictive Analytics Replaces Gut-Feel Demand Planning
An AI demand forecasting system for FMCG is not a single model. It is a layered architecture of data ingestion, feature engineering, model selection, and forecast integration each layer with specific requirements that determine whether the system delivers production-grade accuracy or produces academic outputs that planners ignore.
D
Data Ingestion Layer
Internal and external signal collection
Input Sources
Historical POS and sales order data at SKU-store-week granularity
Promotional calendars with lift factors, timing, and cannibalisation effects
Weather data — temperature, precipitation, seasonal indices
Economic indicators — CPI, commodity prices, consumer confidence
Social sentiment and search trend data (Google Trends, social media)
Inventory levels, supplier lead times, and production capacity constraints
Pricing data — RRP, discount depth, competitor price tracking
Key Requirement
50+ external signal types processed through automated pipelines with quality checks and missing-value imputation — LatentView ConnectedView benchmark
F
Feature Engineering
Transforming raw data into predictive signals
Engineered Features
Lag features — sales at t-1, t-7, t-14, t-28 days capturing recent trends
Rolling statistics — 7-day and 28-day moving averages and standard deviations
Calendar features — day-of-week, month, holiday proximity, Ramadan, payday periods
Promotion features — baseline vs promotion period flags, discount depth, duration
STL decomposition — separating trend, seasonal, and residual components
Interaction features — price-promotion-season combinations
Key Requirement
RF-RFE (Random Forest Recursive Feature Elimination) reduces dimensionality by 30-50% while preserving predictive power — validated on FMCG datasets
M
Model Architecture
Ensemble and deep learning frameworks
Primary Models
LSTM with Attention — captures long-range dependencies in sequential demand data plus external indicator fusion; 24.6% MAPE reduction vs ARIMA
LightGBM / CatBoost — gradient boosting on tabular features, outperforms SARIMA by 67% MAPE reduction on FMCG datasets (2.70% vs 8.19%)
Prophet — handles seasonality and holiday effects, interpretable decompositions
Hybrid Ensemble — CNN+RNN+LSTM+XGBoost with adaptive weighting; 92.9% RMSE reduction vs standalone ARIMA
DCSInformer — dilated causal convolution for multi-scale temporal patterns; 35.9% MSE reduction on medium-term FMCG forecasts
Key Requirement
Ensemble models with dynamic weighting outperform any single architecture — adaptive weighting mechanisms maintain accuracy across demand volatility regimes
O
Forecast Optimisation & Output
From predictions to production decisions
Output Capabilities
Probabilistic forecasts (P10/P50/P90) — expresses uncertainty range, not a single number
Multi-horizon forecasting — daily, weekly, monthly views aligned to planning cycles
SKU-store-region disaggregation — top-down and bottom-up reconciliation
Promotion uplift and cannibalisation quantification — separates true lift from baseline volume
Inventory optimisation — EOQ, safety stock, and replenishment recommendations from forecast outputs
Production scheduling integration — forecast directly feeds MES and production planning systems
Key Requirement
Forecast-to-work-order automation — no manual re-entry between forecast output and production schedule
CONNECT DEMAND FORECASTS TO PRODUCTION
Your AI Forecast Is Only as Valuable as What Happens Next. iFactory Closes the Loop.
iFactory connects predictive demand forecasts directly to production scheduling, inventory planning, and procurement — so a change in predicted demand automatically adjusts the production plan, raw material orders, and delivery schedules.
THE DEMAND SENSING PIPELINE
From Raw Signal to Production Schedule How AI Demand Forecasting Flows
The value of AI demand forecasting is not in the accuracy of the prediction alone. It is in the pipeline that converts a demand signal change into an adjusted production schedule without a planner manually re-entering data, rerunning a spreadsheet, or sending an email. The pipeline operates in five stages, each with specific data requirements and output dependencies.
1Data Collection
Multi-source data ingestion from internal systems (POS, ERP, WMS) and external feeds (weather API, economic indicators, social sentiment, competitor pricing). Data is validated, cleaned, and imputed through automated pipelines. Minimum requirement: 24+ months of SKU-level sales history with promotion and pricing data for model training.
2Feature Computation
Automated feature engineering generates lag features, rolling statistics, calendar flags, holiday proximity signals, and external factor correlations. STL decomposition separates trend, seasonal, and residual components. RF-RFE selects the optimal feature subset per SKU cluster. Features are computed consistently across training and inference to prevent data leakage.
3Ensemble Forecasting
Multiple models run in parallel — LSTM with attention for sequential patterns, LightGBM for tabular feature interactions, Prophet for seasonality and holiday effects, and DCSInformer for medium-term trends. An adaptive weighting mechanism adjusts model contributions in real time based on recent accuracy by SKU cluster and demand volatility regime. Output is a probabilistic forecast with P10/P50/P90 quantiles.
4Demand Sensing
Real-time signals — POS data, order intake, inventory movement — are compared against the forecast baseline. Significant deviations trigger an automated forecast revision. A 5%+ shift in a top-100 SKU within 48 hours automatically updates the forecast and propagates changes through production scheduling, inventory planning, and procurement. No manual review needed for routine adjustments.
5Production & Inventory Integration
The final forecast feeds directly into the MES for production scheduling, the WMS for inventory allocation, and the procurement system for raw material ordering. Changes are pushed to floor-level schedules and supplier portals automatically. The loop closes when actual sales data flows back into the model for the next training cycle continuous learning, not periodic retraining.
INDUSTRY DEPLOYMENTS
Real FMCG Demand Forecasting Programs Running Today
The following programs represent the current operational frontier of AI-driven demand forecasting in FMCG — deployed by global consumer goods manufacturers with measurable improvements in forecast accuracy, inventory efficiency, and waste reduction.
PepsiCo AI Demand Forecasting
Global
BeveragesRetail
PepsiCo has established data-sharing collaborations with major retailers to apply AI-driven demand forecasting across its beverage and snack portfolio. The program integrates retailer point-of-sale data, promotional calendars, weather data, and economic indicators into ensemble ML models that produce SKU-store-week level forecasts. The system separates promotional uplift from baseline volume, quantifies cannibalisation across the portfolio, and simulates promotional scenarios before execution. Forecast accuracy improvements have significantly reduced out-of-stocks during high-promotion periods and optimised inventory allocation across retail channels. The program demonstrates that retailer data sharing combined with AI analytics can close the accuracy gap between 64% (retailer perception of data adequacy) and 40% (CPG perception) through federated learning approaches that improve forecast accuracy by 16% without centralising sensitive data.
Danone AI Demand & Promotional Planning
Global
DairyAI
Danone deployed an AI-driven demand forecasting and promotional planning platform across its dairy and plant-based product portfolio, achieving a 90% improvement in forecast accuracy and significant reductions in product waste. The system integrates internal sales data with external signals including weather forecasts, economic indicators, and consumer sentiment analysis. Promotional planning is handled through a dedicated module that models baseline volume, promotional lift, and cross-SKU cannibalisation — enabling Danone to optimise trade spend by directing investment toward promotions that generate genuine category growth rather than short-term share shifting. The platform connects forecast outputs directly to production scheduling and raw material procurement, reducing the planning cycle from weeks to days and enabling rapid response to demand shifts in fresh dairy categories with short shelf lives.
LatentView ConnectedView CPG
Multi-Country
CPGML
LatentView's ConnectedView platform, built on the Databricks lakehouse architecture, delivers end-to-end AI demand forecasting for Fortune 500 CPG companies. The system ingests 50+ external signals alongside internal POS, pricing, and promotion data to power ensemble ML forecasts combining ARIMAX, Prophet, LSTM, and Decision Trees. A key innovation is the integration of Revenue Growth Management data — pricing, pack-size elasticity, and promotion optimisation — directly into the demand forecasting engine, enabling scenario simulation of pricing changes before execution. The platform identified approximately $8 million in inventory waste reduction opportunities through SKU-level diagnostics and predictive waste modeling. Deployment timelines are 4-8 weeks using pre-built accelerators, and the system achieves higher forecast accuracy than single-model approaches across all demand volatility regimes.
STL-DCSInformer-ETS Hybrid
Research — FMCG
Deep LearningTime Series
A 2025 study proposed and validated the STL-DCSInformer-ETS hybrid model for medium- and long-term FMCG sales forecasting, integrating three complementary components: STL decomposition partitioning time-series into trend, seasonal, and residual components; an enhanced DCSInformer with dilated causal convolution and multi-scale feature extraction; and an ETS model specialising in seasonal pattern capture. Tested on monthly sales data from an FMCG company with features including price, promotion, holidays, geographic information, and consumer behaviour indicators, the model achieved a 35.9% reduction in Mean Squared Error and a 21.4% decrease in Mean Absolute Percentage Error compared to traditional LSTM, Transformer, and Informer baselines. The study confirmed that feature selection via RF-RME — identifying the most predictive features across time, geography, economy, product, and weather dimensions — was critical to the performance gain.
OUTCOMES & DATA
Measurable Results From Predictive Demand Analytics
22%
MAPE reduction — AI vs traditional statistical methods
Meta-analysis across 442 assessments, 125 manufacturing companies (2026 Benchmark)
92.9%
RMSE reduction — hybrid ensemble vs standalone ARIMA
CNN+RNN+LSTM+XGBoost with adaptive weighting (2026 study)
67%
MAPE reduction — LightGBM vs SARIMA on FMCG dataset
Price, promotion and stock variables included as features (190K+ observations)
92%
AI forecast accuracy vs 75% traditional methods
Syren FMCG Analytics — validated across multiple CPG deployments
35.9%
MSE reduction — STL-DCSInformer-ETS hybrid model
Medium-term FMCG sales forecasting — 21.4% MAPE improvement
15%
Product waste reduction from improved forecast accuracy
Validated across food and beverage manufacturing deployments
FREQUENTLY ASKED QUESTIONS
What FMCG Manufacturers Ask About Predictive Demand Analytics
How much historical data is needed to deploy AI demand forecasting?▼
Minimum viable training data is 24 months of SKU-level sales history with corresponding promotion and pricing data. Models trained on 12 months or less show significantly higher forecast error, particularly during seasonal peaks and promotional periods. The ideal dataset includes 36+ months covering multiple seasonal cycles, promotional events, and at least one period of demand volatility. For new SKUs with limited history, transfer learning from similar products and category-level baselines can bridge the gap until sufficient SKU-specific data accumulates. External signal data — weather, economic indicators — should cover the same time period for consistent feature engineering. To discuss your data readiness, Book a Demo with iFactory's data science team.
Which AI model performs best for FMCG demand forecasting?▼
No single model is universally optimal for FMCG demand forecasting. Research consistently shows that ensemble approaches outperform any individual architecture. LightGBM and CatBoost achieve the lowest MAPE on tabular feature sets with price and promotion data (2.70% vs 8.19% for SARIMA). LSTM with attention mechanisms excel at capturing sequential dependencies and external indicator fusion (24.6% MAPE reduction vs ARIMA). Hybrid models combining CNN, RNN, LSTM, and gradient boosting with adaptive weighting deliver the highest overall accuracy (92.9% RMSE reduction vs standalone ARIMA). The optimal approach is an ensemble that dynamically weights model contributions based on recent accuracy by SKU cluster and demand volatility regime — no single model handles both stable and volatile demand equally well.
How does demand sensing differ from traditional demand forecasting?▼
Traditional demand forecasting is a batch process — typically run weekly or monthly, producing a fixed forecast that the organisation plans against until the next cycle. Demand sensing is a continuous process that compares real-time signals — POS data, order intake, inventory movement, social sentiment — against the forecast baseline and automatically revises predictions when significant deviations occur. For example, if a top-100 SKU experiences a 5%+ sales shift within 48 hours, a demand sensing system automatically updates the forecast and propagates changes through production scheduling, inventory planning, and procurement — without waiting for the next planning cycle. PepsiCo's deployment uses demand sensing to adjust promotional lift calculations in near real time, reducing out-of-stocks during high-promotion periods.
What is the typical implementation timeline for AI demand forecasting?▼
Implementation timeline depends on data readiness and integration requirements. Plants with clean historical data and existing ERP/MES systems typically go live in 8-14 weeks. The timeline breaks down as: data audit and pipeline setup (2-3 weeks), feature engineering and model training on historical data (3-4 weeks), forecast accuracy validation and model selection (1-2 weeks), integration with production scheduling and inventory systems (2-3 weeks), and user acceptance testing with planner review cycles (1-2 weeks). Plants that require significant data remediation — missing sales history, inconsistent promotion coding, disconnected ERP systems — should budget an additional 4-8 weeks for data foundation work before model training begins. To review your deployment timeline, Book a Demo with iFactory's implementation team.
How does iFactory integrate demand forecasts with production and inventory systems?▼
iFactory provides the middleware layer that connects AI demand forecasts directly to production scheduling (MES), inventory management (WMS), and procurement systems. The integration pipeline works as follows: the forecasting engine produces probabilistic demand predictions at SKU level across daily, weekly, and monthly horizons. These forecasts are cross-referenced against current inventory levels, production capacity, and supplier lead times. The system generates adjusted production schedules that optimise for service level targets while minimising inventory holding costs and changeover time. When a demand signal changes — a retailer promotion is confirmed or a weather event shifts predicted demand — the system automatically re-runs production optimisation and pushes updated schedules to floor-level systems and supplier portals. Typical integration timeline for existing FMCG manufacturing systems is 30-60 days. To see the platform configured for your specific production environment, schedule a session with the implementation team.
PREDICTIVE ANALYTICS FOR FMCG DEMAND
Stop Planning From Last Year's Spreadsheet. Start Predicting From Today's Data.
iFactory connects AI demand forecasting, real-time demand sensing, production scheduling, and inventory optimisation into one unified predictive analytics platform. Used by FMCG manufacturers to reduce forecast error by 22%, cut waste by 15%, and improve service levels.