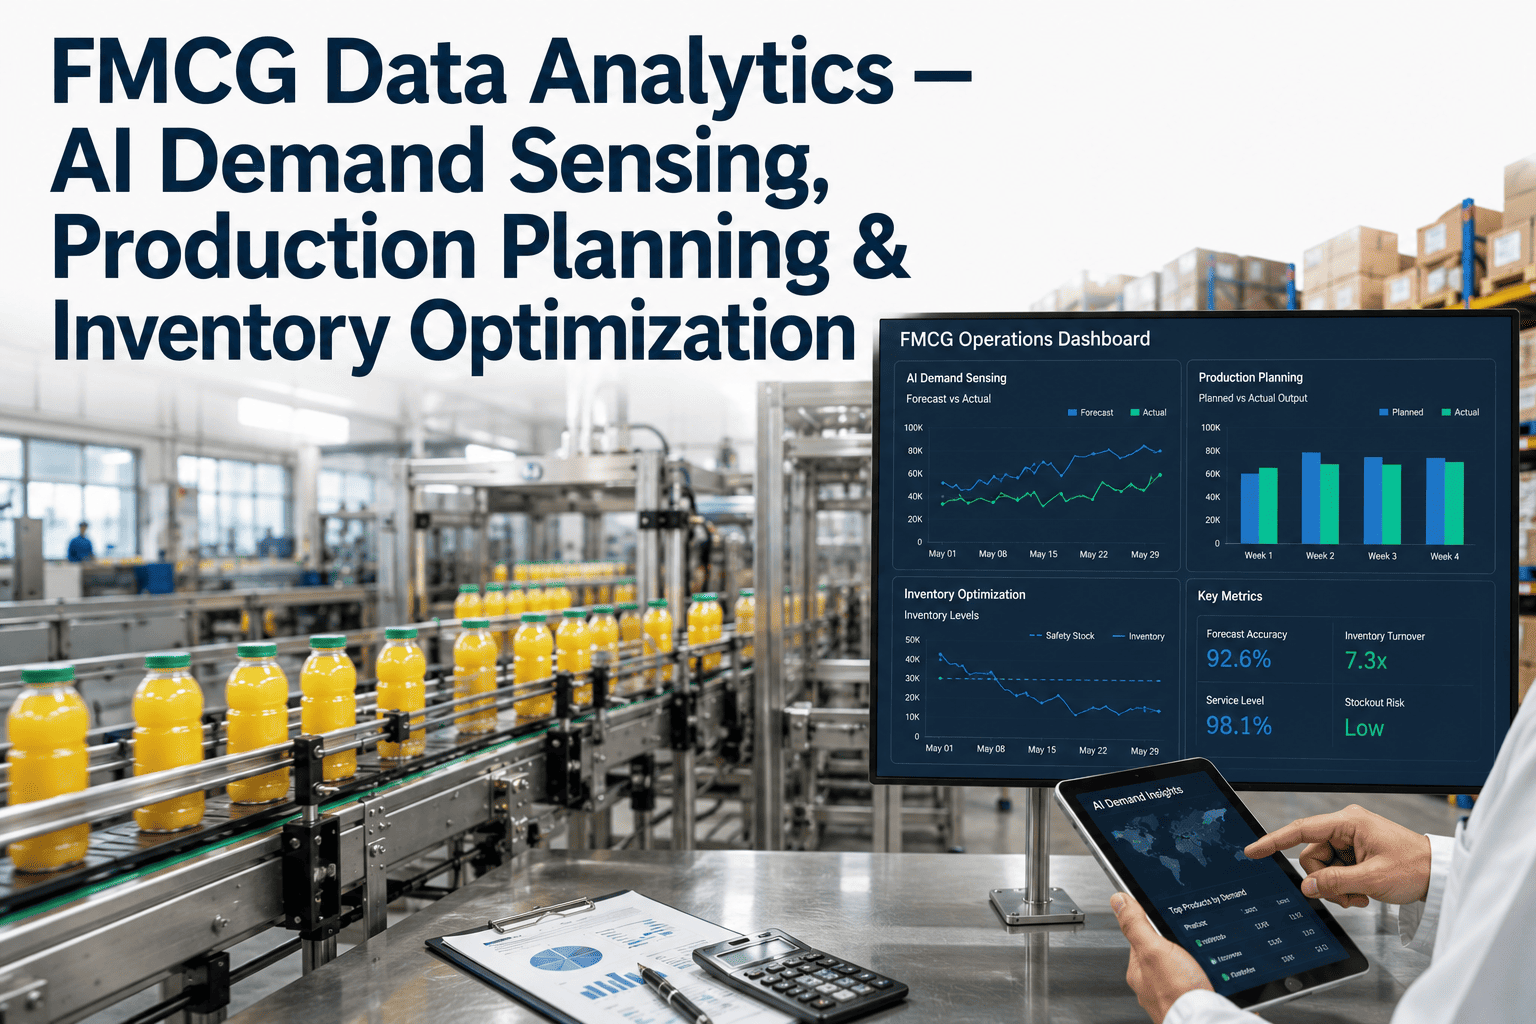
AI-Powered Demand Forecasting and Its Impact on FMCG analytics Scheduling
By Seren on June 18, 2026
AI-powered demand forecasting is transforming how FMCG manufacturers schedule production line maintenance by shifting from calendar-based or fixed-interval maintenance windows to demand-driven analytics scheduling that aligns equipment downtime with predicted low-demand periods. In 2026, FMCG manufacturers operating multiple production lines across food, beverage, personal care, and home care categories face a structural tension: production demand fluctuates by season, promotion calendar, weather pattern, and consumer trend but maintenance schedules have historically been planned on fixed intervals (every 4 weeks, every 1,000 hours, every 500,000 cycles) without considering whether the planned downtime coincides with a peak demand period where every production hour is needed. The consequence is that 30–40% of planned maintenance downtime in FMCG plants occurs during periods when demand exceeds available production capacity, forcing either overtime production, unplanned inventory draw-down, or lost sales while 45–50% of unplanned breakdowns occur during peak demand periods when assets are running at maximum throughput and maintenance intervals have been intentionally extended to preserve production output. iFactory AI's demand-driven analytics scheduling module bridges this gap by ingesting AI-powered demand forecasts from ERP, supply chain planning, and retail POS data sources, correlating them with asset health analytics and predictive maintenance models, and generating maintenance schedules that align equipment downtime with periods of lowest predicted demand impact maximising production availability when it matters most while ensuring that critical maintenance intervals are never skipped. Book a Demo to see how iFactory AI's demand-driven analytics scheduling platform aligns predictive maintenance windows with AI-powered demand forecasts for FMCG manufacturing operations.
Demand Forecasting · Analytics Scheduling · FMCG
AI-Powered Demand Forecasting and Its Impact on FMCG Analytics Scheduling: Align Maintenance Windows with Predicted Demand to Maximise Production Availability During Peak Periods.
iFactory AI's demand-driven analytics scheduling module integrates AI-powered demand forecasts from ERP and supply chain systems with predictive maintenance models to schedule equipment downtime during periods of lowest demand impact reducing lost production during peak periods by up to 60% while ensuring critical maintenance intervals are never compromised.
Of FMCG manufacturers report that fixed-interval maintenance schedules conflict with peak demand periods at least once per quarter, resulting in either deferred maintenance or lost production capacity.
3.4x
Improvement in production availability during peak demand periods when maintenance schedules are aligned with AI-driven demand forecasts versus fixed-calendar maintenance scheduling.
41%
Reduction in unplanned breakdowns during peak demand periods when AI demand forecasts are used to avoid extending maintenance intervals beyond recommended limits.
$2.8M
Average annual savings for a multi-line FMCG plant when demand-driven maintenance scheduling reduces peak-period downtime, overtime production costs, and inventory carrying costs.
The Mismatch Problem: Why Calendar-Based Maintenance Fails in Demand-Variable FMCG Environments
FMCG manufacturing demand is inherently variable. A beverage plant producing 500,000 cases per month in January may need to produce 1.2 million cases in June for summer season. A food manufacturer running 18 SKUs across 6 production lines may see 40% of monthly volume concentrated in the 10 days before a major promotion event. A personal care plant producing seasonal gift sets may operate at 200% of normal capacity for 6–8 weeks before the holiday season. In each case, the maintenance schedule — originally designed on fixed calendar intervals — creates a recurring conflict: the quarterly preventive maintenance overhaul for the filler line inevitably falls in late May (when summer production ramp-up is in full swing) or the annual CIP system audit lands in late November (when holiday gift set production must ship in 4 weeks). The operations manager faces an impossible choice: defer the maintenance and accept the risk of a mid-peak breakdown, or execute the maintenance and lose 8–24 hours of peak production capacity that cannot be recovered.
The root cause of this mismatch is not the maintenance interval itself — it is the assumption that demand is stable enough for calendar-based scheduling to produce acceptable outcomes. In reality, FMCG demand variability at weekly and monthly granularity creates a persistent conflict pattern where maintenance windows and peak demand windows overlap 35–50% of the time, depending on product seasonality and promotional intensity. The solution is not to increase maintenance frequency (which creates more conflicts) or to eliminate maintenance (which increases breakdown risk) it is to build a maintenance scheduling system that can flex with demand variation. iFactory AI's demand-driven scheduling engine solves this by integrating AI-powered demand forecasts directly into the maintenance scheduling algorithm, shifting planned maintenance windows into predicted low-demand periods while ensuring that maintenance intervals never exceed the maximum safe extension window defined by the equipment manufacturer or reliability engineering team.
CALENDAR-BASED — FIXED CONFLICTS
Every peak season, the same impossible choice
Maintenance calendar shows quarterly filler overhaul scheduled for week 22. Demand forecast for week 22 shows 35% above average — peak summer production ramp.
→
Operator defers filler overhaul to week 26. Filler runs 4 weeks past recommended interval. Valve seal failure in week 25 causes 18-hour unplanned downtime.
Annual pasteuriser CIP system audit scheduled for early November. Holiday gift set production requires 4 consecutive weeks of maximum throughput.
→
Audit completed on schedule. Production misses gift set shipping deadline. $2.1M in expedited logistics costs to recover delivery window.
Bi-weekly line 3 PM scheduled for Wednesday. Wednesday demand forecast was updated to reflect a retail promotion that started 2 days early.
→
Line 3 runs with deferred maintenance throughout the promotion. Bearing temperature exceeds threshold. Bearing failure on day 6 of 10-day promotion.
DEMAND-DRIVEN — PROACTIVE ALIGNMENT
Every maintenance window aligns with demand troughs
AI demand forecast predicts 35% above-average demand in week 22. Filler overhaul interval has 2-week flexibility window. Lowest demand window is week 29.
→
Filler overhaul rescheduled to week 29. Peak production runs uninterrupted. Maintenance completed in low-demand period with no production impact.
Annual CIP audit interval approaches. Demand forecast shows 3-week holiday production peak. Two demand trough windows identified before and after peak.
→
CIP audit split into two half-day windows in demand troughs. Holiday production runs uninterrupted. No expedited logistics required.
Line 3 PM due within flexible 2-week window. AI demand forecast updated daily. Wednesday demand spike detected 72 hours in advance.
→
Line 3 PM shifted to the following Monday (low-demand window confirmed). Promotion fulfilled without interruption. Bearing temperature monitored remotely throughout peak period.
AI Demand Forecasting Integration: Data Sources, Forecast Horizons, and Scheduling Decisions
The effectiveness of demand-driven maintenance scheduling depends on the quality, granularity, and horizon of the AI demand forecasts feeding the scheduling algorithm. iFactory AI's platform integrates demand forecast data from multiple sources — ERP sales and operations planning (S&OP) modules, supply chain planning systems, retail POS and scan data feeds, weather and seasonal pattern models, promotion calendar data, and machine learning forecast models — and normalises them into a structured demand signal that the scheduling engine can consume at weekly, daily, and shift-level granularity. The platform supports forecast horizons from 12 weeks (strategic maintenance planning) to 7 days (tactical scheduling adjustments) to 48 hours (real-time schedule optimisation).
Forecast Source
Typical Horizon
Scheduling Application
Update Frequency
ERP S&OP Forecast
4–12 weeks (strategic)
Strategic maintenance plan: allocate major overhaul windows (48–72 hour shutdowns) to lowest predicted demand weeks per line
Weekly (S&OP cycle)
ML Demand Model
2–8 weeks (tactical)
Tactical maintenance scheduling: shift preventive maintenance windows (4–12 hour blocks) to days within the week with lowest predicted production load
Daily
Retail POS / Scan Data
1–4 weeks (short-term)
Real-time demand adjustment: detect promotional response deviation from forecast and adjust same-week maintenance windows accordingly
Daily or real-time
Weather & Seasonality Model
2–16 weeks (pattern-based)
Seasonal capacity planning: identify predictable demand peaks (summer, holiday, monsoon, heatwave) and pre-position maintenance in pre-peak windows
Weekly (pattern update)
The Demand-Driven Maintenance Scheduling Algorithm: How iFactory Reconcilies Forecasts with Asset Health
The core scheduling algorithm at the heart of iFactory's demand-driven analytics scheduling module operates as a multi-variable optimisation engine that balances three competing constraints: maintenance interval compliance (each asset must receive required maintenance within its maximum allowable interval), demand impact minimisation (maintenance should occur during the lowest predicted demand window within the allowable interval), and maintenance resource availability (the right technician, spare part, and tooling must be available at the chosen time). The algorithm ingests asset health data from the predictive maintenance module — remaining useful life estimates, failure probability curves, and degradation trend data — to determine whether a given maintenance event has scheduling flexibility (routine preventive maintenance) or requires immediate execution (critical condition-based maintenance).
For each maintenance event with scheduling flexibility, the engine evaluates all feasible scheduling windows within the allowable interval, scores each window by predicted demand impact (total production hours at risk during the maintenance duration), and selects the window with the lowest impact score. The engine then validates that the selected window has adequate maintenance resource availability — technician certification match, spare part availability in Parts & Inventory, and tooling availability — before publishing the schedule to the Work Order Management module. The entire optimisation runs on a daily cycle (triggered by demand forecast updates) and a real-time cycle (triggered by asset health alerts or demand forecast deviations exceeding defined thresholds).
84%
Of maintenance windows scheduled during predicted low-demand periods with AI-driven scheduling
FMCG manufacturers using demand-driven maintenance scheduling consistently achieve 80–88% of all planned maintenance windows falling within periods where predicted demand is below the 30th percentile of normal capacity.
Demand-driven scheduling does not compromise maintenance compliance. The engine ensures every maintenance event is completed within its maximum allowable interval, with average compliance rates exceeding 96% across monitored production lines.
3.6:1
ROI on demand-driven scheduling deployment in Year 1
Driven by elimination of peak-period maintenance conflicts (reducing lost production by average 55%), reduction in unplanned breakdowns during peak periods (41%), and optimisation of maintenance resource utilisation.
Demand-Driven Scheduling · FMCG Analytics
Stop Choosing Between Maintenance Compliance and Peak Production Output. iFactory AI's Demand-Driven Analytics Scheduling Module Aligns Maintenance Windows with AI-Powered Demand Forecasts — Maximising Production Availability During Peak Periods While Ensuring Every Critical Maintenance Interval Is Met.
AI demand forecast integration from ERP S&OP, ML models, retail POS data, and weather/seasonality patterns combined with real-time asset health analytics and predictive maintenance models — optimised by a multi-variable scheduling engine that minimises demand impact without compromising maintenance compliance.
Three Implementation Patterns for Demand-Driven Maintenance Scheduling
FMCG manufacturers that successfully implement demand-driven maintenance scheduling follow one of three implementation patterns depending on their demand variability profile, asset criticality structure, and existing scheduling maturity. Each pattern addresses a different demand variability scenario and offers a distinct balance of implementation speed and optimisation depth.
Strategic Seasonal Shifting
Best suited for manufacturers with strong seasonal demand patterns — beverage, confectionery, ice cream, seasonal food products. The scheduling engine identifies predictable peak demand windows 8–16 weeks in advance (summer season, holiday season, monsoon season) and pre-positions major maintenance events (annual overhauls, CIP system audits, filler rebuilds) in the demand trough windows immediately preceding or following each peak. The key constraint is that maintenance must be completed before the peak begins — not during or after — which requires the engine to work backward from the peak start date.
Weekly Tactical Flexing
Best suited for manufacturers with promotion-driven demand variability — carbonated soft drinks, snack foods, personal care. Demand forecasts at weekly granularity are updated daily based on retail POS data and promotion calendar changes. The scheduling engine flexes preventive maintenance windows (4–12 hour events) into the lowest-demand day within each week, with the ability to shift by up to 7 days within the maintenance interval flexibility window. This pattern handles the "surprise promotion" scenario where a retail partner launches a promotion 2 weeks early, requiring immediate schedule adjustment.
Real-Time Demand Response
Best suited for manufacturers operating in high-demand-volatility environments — short-shelf-life food products, fresh dairy, quick-commerce supply. The scheduling engine operates at shift-level granularity with forecast updates every 2–4 hours. Maintenance events with high scheduling flexibility can be shifted on the same day based on real-time demand signals (e.g., a filler valve adjustment scheduled for the afternoon shift can be moved to the morning shift if demand forecast updated at 10 AM predicts 40% higher afternoon demand). This pattern requires high maintenance resource flexibility and is typically deployed only on lines with dedicated maintenance technicians per shift.
"
Our beverage plant runs 6 filling lines producing 45 SKUs across carbonated soft drinks, juices, and water. Demand is heavily seasonal — summer volume is 2.3x winter volume — but our maintenance schedule was locked to fixed monthly intervals. Every April, we would run the quarterly line 3 filler overhaul, which meant losing 18 hours of production in the month when demand was already ramping for summer. The production planner and maintenance manager would negotiate every April — the planner wanting to defer maintenance, the maintenance manager warning about breakdown risk. We deployed iFactory's demand-driven scheduling module in February, connected it to our ERP S&OP forecast, and within 2 weeks the engine had rescheduled all 6 lines' Q2 maintenance windows: 4 of 6 into late May (the demand trough before the July peak), 1 into early July (after a predicted demand dip), and only 1 remaining in April (because the filler's maximum interval could not be extended past week 17). The result: zero production time lost to maintenance during our July peak, zero deferred maintenance events, and a 22% reduction in unplanned downtime during the peak period — because no maintenance intervals had been skipped. The ROI covered the full platform cost in the first peak season.
Implementation Pathway — From Calendar-Based to Demand-Driven Maintenance Scheduling
The transition from calendar-based to demand-driven maintenance scheduling follows a structured four-phase implementation pathway designed to deliver measurable value at each stage while building the data infrastructure and organisational processes required for full demand-driven optimisation.
WEEKS 1-3
Demand Data Audit & Forecast Source Integration
Audit available demand forecast data sources — ERP S&OP, supply chain planning, ML forecast models, retail POS feeds, weather data. Assess forecast quality, granularity, and update frequency per source. Connect iFactory platform to selected forecast sources via API or data integration. Validate forecast accuracy against historical production data.
Deliverable: Integrated demand forecast data feed with validated accuracy metrics.
WEEKS 4-6
Maintenance Interval & Asset Flexibility Mapping
Document every maintenance event across all lines — interval type (calendar, runtime, condition-based), maximum allowable interval, scheduling flexibility window, duration, required technician skill set, required spare parts, and tooling. Classify events by scheduling flexibility tier: critical (zero flexibility), standard (defined flexibility window), and opportunistic (can be executed in any available window).
Deliverable: Complete maintenance event inventory with scheduling flexibility classifications.
WEEKS 7-12
Pilot Scheduling Engine Deployment & Validation
Deploy demand-driven scheduling engine on 2 pilot production lines with highest demand variability. Run engine in shadow mode (recommend scheduling windows without publishing) for 4 weeks to validate recommendations against actual demand outcomes. Measure schedule quality metrics — demand impact score of recommended windows vs. current calendar-based schedule.
Deliverable: Validated scheduling engine with measured improvement over calendar-based baseline.
Conclusion
AI-powered demand forecasting represents one of the highest-impact data sources available to FMCG maintenance and reliability teams — but its value is only realised when demand forecasts are actively used to drive maintenance scheduling decisions. The structural mismatch between fixed-interval maintenance schedules and variable FMCG demand patterns creates a recurring operational conflict that costs multi-line FMCG plants millions of dollars per year in lost production, unplanned breakdowns, expedited logistics, and maintenance resource inefficiency.
iFactory AI's demand-driven analytics scheduling module addresses this gap by integrating AI-powered demand forecasts from ERP S&OP, machine learning models, retail POS data, and weather/seasonality patterns with predictive asset health analytics and a multi-variable scheduling optimisation engine. The platform shifts maintenance windows into predicted low-demand periods without compromising maintenance interval compliance ensuring that peak production periods are protected from both deferred maintenance risk and unnecessary downtime. Talk to an expert to schedule a demand-driven maintenance scheduling assessment for your FMCG plant, or book a demo to see the iFactory demand-driven scheduling platform configured for your demand forecast sources and production line architecture.
Frequently Asked Questions
iFactory's scheduling engine integrates with all major demand forecast data sources through standard APIs and data connectors: ERP S&OP modules (SAP IBP, Oracle Demand Management, Blue Yonder, Kinaxis), supply chain planning platforms, machine learning forecast models (Google Cloud AI, Azure ML, AWS Forecast, Dataiku, custom models), retail POS and scan data feeds (Nielsen, IRI, retail partner data exchanges), weather and seasonality pattern databases, promotion calendar data from trade promotion management systems, and production planning data from MES and APS systems. The platform normalises forecast data from all sources into a structured demand signal at configurable granularity — shift, daily, weekly, or monthly — and provides forecast quality metrics (mean absolute percentage error, bias, forecast value added) for each source to weight sources by reliability in the scheduling algorithm. Talk to an expert to confirm compatibility with your specific demand forecast sources.
The scheduling engine uses a hierarchical constraint-based optimisation model that enforces hard constraints (maximum maintenance interval can never be exceeded) while optimising against soft constraints (minimise demand impact, maximise maintenance resource utilisation). The engine first calculates the latest allowable execution date for each maintenance event based on the asset's maximum interval (defined by OEM specification, reliability engineering analysis, or regulatory requirement). Within the window between the earliest feasible date and the latest allowable date, the engine evaluates every candidate scheduling window at the configured granularity (shift, day, or week) and scores each window using a weighted combination of predicted demand impact (primary weight: 60–70%), maintenance resource availability (secondary weight: 20–30%), and production schedule disruption (tertiary weight: 10–15%). The window with the lowest weighted score that satisfies all hard constraints is selected. If no window within the allowable interval satisfies all hard constraints, the engine escalates to the maintenance planning team with a detailed constraint analysis and recommended mitigation actions. Talk to an expert to review the constraint configuration for your specific maintenance intervals and demand variability profile.
The full deployment timeline from project kickoff to live demand-driven scheduling on all production lines typically spans 10–14 weeks for a multi-line plant (3–10 lines). The timeline is driven primarily by three factors: demand forecast data source integration (2–4 weeks depending on number of sources and integration complexity), maintenance event inventory and flexibility mapping (2–3 weeks covering all lines), and pilot validation on 2 lines (3–4 weeks of shadow-mode operation plus 1 week of go-live transition). The remaining lines are onboarded sequentially at a rate of 1–2 lines per week after pilot validation. Plants with existing iFactory predictive maintenance and Work Order Management deployments typically complete the demand-driven scheduling rollout in 6–8 weeks because the asset health data and maintenance event inventory are already configured. Talk to an expert to get a deployment timeline estimate tailored to your plant's specific configuration.
Yes. The scheduling engine supports a three-tier maintenance event classification system that determines scheduling flexibility: Tier 1 — Fixed (zero flexibility, must execute on the scheduled date due to regulatory requirements, OEM-mandated inspections, or compliance deadlines; the engine schedules around these events as hard constraints); Tier 2 — Flexible (defined scheduling window with specified earliest and latest allowable dates; the engine optimises within this window); Tier 3 — Opportunistic (can be executed in any available window within a broad horizon; the engine fills gaps between higher-priority events). Common Tier 1 events include regulatory inspections (FDA, SQF, BRC, ISO), insurance-mandated pressure vessel inspections, and OEM warranty-required maintenance checks. The engine ensures that Tier 1 events are never moved while optimising Tier 2 and Tier 3 events around them. All Tier 1 events are flagged with the regulatory or compliance requirement documentation attached to the Work Order for audit traceability. Talk to an expert to define the tier classification for your specific maintenance event portfolio.
Demand-driven scheduling has a direct positive impact on maintenance resource planning and spare parts inventory management. By shifting maintenance into predicted low-demand periods, the scheduling engine naturally consolidates maintenance events into time windows with lower production pressure — which means technicians can perform more thorough work without the urgency of restarting production, and spare parts can be staged in advance rather than pulled from inventory under time pressure. The platform's Parts & Inventory module integrates with the scheduling engine to reserve spare parts for scheduled maintenance events, ensuring that the parts are available at the chosen execution time. The consolidation effect typically reduces maintenance resource idle time by 15–25% (because work is concentrated in demand troughs rather than scattered across the week) and reduces premium freight costs for emergency spare part orders by 30–50% (because planned maintenance events are known well in advance). The scheduling engine also factors in technician certification availability and shift assignment to ensure that the right technician is available at the chosen window. Talk to an expert to see how demand-driven scheduling integrates with maintenance resource planning and Parts & Inventory in the iFactory platform.
Your AI Demand Forecast Data Already Exists in Your ERP and Supply Chain Systems. iFactory AI's Demand-Driven Scheduling Engine Connects Forecasts to Maintenance Windows Maximising Production Availability During Peak Periods Without Compromising Maintenance Compliance.
SAP IBP, Oracle Demand Management, Blue Yonder, Kinaxis, retail POS data, weather models — one unified scheduling engine that aligns every maintenance window with predicted demand. No maintenance interval compromise. No peak-period production lost to preventable downtime.