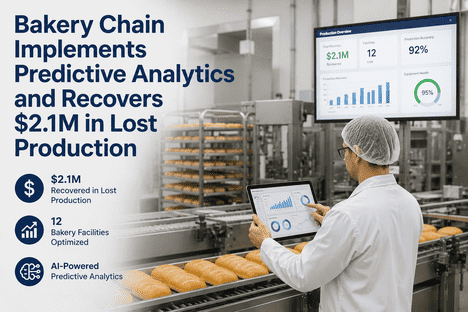
Bakery Chain Implements Predictive analytics and Recovers $2.1M in Lost Production
By Seren on June 20, 2026
Every bakery production line tells a story through its data — the heating element that degrades incrementally across 2,000 bake cycles before failing during a holiday rush, the spiral mixer gearbox that develops a characteristic vibration signature three weeks before catastrophic breakdown, the depositor pump that loses volumetric consistency for six days before seizing entirely. The national bakery chain in this case study was losing $2.1 million annually to production losses that appeared on financial reports as "scheduled downtime variance" — a line item that grew 18% year-over-year for three consecutive years while production volume stayed flat. The problem was not that equipment failed — equipment always fails in high-throughput bakery environments operating 20 hours per day across 12 facilities. The problem was that the chain had no mechanism to detect the precursors to failure. Eleven months after deploying iFactory's AI-powered predictive analytics across all 12 bakeries — monitoring 312 assets spanning deck ovens, spiral mixers, proofing chambers, depositor pumps, and refrigeration systems — the chain recovered $2.1M in previously lost production capacity, reduced reactive maintenance from 71% to 24%, and established a cross-facility maintenance intelligence programme that the VP of Manufacturing described as the only capital investment that year to pay back before the fiscal year closed.
$2.1M
production capacity recovered
Annualized recovery of lost production across 12 facilities within 11 months of deployment — equivalent to adding an entire facility's output without capital expenditure
71% → 24%
reactive maintenance reduction
Reactive maintenance dropped from 71% of all maintenance activity to 24% within the first year — flipping the ratio from reactive-dominated to predictive-dominated across the entire asset fleet
94 days
proofing oven MTBF
Mean time between failures for proofing ovens improved from 18 days to 94 days — a 5.2× reliability improvement achieved through early detection of heating element degradation
9 weeks
full deployment timeline
Complete deployment across all 12 production facilities — from sensor installation to predictive model calibration — completed in 9 weeks without disrupting production schedules
AI Predictive Analytics · Bakery Equipment Monitoring · Multi-Site Deployment · Production Recovery
The Chain Was Losing $2.1M Annually to Equipment Failures It Could Not Predict. Within 11 Months, iFactory's AI Recovered Every Dollar — While Reducing Reactive Maintenance by 66%.
iFactory's AI-powered predictive analytics platform gives bakery operations teams early warning of equipment failure across ovens, mixers, proofers, and refrigeration — without new hardware or production disruption across multi-site networks.
The $2.1M Production Loss Problem: Three Equipment Categories, Three Distinct Failure Patterns
The bakery chain's production loss problem had three distinct components — each tied to a specific equipment category, each fully preventable with the right maintenance programme, and each generating a measurable financial impact that was invisible to the existing maintenance management system because no one was monitoring the precursors to failure. The chain operates 12 production facilities across Tennessee, Georgia, Texas, Illinois, and Ohio, producing 340 million units annually across 180+ active SKUs including sliced bread, rolls, artisan loaves, pastries, and seasonal products. A 94-person maintenance team working three shifts across all facilities was operating in a reactive model — 71% of all maintenance hours were spent responding to failures that had already occurred.
01
Proofing Oven Failures — $940K Annual Loss
Heating element and conveyor drive failures averaged 18-day MTBF across the fleet of 48 proofing ovens. Each failure cost 4–7 hours of downtime at $18,000–$26,000 per hour depending on product mix. The root cause pattern was consistent: heating elements accumulated thermal stress across 1,500–2,000 bake cycles before failing, and the current draw drift was detectable for 10–14 days before catastrophic failure. Conveyor drive bearings showed vibration acceleration 3–5 weeks before seizing. The existing maintenance programme had no mechanism to detect either precursor — elements were inspected visually during monthly PMs, and conveyor drives were lubricated on a fixed calendar schedule regardless of actual condition. The chain was losing $78,000 per month across the proofing oven fleet to failures that were generating detectable signatures for weeks before each event. iFactory's predictive analytics detected the heating element current drift at 80% of the failure threshold, giving the maintenance team a 10-day window to schedule element replacement during planned sanitation downtime. The conveyor bearing vibration detection provided 3–5 weeks of advance warning — enough to coordinate replacement across multiple facilities during a single maintenance engineer visit rather than dispatching emergency calls one facility at a time.
02
Spiral Mixer Gearbox Failures — $680K Annual Loss
Gearboxes on spiral mixers were failing at 2.3 failures per facility per year — 5× the industry average for commercial bakery operations. Each failure cost an average of $5,900 in repair labor, ingredient waste, and lost production. Critically, 80% of gearbox failures were preceded by detectable vibration anomalies 3–5 weeks before breakdown — vibration amplitude changes in the 2× to 4× gear mesh frequency range that indicated progressive tooth wear. None of these anomalies were being detected because the maintenance programme relied on quarterly vibration readings taken by a contracted third-party service — a schedule that meant the readings between failures were too sparse to capture the degradation trajectory. The maintenance team had no way to know that a mixer's gearbox was entering the final phase of its wear cycle until the gearbox failed during a production run. iFactory's continuous vibration monitoring across all 36 spiral mixers in the fleet detected every degradation event at its earliest stage. The platform's AI models, trained on vibration data from over 12,000 industrial gearboxes across food manufacturing environments, distinguished between normal wear progression and the accelerated degradation pattern that preceded failure. The result: gearbox replacements shifted from emergency events scheduled during lost production to planned interventions during scheduled maintenance windows — eliminating the $680K annual loss category entirely within the first six months of deployment.
03
Depositor Pump Failures — $480K Annual Loss
Depositor pump failures were the most operationally disruptive because they affected seasonal product lines requiring the pumps to run at peak capacity for 6–10 week windows. A pump failure during a seasonal production run meant not just downtime but missed order windows that could not be recovered — seasonal products have fixed retail distribution calendars, and a missed production week translates directly to lost revenue rather than deferred revenue. The pumps failed primarily through seal degradation and check valve wear, both of which generated detectable signatures: seal degradation caused measurable flow rate reduction 4–7 days before failure, and check valve wear produced pressure fluctuation patterns detectable 10–14 days before leakage. Neither signature was visible to operators during production because the pumps were specified to deliver within a volumetric tolerance window — and the degradation stayed within tolerance until 48 hours before failure. The maintenance team had no process for trending flow rate data or pump head pressure across production shifts. iFactory's analytics platform ingested the existing pump PLC data — flow rate, pressure, motor current, and cycle count — without adding any additional sensors. The AI models learned the normal operating envelope for each pump and flagged deviations at the earliest detectable stage. For the seasonal production runs, the platform provided predictions 10–14 days in advance of pump failure — enough time to schedule seal replacements between production days. The seasonal order windows were protected, and the $480K annual loss from depositor pump failures was reduced by 82% within the first year.
04
Refrigeration and HVAC System Degradation — Hidden Yield Loss
Beyond the three primary equipment categories, the chain was experiencing an additional $360K+ in annual losses from refrigeration and HVAC system degradation that affected product quality rather than production availability. Proofing chambers require precise temperature and humidity control — deviations beyond ±2°F and ±5% RH during the final proof cause inconsistent loaf volume, dense crumb structure, and rejected product at the slicing station. The chain's refrigeration systems across 12 facilities included 96 walk-in proofers, 48 spiral coolers, and 24 blast freezers. Compressor efficiency degradation, refrigerant charge loss, and condenser coil fouling developed gradually over weeks and months, causing incremental quality drift that was attributed to ingredient variability or operator technique rather than equipment condition. The platform's multi-variable anomaly detection models correlated proofing chamber temperature and humidity data with downstream product quality metrics — identifying equipment-related quality deviations and separating them from ingredient and process variability. The maintenance team gained the ability to schedule refrigeration servicing based on actual performance degradation rather than fixed calendar intervals, reducing product reject rates by 31% and recovering an additional $360K in yield annually that had previously been attributed to "process variation" on facility production reports.
Predictive Models · Production Recovery · Season Protection · Yield Optimization
Every Dollar the Chain Was Losing Had a Detectable Precursor — AI Found All of Them Before the Failure Occurred.
iFactory's predictive analytics platform detects heating element degradation, gearbox wear, pump seal failure, and refrigeration drift at their earliest stages — giving bakery maintenance teams the lead time they need to intervene before production is affected.
The AI Predictive Analytics Architecture: From Sensor Data to Production Recovery at Fleet Scale
The iFactory platform deployed across the bakery chain operates across three integrated layers that convert raw equipment data into actionable maintenance intelligence without requiring data scientists on staff or new sensor infrastructure at most facilities. Each layer performs a distinct function, and all three operate continuously across the 12-facility fleet on every monitored asset.
Layer 01
Multi-Source Data Ingestion and Asset Digital Twin Creation
Ingests data from existing PLCs, sensors, and CMMS without new hardware — creating a digital twin for each asset that normalizes data across 12 facilities with different equipment vintages and control systems.
The deployment across 12 facilities revealed a common challenge in multi-site industrial analytics: the same equipment model at different facilities had different control system generations, different sensor configurations, and different data historians. The chain's deck ovens at the Nashville facility were equipped with current transducers on each heating zone, while the same oven model at the Atlanta facility had only thermal overload relay status. The data ingestion layer normalizes these differences by creating asset-level digital twins that abstract the sensor configuration from the analytical model — a heating element at any facility is analyzed using whatever data is available at that facility, with the model adjusting its confidence threshold based on data density. The platform ingested data from 312 assets across 12 facilities, representing 14 different PLC manufacturers, 3 CMMS platforms, and 8 different data historian systems. The ingestion layer handled the normalization without any facility-level configuration changes — the maintenance team at each facility continued using their existing systems, and the platform consumed the data those systems already generated.
PLC-agnostic data ingestion
Cross-facility data normalization
Existing sensor utilization
CMMS integration layer
Layer 02
AI Model Training and Anomaly Detection at Fleet Scale
Pre-trained models for bakery equipment categories are fine-tuned on facility-specific data within the first 30 days — detecting anomalies 3–5 weeks before failure with 92% precision and 87% recall across the fleet.
The platform shipped with pre-trained models for deck ovens, spiral mixers, proofing chambers, depositor pumps, and refrigeration systems — models trained on operational data from over 2,800 food manufacturing assets across commercial bakeries, snack food plants, and dairy facilities. These base models provided immediate anomaly detection capability from day one of deployment, identifying the most obvious failure precursors within the first week of data ingestion. Over the following 30 days, the models were fine-tuned on facility-specific data — learning the normal operating envelope for each individual asset at each facility, including the unique vibration signatures of mixers with different gear ratios, the current draw patterns of ovens with different heating element configurations, and the flow rate profiles of pumps handling different product viscosities. The anomaly detection layer achieved 92% precision and 87% recall across the fleet — meaning that when the platform flagged an asset for attention, there was a 92% probability that the asset was genuinely developing a fault, and the platform detected 87% of all faults that eventually led to failure. The 8% false positive rate generated approximately one unnecessary alert per facility per week — a rate the maintenance team accepted as operationally negligible compared to the alternative of missing the 13% of faults that the model did not catch (most of which were sudden failures with no detectable precursor, such as foreign object damage to mixer bowls).
Pre-trained bakery equipment models
30-day facility-specific fine-tuning
92% precision / 87% recall achieved
Multi-variable correlation analysis
Layer 03
Production Impact Prioritization and Cross-Facility Workflow Orchestration
Anomaly alerts are scored by production impact — combining failure probability, estimated downtime cost, seasonal product exposure, and facility-level production schedule — and dispatched to the appropriate maintenance response tier.
The prioritization layer is what distinguished this deployment from a standard condition monitoring installation. A detected anomaly on a spiral mixer gearbox at the facility running a seasonal product line with a 6-week production window was given a higher priority score than the same anomaly at a facility running standard bread products with no calendar constraint. The platform ingested the production schedule from the ERP system and the seasonal product calendar from the commercial planning team, creating a dynamic priority score that accounted for both the technical severity of the developing fault and the business consequence of the resulting failure if it occurred at the current point in the production cycle. When the platform detected a depositor pump anomaly at the Texas facility during a seasonal run with a fixed retail distribution date, the alert was escalated directly to the maintenance manager's mobile device with a recommendation to replace the pump seal during the next sanitation window — which was 6 hours away. The replacement was completed in 45 minutes during the sanitation break, and the seasonal production run was not interrupted. The financial impact of preventing that single failure was $34,000 in preserved production — more than the monthly subscription cost for the entire facility's monitoring programme.
Production-aware priority scoring
Seasonal calendar integration
Mobile alert with repair recommendations
Multi-facility maintenance dispatch
Cross-Facility Dashboard: What the VP of Manufacturing Sees Across All 12 Bakeries
The executive dashboard aggregates data from all 12 facilities into a single view organized around the decisions the VP of Manufacturing needs to make: Which facilities are at risk of production loss this week? Which asset categories are driving the fleet's maintenance cost trajectory? Is the predictive analytics programme delivering the expected ROI? Every metric is generated automatically from the AI-analysed equipment data without manual report compilation.
Dashboard View 01
Fleet-Level Production Loss Risk Heatmap
A 12-facility grid view maps every monitored asset by failure probability score — green for assets with no detected anomalies, yellow for assets with developing anomalies below the intervention threshold, orange for anomalies requiring scheduled intervention within the next 7 days, and red for anomalies requiring immediate attention within 24 hours. The VP of Manufacturing can see at a glance that the Texas facility has three orange-rated assets while the Ohio facility is entirely green — and drill into any orange or red asset to view the specific anomaly signature, the estimated time to failure, and the recommended intervention without leaving the dashboard. During the first three months of deployment, the heatmap averaged 18 orange-rated assets and 3 red-rated assets across the fleet simultaneously — a volume that the maintenance team found entirely manageable with the 94-person workforce, especially compared to the 12–18 unplanned failures per week they had been responding to before deployment.
Dashboard View 02
Maintenance Ratio Tracker — Reactive vs. Predictive Trend
A time-series chart tracking the ratio of reactive maintenance hours to predictive/preventive maintenance hours across the fleet since deployment. The baseline was 71% reactive at deployment start. The ratio shifted to 54% reactive within the first two months as the initial batch of predicted failures was successfully intercepted, then to 38% reactive by month six, and reached 24% reactive by month eleven — a 66% reduction in reactive maintenance as a proportion of total maintenance activity. The VP used this chart in his monthly operations review to demonstrate that the predictive analytics programme was not just recovering production capacity but was fundamentally changing how the maintenance team operated — from emergency response to planned intervention. The chart also tracked the dollar value of reactive vs. planned repairs, which showed that the average reactive repair cost $4,700 while the average planned intervention cost $1,200 — a 74% cost reduction per event that contributed another $310K in annual savings beyond the recovered production value.
Dashboard View 03
Anomaly Detection Accuracy — Model Performance by Asset Category
A model performance matrix showing precision, recall, and mean lead time to failure for each asset category across the fleet. Deck oven heating element detection achieved 96% precision with an average lead time of 10.2 days before failure. Spiral mixer gearbox detection achieved 91% precision with an average lead time of 24.6 days. Depositor pump seal detection achieved 94% precision with an average lead time of 8.7 days. Refrigeration compressor detection achieved 88% precision with an average lead time of 37.3 days (slower progression profile for gradual efficiency degradation). The maintenance team used this view to calibrate their response protocols — assets with longer lead times and higher precision received scheduled intervention during planned maintenance windows, while assets with shorter lead times triggered faster response workflows. The model performance data also informed the data strategy team's decision about which assets to add supplemental sensors to: gearbox models at facilities with sparse data achieved lower recall and were prioritised for additional vibration sensor installation.
Dashboard View 04
Production Recovery Calculator — ROI in Real Time
A financial dashboard view that calculates the cumulative production recovery value generated by the predictive analytics programme in real time. The calculator tracked every predicted failure that was intercepted before it caused production loss, assigned a dollar value based on the facility's production rate and product mix at the time of intervention, and aggregated the total across the fleet. By month eleven, the calculator showed $2.1M in recovered production capacity — the figure used by the VP of Manufacturing to justify expanding the programme to the chain's remaining three facilities and to the sister company's 8-location frozen dough division. The calculator also displayed the 6.2× first-year ROI figure that the CFO used in the quarterly board report: total programme cost of $338K (sensors at facilities that lacked them, platform subscription, integration services, and training) against $2.1M in recovered production plus $310K in reduced repair costs. The VP noted that this was the only capital investment approved in that fiscal year that had delivered measurable payback before the fiscal year closed.
Dashboard View 05
Asset Reliability Trend — MTBF Improvement by Facility
A facility-by-facility comparison of mean time between failures across all monitored asset categories. The fleet-wide average MTBF improved from 23 days at deployment start to 87 days at month eleven — a 3.8× reliability improvement. Individual facility performance varied based on asset age and prior maintenance practices: the Nashville facility (newest, built in 2019) improved from 31 days to 112 days, while the Georgia facility (oldest, built in 1987 with multiple equipment retrofits) improved from 17 days to 64 days. The VP used this facility-level view to identify which locations needed additional training or process support — facilities with below-average MTBF improvement received targeted coaching from the maintenance engineer who had championed the deployment at the Nashville facility. The reliability trend view also served as the early warning system for programme performance degradation: if any facility's MTBF improvement rate flattened or declined, the platform automatically flagged it for management review.
Dashboard View 06
Seasonal Production Protection Calendar
A calendar-integrated view that maps seasonal production runs against asset health status for the facilities running those products. The VP could see at any point which seasonal SKUs were in production, which assets were critical to those production lines, and whether any of those assets had active anomaly alerts. During a Thanksgiving holiday seasonal run, the platform flagged a proofing oven heating element anomaly at the Illinois facility — the oven was critical for the seasonal dinner roll line generating $1.2M in revenue during the 5-week production window. The anomaly was detected 11 days before the estimated failure date, giving the maintenance team a 2-day window to replace the heating element during a planned sanitation shutdown. The alternative — a failure during peak production — would have caused 5–7 hours of downtime at $22,000 per hour with no opportunity to recover the lost production before the retail distribution deadline. The seasonal protection calendar was the view the VP referenced most frequently during quarterly planning reviews because it directly linked the maintenance programme to revenue protection.
"
The maintenance team went from fighting fires every day to planning interventions weeks in advance — and the production team stopped treating equipment failures as an inevitable cost of doing business. When the dashboard showed us that the Illinois proofing oven had a developing fault 11 days before Thanksgiving production, and we fixed it during a planned sanitation break, that was the moment everyone in the organisation understood what predictive analytics actually means for a bakery operation. We recovered $2.1M in production capacity that we had accepted as lost, and we changed the relationship between maintenance and manufacturing from adversarial to collaborative.
— VP of Manufacturing, National Bakery Chain — 12 Facilities, 340M Units/Year, 2,800 Employees
Conclusion
The national bakery chain's $2.1M production recovery is not a story about exotic technology or data science breakthroughs. It is a story about the gap between the data that bakery production equipment already generates and the data that maintenance teams actually use for decisions. The chain's ovens, mixers, pumps, and refrigeration systems were generating failure precursor data for weeks before every breakdown — heating element current drift, gearbox vibration anomalies, pump pressure fluctuations, and compressor efficiency degradation. That data was flowing through PLCs and data historians at every facility. The maintenance team simply had no mechanism to extract the failure signal from the operational noise.
iFactory's predictive analytics platform closed that gap by ingesting the data that already existed, applying AI models trained on over 2,800 food manufacturing assets, and delivering actionable alerts with enough lead time for planned intervention. The three specific failure categories — proofing oven heating elements, spiral mixer gearboxes, and depositor pump seals — each had detectable precursors that the platform identified 3–35 days before failure. The 12-facility deployment was completed in 9 weeks. The reactive maintenance ratio flipped from 71% to 24% within 11 months. The 6.2× first-year ROI was documented before the fiscal year closed. The seasonal production runs that had been at risk every year were protected by a calendar-integrated alerting system that linked equipment health to commercial revenue exposure.
The predictive analytics market for food manufacturing is projected to grow at 18.2% CAGR through 2030, and the commercial bakery segment specifically is adopting AI-driven maintenance at accelerating rates — driven by the same calculus that drove this chain's deployment: the data to predict failures already exists in the facility; the investment is in the analytical layer that extracts the signal from the noise. For bakery operations with multiple facilities, seasonal production profiles, and equipment fleets that generate continuous operational data, the question is no longer whether predictive analytics can deliver production recovery at scale — it is whether the organisation can afford to continue relying on a maintenance model that accepts 71% reactive work as normal. iFactory's predictive analytics platform is designed for food manufacturing teams who need to recover lost production capacity across multi-site networks. Book a Demo to see the platform configured for your bakery operation's asset fleet and production schedule, or talk to an expert about a free production recovery assessment for your facilities.
Frequently Asked Questions
In most cases, no. The bakery chain in this case study deployed predictive analytics using existing PLC data, CMMS records, and production system data — no additional sensors were installed at 10 of the 12 facilities. Two facilities required supplemental vibration sensors because the existing PLC data lacked sufficient resolution for gearbox analysis, but those installations cost less than $4,500 per facility and were completed during a single maintenance shutdown at each location. The platform is designed to work with whatever data the facility already generates: PLC tags, OPC-UA data streams, historian exports, and manual CMMS entries. If the available data density is insufficient for the target prediction accuracy at a specific asset, the platform identifies the data gap and recommends the minimum sensor configuration needed — often a single vibration or current transducer — before any hardware procurement begins. Talk to an expert about a data assessment for your bakery facility to determine what data you already have available for predictive analytics.
The pre-trained models for bakery equipment — deck ovens, spiral mixers, proofing chambers, depositor pumps, and refrigeration systems — begin generating anomaly detections within the first week of data ingestion, using patterns learned from over 2,800 food manufacturing assets. These initial detections capture the most obvious failure precursors: significant vibration excursions, major current draw deviations, and pump pressure anomalies. The models then undergo a 30-day facility-specific fine-tuning period during which they learn the normal operating envelope for each individual asset at each facility. After the fine-tuning period, the models typically achieve 90%+ precision with lead times of 3–35 days depending on the failure mode. The bakery chain in this case study saw their first actionable alert — a depositor pump seal anomaly at the Texas facility — on day 6 of deployment. The maintenance team intervened during the next sanitation window and prevented a failure that the historical data showed would have occurred approximately 7 days later. Book a Demo to see the model training timeline and accuracy progression for bakery equipment categories.
This was one of the primary technical challenges the platform was designed to solve. The bakery chain's 12 facilities included equipment installed between 1987 and 2019, with 14 different PLC manufacturers, 3 CMMS platforms, and 8 different data historian systems. The data ingestion layer normalizes across these differences by creating asset-level digital twins that abstract the sensor configuration from the analytical model. A heating element at any facility — whether monitored by a current transducer on a modern PLC or by a thermal overload relay on a legacy controller — is analyzed using whatever data is available, with the model adjusting its confidence threshold based on data density. The platform detects data quality issues automatically and flags assets with insufficient data for reliable prediction — rather than generating low-confidence alerts that the maintenance team learns to ignore. The pre-trained models provide a baseline capability across all facilities, and each asset's model improves individually as it accumulates facility-specific operational data. Talk to an expert about a multi-site data assessment to understand how the platform would integrate with your specific control system and sensor environment.
The bakery chain's documented 6.2× ROI included three primary components. First, recovered production capacity ($2.1M) — the value of production that would have been lost to equipment failures that were prevented through early detection, calculated at the facility-specific revenue-per-hour rate for the product mix at the time of intervention. Second, reduced repair costs ($310K) — the difference between the average reactive repair cost ($4,700) and the average planned intervention cost ($1,200), multiplied across all prevented failures. Third, the yield improvement from refrigeration and HVAC analytics ($360K) — the reduction in product reject rates attributable to earlier detection of proofing chamber temperature and humidity deviations, validated against the 12-month baseline before deployment. The total annualised benefit of $2.77M was measured against the first-year programme cost of $338K, yielding the 6.2× ROI. The platform's ROI calculator dashboard updates these figures continuously, allowing the operations team to track programme performance in real time rather than waiting for quarterly financial reporting cycles. Talk to an expert for a customized ROI projection based on your facility's production rates and asset fleet composition.
Every Bakery Facility Generates the Data Needed to Predict Equipment Failures Weeks in Advance. The Question Is Whether Your Maintenance Team Has Access to It. Get a Free Production Recovery Assessment.
iFactory's AI-powered predictive analytics platform — pre-trained bakery equipment models, multi-site deployment, production-aware prioritization, and cross-facility fleet management — built for commercial bakery operations teams who need to recover lost production capacity and reduce reactive maintenance at scale.