Every FMCG company today operates under a sustainability mandate that is simultaneously a regulatory requirement, a brand differentiator, and a cost transformation opportunity. The Packaging and Packaging Waste Regulation (PPWR) in Europe, Extended Producer Responsibility (EPR) schemes across 40-plus countries, Science Based Targets initiative (SBTi) commitments from 100-plus FMCG brands, and the accelerating shift toward B Corp certification have converged into a single operational reality: the packaging line, the plastic supply chain, and the refill ecosystem must be transformed. The technologies enabling this transformation are robotics and AI — not as future concepts but as deployed solutions managing PCR plastic quality across millions of units per day, operating refill stations in retail environments, tracking circular economy material flows through bottle-to-bottle loops, and reporting Scope 3 emissions with audit-grade precision. For the plant director managing packaging operations, the sustainability director tracking ESG KPIs, and the engineering team evaluating automation investments, the question is no longer whether to deploy sustainability robotics and AI but how to integrate them into existing production systems to maximise both environmental impact and operational ROI.
The Board Has Set the Sustainability Target. The Packaging Line Must Deliver It. Robotics and AI Are the Only Path to Scale.
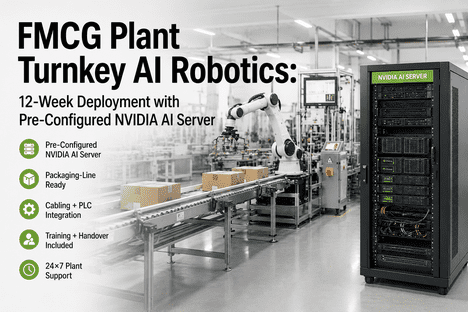
iFactory's AI-driven sustainability operations platform connects PCR plastic processing lines, refill station networks, and circular economy packaging systems into a unified intelligence layer — delivering real-time material traceability, robotics orchestration, energy monitoring, and ESG reporting that satisfies both operational and compliance requirements.
Carbon footprint reduction achievable by replacing virgin plastic with PCR content in FMCG packaging — making material quality automation a direct climate action lever
70%
Reduction in single-use plastic achievable through refillable packaging models and in-store refill station deployment — requiring robotics for scalable operations
3–5x
Faster ESG data collection and reporting cycle when AI-driven operations platforms replace manual spreadsheet consolidation — enabling real-time SBTi and B Corp compliance tracking
$2.5T+
Projected annual value from circular economy models in FMCG packaging by 2030 — capturing this value requires automated material tracking and robotics-driven reverse logistics
The Three Sustainability Packaging Challenges That Demand Integrated Robotics and AI Solutions
PCR plastic quality assurance, refill station operations, and circular economy packaging material flows form an interdependent system where each challenge compounds the others. A packaging line running 30 percent PCR content experiences higher viscosity variation, increased mould fouling, and greater colour inconsistency than a line running virgin resin — each deviation causing reject rates that erode both sustainability metrics and profitability. A refill station network expanded across 500 retail locations generates a real-time logistics problem: container sanitisation, fill-weight accuracy, and dispensing robotics maintenance must be synchronised across a distributed asset base that traditional centralised maintenance systems were not designed to manage. A circular economy commitment to bottle-to-bottle closed-loop recycling requires material traceability from the collection point through sorting, washing, reprocessing, and re-injection — a data chain that spans multiple companies, multiple geographic regions, and multiple regulatory frameworks. The plant director who treats these as separate initiatives duplicates investment and misses the system-level intelligence that connects PCR quality data to refill station performance to circular material yield. iFactory's platform was designed to provide that unified intelligence layer.
The FMCG Sustainability Packaging System — How Material, Refill, and Circular Economy Challenges Interact
Domain
Operational Challenge
System Effect
PCR Plastic
Viscosity inconsistency across source batches, melt flow index variation, colour shift between recycled lots, contaminant ingress, additive depletion after multiple reprocessing cycles
Increased reject rate on injection moulding and blow moulding lines, unscheduled changeovers to clear fouled tooling, higher energy consumption per acceptable unit, compromised mechanical properties in finished packaging
Reverse logistics coordination, sorting purity verification, wash-line quality control, mass balance accounting across multiple polymer grades, documentation for PPWR and EPR compliance
Lost material value from incorrect sorting into downgrade streams, non-compliance penalties exceeding EPR fee savings, audit failures during B Corp or SBTi verification, brand reputation damage from false recycling claims
What AI-Driven Sustainability Operations Intelligence Reveals That Traditional ESG Tracking Misses
Most FMCG companies today track sustainability metrics through a combination of monthly manual data submissions from plant managers, quarterly third-party audits, and annual sustainability reports compiled in spreadsheets. This cadence was designed for annual reporting to regulators and investors, not for operational decision-making that must respond to daily material variations, hourly line performance shifts, and real-time compliance obligations. AI-driven sustainability operations intelligence adds a dimension that retrospective reporting cannot provide: continuous material quality visibility, predictive detection of packaging line degradation driven by PCR content variation, and automated reconciliation of operational data with ESG reporting frameworks. The plant director managing a packaging line running 50 percent recycled content needs to know not just the monthly reject rate but the specific material property shift that caused each hour of unplanned downtime — and whether that shift originated in the PCR supplier's process, the blending ratio, or the mould temperature profile. Each cause demands a different response, and each misdiagnosis wastes production time while the sustainability compliance gap widens.
Intelligence Capability 01
PCR Material Quality Prediction — Detecting Viscosity and Contamination Shifts Before They Reach the Mould
Material Intelligence
PCR plastic from post-consumer sources exhibits inherent variability that virgin resin does not. Melt flow index can vary by 15 to 25 percent between batches from the same supplier, contaminant levels fluctuate with collection stream composition, and colour values shift as the input material mix changes across seasons. These variations are the leading cause of reject rate spikes on packaging lines that have transitioned to high PCR content — and they are invisible to traditional quality control that tests incoming material lots on a sampled basis. AI-powered material quality prediction models ingest near-infrared spectrometer readings, melt flow index measurements, colourimeter data, and injection moulding machine parameters to predict the processing behaviour of each PCR batch before it enters the mould. The model correlates incoming material properties with downstream line performance across hundreds of production runs and thousands of material lots, learning the specific tolerance windows within which each PCR source batch can be processed without compromising output quality. When a batch falls outside the predicted processing window, the system recommends blending ratio adjustments, mould temperature modifications, or supplier quality escalation — in time to prevent the 20 to 35 percent reject rate spikes that undetected PCR variability typically causes.
Real-time melt flow index prediction per batch
Supplier quality trending and escalation
Blending ratio optimisation for consistent output
Intelligence Capability 02
Refill Station Robotics Health Monitoring — Humanoid and Automated Dispenser Fleet Management at Scale
Robotics Intelligence
The refill station is the most visible symbol of an FMCG brand's sustainability commitment — and the most operationally demanding asset in the circular economy infrastructure. A national refill network spanning 200 to 2,000 retail locations with humanoid robots or automated dispensers requires continuous monitoring of dispenser fill-weight accuracy, nozzle condition, container sanitation quality, and robotics positioning reliability. Each station generates 200 to 500 transactions per day, and each transaction must deliver the exact fill weight within regulatory tolerance while maintaining the brand promise of a seamless consumer experience. iFactory's Robotics AI module monitors every dispensing event across the refill network, correlating fill-weight data with nozzle wear trends, pump pressure profiles, and humanoid arm positioning accuracy metrics. When a dispenser begins trending toward under-fill tolerance — typically triggered by nozzle seal degradation after 10,000 to 15,000 cycles — the model generates a proactive maintenance work order that dispatches a service technician before a single customer receives an underweight fill. For FMCG companies managing refill networks across multiple retail partners and geographic regions, the platform provides a unified view of refill station health, dispenser utilisation rates, and maintenance cost per transaction that enables data-driven network expansion decisions.
Per-dispenser fill-weight accuracy trending
Nozzle and pump predictive failure detection
Automated service dispatch based on condition
Intelligence Capability 03
Circular Economy Material Flow Tracking — Bottle-to-Bottle Traceability With Audit-Ready Documentation
Circular Intelligence
The transition from linear to circular packaging requires material traceability that spans the entire value chain: from the consumer's recycling bin through municipal collection, sorting facility, washing plant, reprocessing extrusion, and back into the FMCG packaging line as PCR resin for a new bottle. Each handover point in this chain represents a data gap where material identity, quality attributes, and mass balance allocations can be lost. For FMCG companies making bottle-to-bottle commitments under Loop partnership programmes or voluntary industry pledges, the absence of auditable chain-of-custody data exposes the brand to the risk of unsubstantiated recycling claims. iFactory's MES and Production Monitoring modules, extended into circular economy material tracking, capture material identity and quality data at every transformation step — from bale composition analysis at the MRF through wash-line output quality to reprocessor pellet specifications and final packaging line PCR content verification. The platform generates the documentation package required for PPWR compliance, EPR scheme reporting, and SBTi Scope 3 inventory verification without manual data collection. For the sustainability director managing multiple packaging formats across multiple geographies, the circular material flow dashboard provides a single view of recycled content percentage, chain-of-custody status, and compliance position for every SKU in the portfolio.
End-to-end bottle-to-bottle chain of custody
Automated PPWR and EPR compliance data
SKU-level PCR content verification
Intelligence Capability 04
ESG Data Aggregation and SBTi Reporting — From Plant Floor Data to Investor-Grade Sustainability Disclosure
ESG Intelligence
The gap between operational sustainability data and investor-grade ESG reporting is the most costly inefficiency in FMCG sustainability programmes today. Plant-floor data on energy consumption, material yield, water usage, and waste generation is collected in operational systems — SCADA, MES, CMMS, energy monitoring platforms — but must be manually extracted, transformed, and re-aggregated into the reporting frameworks required by SBTi, B Corp, GRI, and CDP. This manual process consumes thousands of engineering hours per year per company and introduces data integrity risks that undermine the credibility of sustainability disclosures. iFactory's Energy Monitoring, Shift Logbook, and Analytics Reporting modules automate the entire data chain from sensor to disclosure, mapping operational data points to specific reporting framework requirements through a configurable rule engine. The platform generates SBTi Scope 1, 2, and 3 inventories from actual production data rather than estimated emission factors, tracks progress against interim targets in real time, and produces audit-ready documentation packages that reduce third-party verification cycle time by 60 to 70 percent. For the ESG director managing multiple reporting deadlines across different frameworks and geographies, the automated data aggregation eliminates the reconciliation burden and ensures that every sustainability claim is backed by verifiable operational data.
Automated SBTi Scope 1-3 inventory generation
Real-time target progress tracking
Multi-framework audit-ready documentation
PCR Material Quality · Refill Robotics Health · Circular Material Traceability · ESG Automated Reporting
Monthly ESG Reports Tell You What Happened Last Quarter. AI-Driven Sustainability Intelligence Tells You What Is Happening on Every Line, Every Dispenser, Every Material Flow — Right Now.
iFactory's AI sustainability operations platform connects PCR packaging lines, refill station networks, and circular economy material flows through a single intelligence layer — delivering real-time visibility, predictive maintenance, and automated ESG reporting that transforms sustainability from a reporting obligation into an operational advantage.
The Sustainability Operations Dashboard — What the Plant Director, Sustainability Director, and Engineering Team See
The dashboard is the single-view command centre for sustainability packaging operations. Every view is generated from real-time production data cross-correlated with material quality metrics, refill station telemetry, circular material flows, and ESG reporting requirements. The goal is not to present more data — most FMCG organisations already have abundant data across ERP, MES, CMMS, and sustainability reporting platforms. The goal is to present the specific decision-quality information that tells each stakeholder where to intervene, what the sustainability and economic impact will be, and how the intervention moves the organisation toward its SBTi and B Corp commitments.
Six Dashboard Views That Transform Sustainability Packaging Operations From Reactive Reporting to Proactive Intelligence
View 01
PCR Packaging Line OEE and Quality Overview
Every packaging line running PCR content displayed with its current OEE score, reject rate by defect type (colour, dimensional, contamination), PCR content percentage vs target, and energy consumption per acceptable unit. Colour-coded alerts flag lines where PCR content variability has pushed reject rates above the economic threshold. The plant director can see across all PCR lines in one glance and drill into any line to examine the specific material quality parameter that triggered each reject event, correlated with the PCR supplier lot and blend ratio.
View 02
Refill Station Network Health Map
A geographic map of every refill station in the network, colour-coded by dispenser health score, fill-weight accuracy deviation, utilisation rate, and days since last maintenance. Stations approaching under-fill tolerance or requiring nozzle replacement are flagged with the estimated transaction impact — how many customers will be affected and the projected revenue loss if the dispenser goes out of service. The map enables the engineering team to prioritise maintenance dispatch by both equipment condition and business impact, directing service resources to the stations where degradation is costing the most in customer satisfaction and brand equity.
View 03
Circular Economy Material Flow Dashboard
A Sankey-style visualisation of material flows from post-consumer collection through sorting, washing, reprocessing, and back into PCR packaging production. Each flow is annotated with mass balance data, quality metrics at each transformation step, and yield percentage. Bottlenecks — the sorting stage where contamination reduces yield by 15 percent, the reprocessing step where melt flow index degradation limits PCR content — are highlighted with the economic value of lost material and recommended corrective actions. The sustainability director uses this view to identify the specific stages in the circular chain where investment in robotics or AI-driven quality sorting would deliver the highest material recovery ROI.
View 04
Carbon Footprint and Energy Intensity Tracking Per SKU
A cradle-to-gate carbon footprint calculated for every SKU in the packaging portfolio, based on actual production data — not industry averages or emission factors. The dashboard breaks down emissions by scope and source: Scope 1 from line-side equipment using natural gas, Scope 2 from purchased electricity tracked through Energy Monitoring module integration, Scope 3 upstream from PCR and virgin resin suppliers, and Scope 3 downstream from distribution and retail. Each SKU shows its carbon intensity trend over time, the primary reduction lever (material switch, energy efficiency, logistics optimisation), and the contribution toward the SBTi interim target. The plant director and sustainability director use this view to identify the specific SKUs and production lines where carbon reduction investment will deliver the highest impact per dollar.
View 05
EPR and PPWR Compliance Position Tracker
A jurisdiction-by-jurisdiction view of regulatory compliance status for every packaging SKU in every market where the company operates. The dashboard maps packaging format attributes (material type, recyclability, recycled content percentage, weight) against the specific requirements of each EPR scheme and the PPWR articles. SKUs that fall below a compliance threshold — insufficient recycled content for the PPWR 2030 target, missing EPR registration in a specific country, recyclability design constraints — are flagged with the projected financial exposure (EPR modulated fees, non-compliance penalties) and the operational actions required to close the gap. The platform generates the documentation package for each jurisdiction, including mass balance reports, recycling evidence, and EPR fee declarations, reducing the administrative burden from weeks per quarter to hours per quarter.
View 06
Multi-Plant Sustainability Benchmarking
For sustainability directors and engineering teams managing multiple production sites across regions, the multi-plant benchmarking view displays sustainability operations KPIs for every plant on a single screen — PCR content percentage and quality yield, energy intensity per unit of output, water consumption per unit, waste diversion rate, Scope 1 and 2 emissions intensity, and EPR compliance completeness. Plants in the bottom quartile on any metric are flagged for investigation, and the user can drill into any plant to identify the specific lines, shifts, or material suppliers driving the underperformance. Best-practice plants are highlighted as benchmarks, and the platform recommends specific operational changes — a material blending ratio adjustment proven at one plant, a Predictive Maintenance programme adopted at another — that can be replicated across the network.
We committed to 50 percent PCR content across our home care packaging portfolio by 2025. The first six months were a disaster — reject rates tripled on our high-speed blow moulding lines, changeover frequency increased by 40 percent to clear fouled tooling, and we could not determine whether the root cause was our PCR supplier, our blending process, or our mould temperature settings. We were collecting PCR batch data in one spreadsheet, line performance in another, and quality data in a third system that did not communicate with either. Deploying iFactory's platform across three production sites gave us a single source of truth for PCR material quality correlated with line performance. Within 90 days, we identified that one of our four PCR suppliers was producing material with melt flow index variability three times higher than the specification — and that supplier was responsible for 70 percent of our reject rate. We adjusted the blend ratio for that supplier's material, implemented incoming quality gates with automated pass-fail criteria, and reduced our PCR-related reject rate by 58 percent while achieving our 50 percent content target. The platform paid for itself in reject reduction alone within the first six months.
— Packaging Operations Director, Global FMCG Home Care Brand — 12 Production Sites, 8 Markets, 40,000 SKUs
Why AI-Driven Sustainability Operations Intelligence Is Different From Traditional ESG Reporting
It is essential to distinguish between sustainability reporting software — which aggregates data from manual submissions to produce quarterly or annual reports — and AI-driven sustainability operations intelligence, which connects directly to production systems to deliver continuous visibility and real-time decision support. Reporting software answers the question: what was our sustainability performance last quarter? Operations intelligence answers the question: what is happening on our PCR line right now, what is the material quality trend that will determine tomorrow's reject rate, and which refill station needs maintenance before its fill-weight accuracy drifts out of tolerance? Reporting software is a cost of compliance. Operations intelligence is an investment in operational efficiency, material yield improvement, and regulatory risk reduction. The FMCG companies that will meet their 2030 sustainability targets — 100 percent recyclable packaging, 30 to 50 percent recycled content, validated SBTi pathways, B Corp certification — are the ones that embed AI and robotics intelligence into their packaging operations today, not the ones that continue to manage sustainability through monthly spreadsheet submissions and quarterly audit cycles.
Conclusion
The sustainability transformation of FMCG packaging is underway, and its pace is accelerating under the combined pressure of regulation, consumer expectation, and investor scrutiny. The PPWR, EPR schemes across 40-plus countries, SBTi commitments from the world's largest FMCG companies, B Corp certification growth, and the sheer economic logic of circular material value have created an operating environment where sustainability performance is no longer a separate reporting function but a core operational discipline. The packaging lines that run PCR content, the refill stations that displace single-use plastic, the circular economy material flows that close the bottle-to-bottle loop, and the ESG data systems that verify every claim must be integrated into a single intelligence layer that the plant director, sustainability director, and engineering team all see — and all use — to make daily decisions.
iFactory's AI-driven sustainability operations platform delivers that intelligence layer. By connecting PCR packaging lines, refill station networks, circular material flows, and ESG reporting frameworks through a unified platform that incorporates Production Monitoring, OEE Analytics, Robotics AI, Energy Monitoring, Predictive Maintenance, Shift Logbook, MES, and CMMS capabilities, the platform transforms sustainability from a reporting obligation into a measurable operational advantage. The material quality is monitored continuously. The refill station health is tracked across every location. The carbon footprint is calculated from actual production data. The EPR and PPWR compliance documentation is generated automatically. The maintenance interventions are predicted before they cause downtime. The ESG disclosures are backed by auditable operational data.
Talk to an expert about deploying AI-driven sustainability operations intelligence across your FMCG packaging network, or book a demo to see the sustainability operations dashboard configured for your specific packaging portfolio, refill station network, and ESG reporting requirements.
Frequently Asked Questions
The core data requirements span four categories. Material quality data: near-infrared spectrometer readings on incoming PCR batches, melt flow index measurements, colourimeter values, contaminant analysis results, and supplier certificate of analysis data. Processing parameters: injection moulding machine barrel temperature profiles, injection pressure curves, screw speed and backpressure, mould temperature data, cycle time, and clamp force. Line performance data: reject count by defect type, throughput rate, changeover frequency and duration, and OEE metrics. Quality control data: dimensional inspection results, colour measurement per batch, mechanical property (impact resistance, top-load strength) test results, and visual inspection outcomes. FMCG packaging lines typically already collect 50 to 70 percent of this data through existing MES, SCADA, and quality management systems. The AI model begins generating useful PCR quality predictions within approximately 45 days of data ingestion and continues to improve as it learns the specific relationships between each PCR supplier's material characteristics and the resulting processing behaviour on each packaging line. Talk to an expert to review your plant's existing sensor coverage and identify any instrumentation gaps that would enhance PCR material quality prediction capability.
Refill station scaling presents three robotics and AI integration challenges that the platform addresses as a unified system. Dispensing accuracy: humanoid robots or automated dispensers must deliver fill weights within regulatory tolerance (typically plus or minus 1 to 2 percent) across tens of thousands of transactions per station per year. The platform's Robotics AI module monitors every dispensing event, learning the normal fill-weight distribution for each dispenser and detecting drift trends that indicate nozzle wear, pump degradation, or sensor calibration drift. Predictive maintenance: the most common refill station failures — nozzle clogging after 8,000 to 12,000 cycles, pump diaphragm failure after 15,000 to 20,000 cycles, humanoid arm positioning drift after extended operation — are detected 1 to 2 weeks before failure through analysis of cycle time trends, motor current profiles, and position encoder deviation patterns. Network orchestration: for brands managing 500 to 2,000 refill stations across retail partners, the platform provides centralised dispatch optimisation that routes service technicians based on equipment condition, geographic proximity, and retail partner service level agreements. Book a demo to see the refill station network health map configured for your specific dispenser fleet and retail partner locations.
Scope 3 emissions tracking for packaging is particularly challenging because the data spans upstream raw material suppliers (resin producers, PCR processors, additive manufacturers), internal production (packaging manufacturing, filling, assembly), and downstream stages (distribution, retail, consumer use, end-of-life). The platform uses a tiered data approach that balances accuracy against data availability. Tier 1 — supplier-specific data: when suppliers provide product-level carbon footprint data (verified via certification or third-party audit), the platform ingests it directly through automated data exchange or supplier portal submissions. Tier 2 — industry-average data with material-specific allocation: for suppliers that do not provide product-specific data, the platform applies industry-average emission factors from recognised databases (Ecoinvent, GaBi, PlasticsEurope) allocated by material type, mass, and geographic region. Tier 3 — extrapolation with uncertainty quantification: for the remaining data gaps, the platform extrapolates from known data points using material-flow correlation models and quantifies the uncertainty contribution of each extrapolated value to the total Scope 3 inventory. The platform generates SBTi-compliant Scope 3 inventories that document the data source tier for every emission factor, enabling auditors to assess data quality and prioritise improvement efforts on the highest-contribution categories. Talk to an expert to discuss your specific Scope 3 data environment and the optimal tier allocation strategy for your packaging supply chain.
ROI for sustainability operations automation spans four value streams. Material yield improvement: PCR-related reject rate reductions of 40 to 60 percent through AI-driven material quality prediction and blending optimisation, directly reducing material cost and waste disposal expense. For a mid-size FMCG plant processing 5,000 metric tonnes of PCR material annually at an average cost of $1,200 per tonne, a 50 percent reject rate reduction on the 8 to 12 percent baseline reject rate saves $240,000 to $360,000 per year in material cost alone. Energy cost reduction: Energy Monitoring integration that tracks energy consumption per acceptable unit on PCR packaging lines typically identifies 8 to 15 percent efficiency improvement opportunity from optimal processing temperature profiling and reduced reject-related re-run energy, adding $40,000 to $100,000 per year in savings at average industrial energy rates. ESG reporting efficiency: automated data aggregation eliminates 60 to 80 percent of the manual effort currently required for SBTi, B Corp, CDP, and EPR reporting, saving 500 to 2,000 engineering hours per year depending on portfolio complexity. Compliance risk reduction: automated PPWR and EPR compliance tracking eliminates the non-compliance penalties and modulated fee exposure — typically 2 to 5 percent of packaging costs — that result from missed registration deadlines, incomplete documentation, or incorrect material declarations. Combined across these four value streams, documented deployments across FMCG packaging operations show simple payback periods of 6 to 14 months. Book a demo to generate an ROI projection based on your specific packaging portfolio volume, PCR content targets, and current sustainability reporting costs.
The Board Has Set the Sustainability Target. The Packaging Line Must Deliver It. AI and Robotics Are the Only Path to Scale.
iFactory's AI-driven sustainability operations platform — PCR material quality intelligence, refill station robotics monitoring, circular economy material tracking, automated ESG reporting. Built for FMCG plant directors, sustainability directors, and engineering teams who need to deliver measurable sustainability outcomes at scale — without compromising operational efficiency.