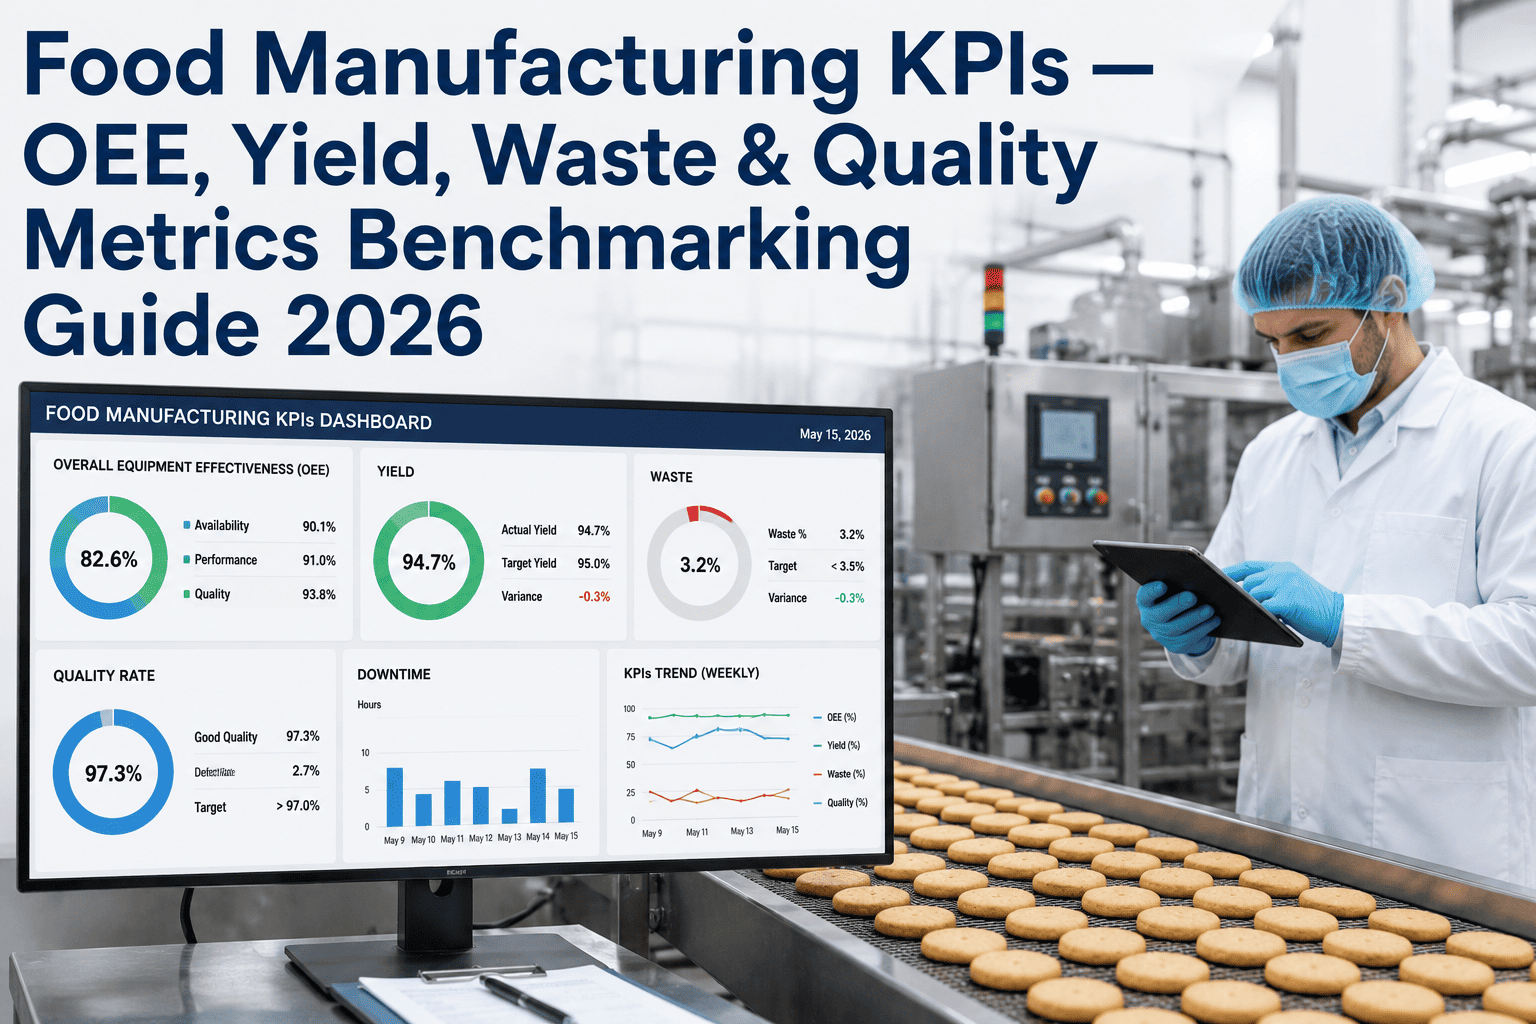
Every food plant tracks numbers. Far fewer track the right numbers, or trust them enough to act on what the dashboard says before the monthly review meeting. OEE gets calculated one way on the line and another way in the corporate report. Waste percentage gets defined differently by two shifts on the same line. First-pass yield gets quietly rounded up because nobody wants to explain the real number to a plant manager under pressure. None of this is dishonesty — it is the natural result of KPIs that were never standardized, benchmarked, or connected to a system that updates faster than a person can manually recalculate a spreadsheet. Getting KPIs right is not a reporting exercise. It is the difference between finding a problem this shift and finding it next quarter. Book a KPI audit to see how your current numbers compare against industry benchmarks.
The Right KPIs, Calculated the Same Way, Every Shift
Standardized OEE, yield, and waste metrics with live AI dashboards replace end-of-month spreadsheets with numbers you can actually act on the same shift they happen.
Why Inconsistent KPIs Cost More Than Bad News
A KPI that is calculated differently across shifts or lines is not just confusing — it actively hides the problem that a standardized metric would have surfaced weeks earlier.
the OEE range most food plants actually run, well below the 85% world-class benchmark
typical food waste as a percentage of production volume across most manufacturing categories
average delay between a KPI trend forming and it appearing in a manual monthly report
variance commonly found when the same metric is recalculated consistently across shifts
The Core KPI Set Every Food Plant Should Standardize
There are dozens of metrics a plant could track. These five form the backbone that connects production performance directly to cost and quality outcomes.
OEE
Availability × Performance × Quality
The single number that rolls downtime, speed loss, and quality reject into one comparable figure across lines and shifts.
First-pass yield
Good units ÷ total units started
Measures how much product makes it through the process correctly on the first attempt, without rework or reprocessing.
Food waste %
Waste weight ÷ total input weight
Tracks material lost to trim, spoilage, and rejected product as a percentage of everything that entered the process.
Downtime by cause
Minutes lost per classified reason code
Breaks total downtime into planned, unplanned mechanical, changeover, and quality-hold categories for targeted action.
Customer complaint rate
Complaints per million units shipped
The clearest downstream signal of whether internal quality metrics are actually protecting the customer experience.
See Your Real OEE, Calculated the Same Way Every Shift
iFactory pulls production, downtime, and quality data into a single standardized calculation, showing your true performance instead of a rounded shift-report estimate.
Benchmark Ranges by Performance Tier
Use these ranges as a starting reference point, then adjust for your specific product category and process complexity. A single number without a tier comparison tells you far less than where you actually sit against it.
The Six Losses Hiding Inside a Single OEE Number
A single OEE percentage is useful for tracking trend, but it hides which of six underlying losses is actually dragging performance down. Breaking it apart is where real improvement targets come from.
- Unplanned equipment breakdowns and mechanical failures
- Changeover and setup time between product runs
- Minor stops and jams that don't register as full downtime events
- Running below rated speed due to material or mechanical constraints
- Startup rejects during the ramp-up phase of a new run
- In-process defects requiring rework or full rejection
An Operations Director's View on Standardizing KPIs
Every plant in our network reported OEE, but every plant calculated it slightly differently, so comparing them was meaningless. Once we standardized the formula and connected it to live production data instead of end-of-shift manual entry, two lines we thought were performing adequately turned out to be losing more to changeover time than any other cause combined. We had been targeting the wrong problem for over a year.
average OEE improvement within two quarters of standardized tracking
reduced from months to weeks for a KPI trend to surface and be acted on
of plants in the network now reporting on one consistent formula set
Frequently Asked Questions
Why does our reported OEE differ so much from the industry benchmark?
The most common cause is a difference in how availability, performance, and quality are each defined and captured, not an actual performance gap. Manual shift reports often exclude minor stops or round changeover time generously, which inflates the reported number relative to a system capturing every event automatically. Book a KPI audit to see your true calculation against the standard formula.
Should every line target the same OEE benchmark?
No. Benchmark targets should account for process complexity, product mix changeover frequency, and equipment age. A high-mix line with frequent changeovers will reasonably run a lower OEE than a dedicated single-product line, and treating both against the same target creates a misleading picture of relative performance.
How is food waste percentage best measured across different loss points?
A complete waste percentage should capture trim loss, spoilage, quality-driven rejects, and any product lost during changeover, weighed at each point rather than estimated at the end of a shift. Plants that only track final scrap bin weight typically understate total waste significantly, since in-process losses at multiple stages go unrecorded.
Can KPI dashboards update in real time without new hardware on every line?
In most cases, existing PLCs, checkweighers, and MES systems already generate the data needed; the gap is usually in connecting and standardizing that data rather than needing new sensors. A scoping review typically identifies which lines already have sufficient data access and which would benefit from targeted instrumentation.
How quickly can a plant see standardized KPI dashboards live?
A pilot connecting one or two lines to a live dashboard typically takes three to five weeks, including formula standardization and validation against a manual audit. Full multi-plant rollout timelines depend on how many distinct systems need to be connected. Talk to a specialist about your current systems and line count.
The Bottom Line on Food Manufacturing KPIs
A KPI that is calculated inconsistently is worse than no KPI at all — it creates false confidence instead of an honest signal. Standardizing the formulas, connecting them to live production data, and benchmarking against real industry tiers turns a monthly reporting exercise into a same-shift feedback loop, which is the only speed at which a KPI actually changes behavior on the floor.
Find Out What Your Real Numbers Are
Book a 30-minute KPI audit. iFactory reviews your current OEE, yield, and waste tracking against standardized formulas and industry benchmarks, and shows exactly where the gap sits.