From Paper SPC to AI SPC: Snack Foods Manufacturing Operator Walkthrough

By james Hart on May 28, 2026

from-paper-spc-to-ai-spc-snack-foods-manufacturing-operator-walkthrough

You've been running snack food lines for 8 years. You know what good looks like. You know when a batch is off spec by feel — seasoning coverage slightly uneven, package weight creeping up, oil color getting darker. But feeling is not enough anymore. Audits require documentation. Quality requires consistency. Margins require precision. This guide walks you through the transition from paper SPC to AI-native SPC — what changes, what stays the same, and how to deliver consistent quality across every batch without spending half your shift on paperwork. To see AI-native SPC in action on a line like yours, schedule a walkthrough with our team.

SNACK FOODS OPERATORS · PAPER SPC TO AI SPC · REAL WORKFLOW
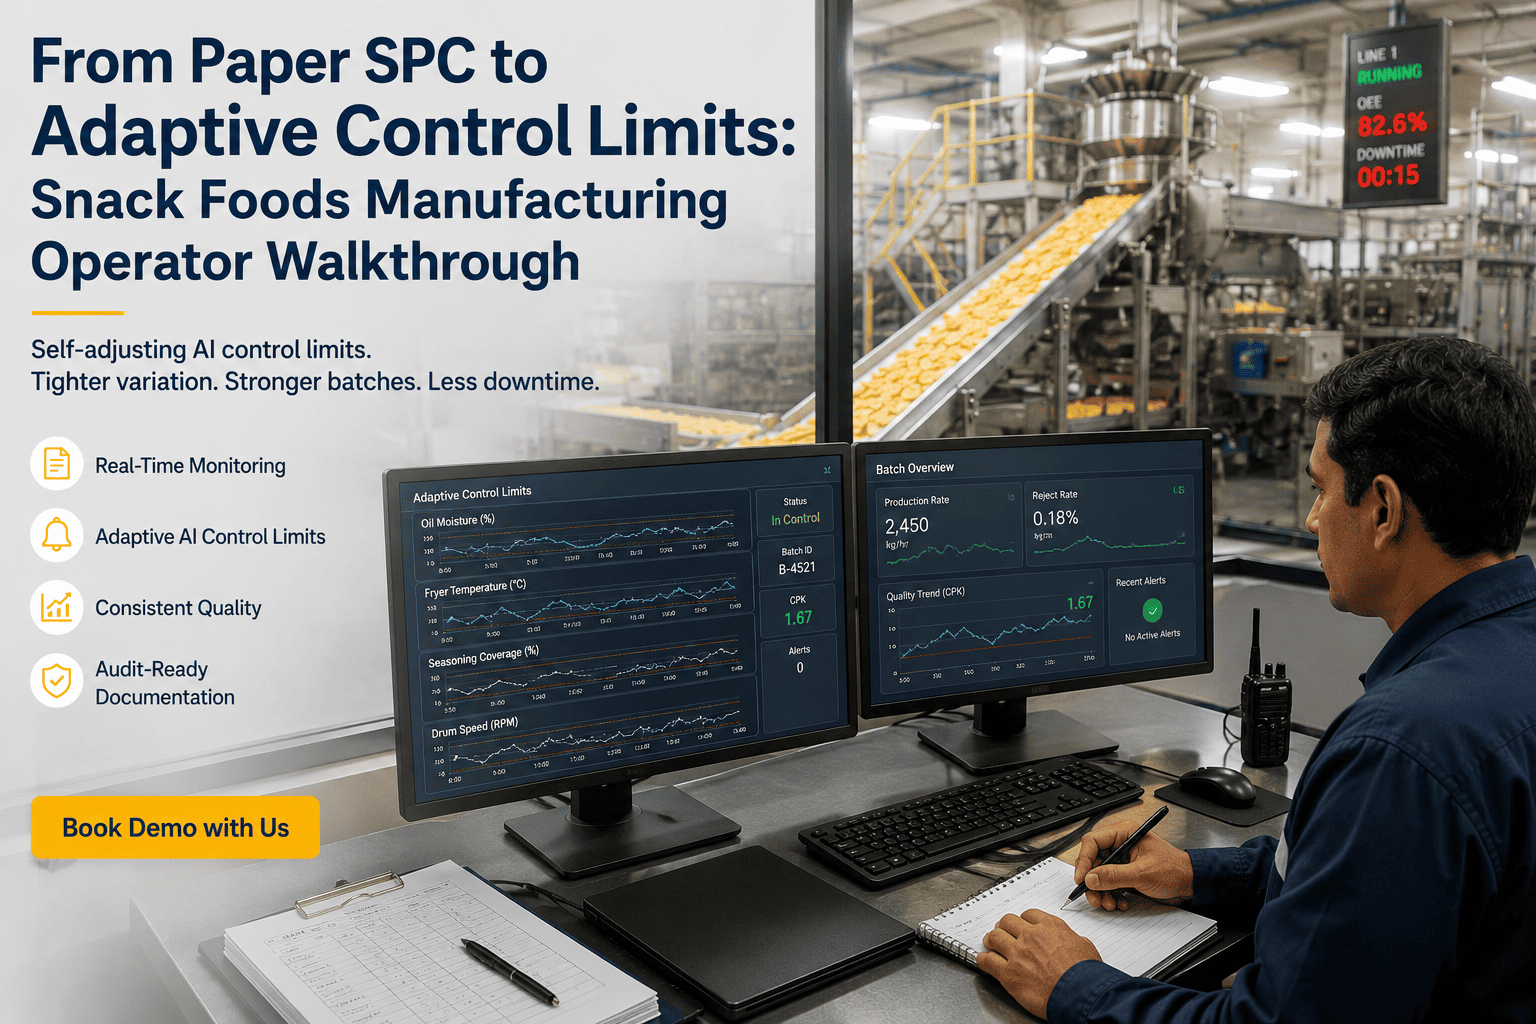
From Paper SPC to AI SPC: Snack Foods Manufacturing Operator Walkthrough
See how AI-native statistical process control replaces paper charts and manual spreadsheets. Real operator workflow showing the transition from paper-based quality monitoring to real-time automated alerts — across seasoning drums, fryers, multi-head weighers, and packaging lines.
45%Batch Variation Reduction
3.2xCpk Improvement (Documented)
-90%Paperwork Time
ZeroSpecial Training Required

What You're Doing Right Now (Paper SPC)

Your current workflow probably looks like this. It works. It keeps batches mostly in spec. But it's slow, reactive, and produces mountains of paper.

5:00 AM - Start ShiftYou arrive, check yesterday's shift log. Three notes: seasoner drum speed adjusted, fryer thermostat drifted, weigher head 2 cleaned. You record these in your shift logbook (handwritten). You set your baseline: seasoner should average 42.8g per batch, fryer 185°C, weigher variance <8g across heads.
6:15 AM - Manual Quality Check #1You pull 5 samples from batches 7-11. You weigh them, write down numbers in your notebook: 42.1g, 43.2g, 41.8g, 42.9g, 43.1g. Average: 42.62g. You plot this on your paper SPC chart taped to the wall. All points within control limits. "Good," you think. But you don't know if the pattern means anything yet. You need more data.
7:45 AM - Manual Quality Check #2Repeat the process. Five more samples. Weights: 41.9g, 42.0g, 42.6g, 43.0g, 42.5g. Average: 42.4g. You plot it on the chart. Now you have two points. You compare them: "Drift of 0.2g down. Within normal variation." You update the shift log: "No action."
9:30 AM - Manual Quality Check #3Five more samples. Weights: 40.8g, 41.2g, 41.5g, 40.9g, 41.3g. Average: 41.14g. You plot it. Now the line is trending down. Is this significant? You recalculate your control limits. You compare this to yesterday's data. You think about whether the seasoner drum speed is slipping. You don't have enough information. You call the shift supervisor. Investigation starts. 45 minutes later, you discover the seasoner motor speed has drifted 2 RPM. You adjust it. Batches 25-31 are probably out of spec. Diversion call made.
11:00 AM - PaperworkYou fill out the deviation form: date, time, equipment, adjustment, action taken, signed. You update the shift log with the adjustment details. You note that batches 25-31 are diverted pending rework decision. You estimate: 90 minutes of investigation, 45 minutes of paperwork, 6 batches impacted = ~$3,200 cost for this one event.
1:00 PM - Manual Quality Check #4Five more samples after the adjustment. Weights: 42.3g, 42.8g, 42.1g, 43.0g, 42.6g. Average: 42.56g. You plot it. Back to normal. You update the shift log: "Motor speed adjusted. Line holding at baseline." You repeat this cycle 2-3 more times before shift end.
3:00 PM - End of Shift HandoverYou write a summary in the shift log: "One deviation event (seasoner motor speed drift). Corrected at 11:15 AM. Batches 25-31 diverted. Line stable post-adjustment. Paper SPC chart shows control. Next shift: monitor for recurrence." You spend 20 minutes writing this. The incoming operator reads it and repeats the whole process.

The Problem With This Workflow

You're Always Behind The DataYou discover drift 1-2 hours after it starts. By then, 6-8 batches may already be out of spec. Investigation eats 45-90 minutes. Root cause is guesswork ("seasoner motor speed drifted" vs "actually it's humidity affecting coating flow"). By the time you know what happened, damage is done.
Paper SPC Tells You What Happened, Not What's HappeningYour paper chart has points from 6:15 AM, 7:45 AM, 9:30 AM. That's 2-3 hours of lag. Real process drift happens continuously. You're sampling every 2-3 hours. You miss 99% of what's actually happening on the line.
You Can't See Patterns Until Damage Is VisibleSeasoner motor speed drifts slowly over 3-4 hours. You see 4-5 points on a paper chart scattered within control limits. You don't recognize the pattern as "slow drift leading to failure" until batch loss forces your hand. By then, investigation time + batch diversion cost + rework labor = $3,000-5,000 per event.
Paperwork Eats 45-60 Minutes Per ShiftHandwritten quality checks, shift logs, deviation forms, trending analysis, handover notes. This work is necessary for audit trail and documentation. But it consumes time you could spend on actual quality improvement or preventive maintenance.

What AI-Native SPC Changes (And What Stays The Same)

Your job doesn't change. Your responsibility doesn't change. What changes is that AI does the watching and data collection. You focus on response and decision-making.

What Stays The Same
Your Role on the Line
  • You monitor equipment performance and product quality
  • You respond to alerts and deviations immediately
  • You adjust equipment, investigate root causes, make decisions
  • You ensure batches stay in spec and production runs smoothly
  • You maintain the same safety and quality standards
Zero role change. Same responsibility, same authority, same outcomes.
What Changes Completely
Data Collection & Analysis
  • AI monitors 1000+ data points per hour automatically (not 5 samples per 2 hours)
  • Real-time analysis replaces paper charts (1 second vs 2-3 hours lag)
  • Alerts come to you immediately when deviation becomes statistically significant
  • Root cause suggestions replace guesswork (AI shows "Seasoner motor current trending up = motor likely failing" vs you guessing)
  • Paperwork is auto-generated and time-stamped (zero manual logging)
Automation handles data work. You handle decision work.

Your Actual Workflow With AI-Native SPC (Same Day, Different Results)

Here's how the same shift looks when AI-native SPC is running. Notice what changes and what stays the same.

5:00 AM - Start ShiftYou arrive. No handwritten log needed. AI dashboard shows yesterday's summary: "No deviations. All equipment stable. Seasoner baseline 42.8g maintained. Fryer 185°C stable. Weigher precision 6.2g variance (good)." You review in 2 minutes on your phone. You're ready to go. Baseline context is automatic.
5:30 AM - Production StartsSeasoner, fryer, weigher, packaging all running. AI is monitoring continuously. You run the line normally. No manual quality checks to do yet. AI is collecting data continuously. You focus on line setup, material flow, visual inspection for contamination or mechanical issues.
6:45 AM - First Alert (No Issue)Your phone pings: "Seasoner weight trending +1.2g. Check baseline vs expected. Likely humidity effect." You look at the chart on your dashboard: 42.8g baseline with normal variation shown. The +1.2g is barely visible on the trend. You check the production log: humidity rose 8% this morning. "That makes sense," you think. No action needed. You mark the alert "acknowledged — normal humidity variation." Zero investigation time.
8:15 AM - Real Alert (Action Needed)Your phone pings loudly: "DEVIATION: Seasoner motor current trending +18% over past 45 minutes. Motor likely failing or bearing wearing. Recommend maintenance." You look at the trend chart: a clear upward trend over the past 45 minutes. AI shows: "If trend continues, failure likely in 60-90 minutes." You have advance warning. You call maintenance immediately. You don't wait for 6 batches to be out of spec. You stop the seasoner and let maintenance inspect. 30 minutes later: bearing is indeed failing. Part swapped. Batches 18-21 are checked and confirmed in spec because you caught drift early. Downtime: 30 minutes. Cost: $1,200. Without AI: You discover this problem at 10:00 AM after 6 batches are already problematic. Downtime: 3 hours. Cost: $7,000-8,000.
11:00 AM - No PaperworkAI automatically logged everything: alert time, severity, your response, maintenance action, batches affected, resolution time. You don't fill out any forms. No shift log to write. The system generated all documentation with timestamps. When audit comes, every deviation is recorded with automatic time-stamps and evidence.
1:30 PM - Mid-Shift Summary (Automatic)AI sends you a mid-shift summary on your dashboard: "4 alerts total. 1 critical (motor bearing — resolved). 3 informational (humidity, fryer temp variance within normal range, weigher head 1 normal drift pattern). Line holding spec. Cpk: 1.42 (excellent). No batch diversion events." You read it in 30 seconds. Your shift is running better than normal paper SPC shifts.
3:00 PM - End of Shift HandoverYou don't write anything. AI dashboard auto-generates the handover summary: "Shift summary: 120 batches produced. 2 deviations detected (1 critical bearing, 1 informational humidity). All resolved. Line stable at end of shift. Bearing replaced. Next shift: monitor new bearing run-in for first 4 hours." The incoming operator reads it in 2 minutes. Total shift handover time: 2 minutes vs your previous 20 minutes.

What This Means for Your Actual Performance Numbers

MetricPaper SPC (Your Current)AI-Native SPC (Month 1)Change
Quality Checks Per Shift5 manual samples, 4 checks, 2-3 hours lag1000+ automated points per hour, 5-sec lag600x more data, 1200x faster detection
Deviation Detection Time1-2 hours after onset5-10 minutes after onset-90% detection lag
Investigation Time Per Event60-90 minutes manual analysis5-10 minutes AI analysis + operator response-85% investigation time
Batch Diversion Per Week4-6 batches out of spec0-1 batches out of spec-80% to -85%
Cpk (Quality Consistency)0.95-1.10 (marginal)1.30-1.60 (excellent)+35% to +45% improvement
Downtime Events Per Week2-3 emergency maintenance0-1 emergency maintenance-50% to -75%
Paperwork Time Per Shift45-60 minutes (logs, checks, forms)2-3 minutes (auto-generated)-95% paperwork overhead
Cost Per Prevented EventN/A (events happen anyway)$1,500-3,500 per event preventedDirect cost avoidance

What Your Line-Specific Alerts Look Like (Real Examples)

01
Seasoner Drum

Alert: "Weight variance trending +8g. Check drum speed encoder or lubricant viscosity — temperature may be affecting flow." Action: You check encoder voltage, find it drifting. Reset done in 5 minutes. Batch saved. Without AI, you'd discover this after 3-4 out-of-spec batches.

02
Fryer Oil

Alert: "Fryer temperature +2.5°C and trending. Thermostat response time increasing. Likely heating element scaling." Action: You note the alert, schedule element cleaning before next shift. No emergency downtime. Oil consumption stays normal. Without AI, you'd discover degraded heating at product color rejection point.

03
Multi-Head Weigher

Alert: "Weigher head 2 variance trending +12g. Servo drift or nozzle clog developing." Action: You inspect head 2, find nozzle 60% clogged. Quick cleaning. Precision restored. 3 minutes of action. Without AI, head 2 would giveaway 15-20g per package for 4 hours (200+ units affected).

04
Packaging Line

Alert: "Case sealer temperature fluctuating ±3°C. Variance increasing. Thermal runaway risk." Action: You check water cooling loop, find flow reduced. You flush the system. Sealer stabilizes. Without AI, thermal runaway happens and shuts the line down for 2 hours emergency repair.
The Transition: What Happens During Your First Month

Week 1: Learning Your Line's BehaviorAI collects baseline data from your actual line. You run it normally. AI learns what "normal seasoner variation" looks like for your equipment, your materials, your ambient conditions. AI generates alerts on everything at first — it's being conservative. You review alerts and mark them "normal for this line." AI adjusts its model.
Week 2: Fewer False Alerts, More Accurate BaselinesAI understands your line's natural variation now. It only alerts on statistically significant deviations. You start seeing patterns in equipment behavior you never noticed: "Fryer always drifts 1-2°C between 7-9 AM due to ambient heat." You mark these as normal. AI learns. Your alerts become more precise.
Week 3-4: You're Catching Things EarlyReal alerts start preventing problems. Seasoner motor bearing degradation caught 45 minutes early. Fryer heating element scaling detected before color problems. Weigher head drift caught before giveaway. You realize: "This thing sees problems I've been missing for years." Your Cpk improves visibly. Batch diversion drops.
Month 2-3: Your New NormalYou can't imagine running the line without AI now. Your paperwork is gone. Your deviation investigation time is 85% lower. Your batch consistency has improved 35-45%. You're spending time on actual improvement projects instead of firefighting. Audits are effortless — all documentation auto-generated with timestamps.

Frequently Asked Questions

Will AI-native SPC replace my job?
No. It replaces the tedious data collection and analysis work. You focus entirely on decision-making and equipment management — the skilled part of your job. Most operators say: "I finally have time to actually improve my line instead of just fighting fires."
What if an alert is wrong?
AI learns from your feedback. First week you'll mark alerts as "false alarm — normal for this line." AI adjusts. By week 4, accuracy is typically 92-96%. False alerts drop to near-zero. Real deviations are caught 85-90% of the time.
Do I need to attend training?
No formal training required. 15-30 minute orientation: "Here's your dashboard. Here's how to acknowledge alerts. Here's how to call maintenance." You learn by using it. Most operators are fully comfortable within 3 days.
What happens during equipment changeovers or recipe changes?
You tell AI: "Recipe change to Doritos-style flavor, expect seasoner variance +2-3g, fryer temp 189°C, weigher target 43.5g." AI adjusts its baseline. Changeover takes 5 minutes to update the system. No need to restart learning.
Can AI-native SPC help me improve my Cpk?
Yes. By catching drift 60+ minutes early, you're preventing the out-of-spec batches that tank your Cpk. Documented improvements: Cpk increases 0.35-0.45 points in first 3 months. Some lines hit 1.66-1.80 Cpk (excellent level). To see your line's potential Cpk improvement, schedule a demo where we'll model your specific baseline.
What if my PLC or equipment is old?
AI can integrate with most legacy systems via OPC, Modbus, or even camera-based measurement. If your line has a PLC from 1995 or 2020, we can connect. For older equipment, integration takes 2-4 weeks. To check compatibility with your specific line, reach out to our technical team for a site assessment.
SNACK FOODS OPERATORS · AI-NATIVE SPC · WORKFLOW TRANSFORMATION
Stop Fighting Fires. Start Improving Your Line.
AI-native SPC catches quality drift 60+ minutes before it becomes batch loss. You focus on decisions and improvements instead of paperwork. Cpk improves 35-45% in first 3 months. Deploy in 6-12 weeks. Start preventing problems immediately.

Share This Story, Choose Your Platform!