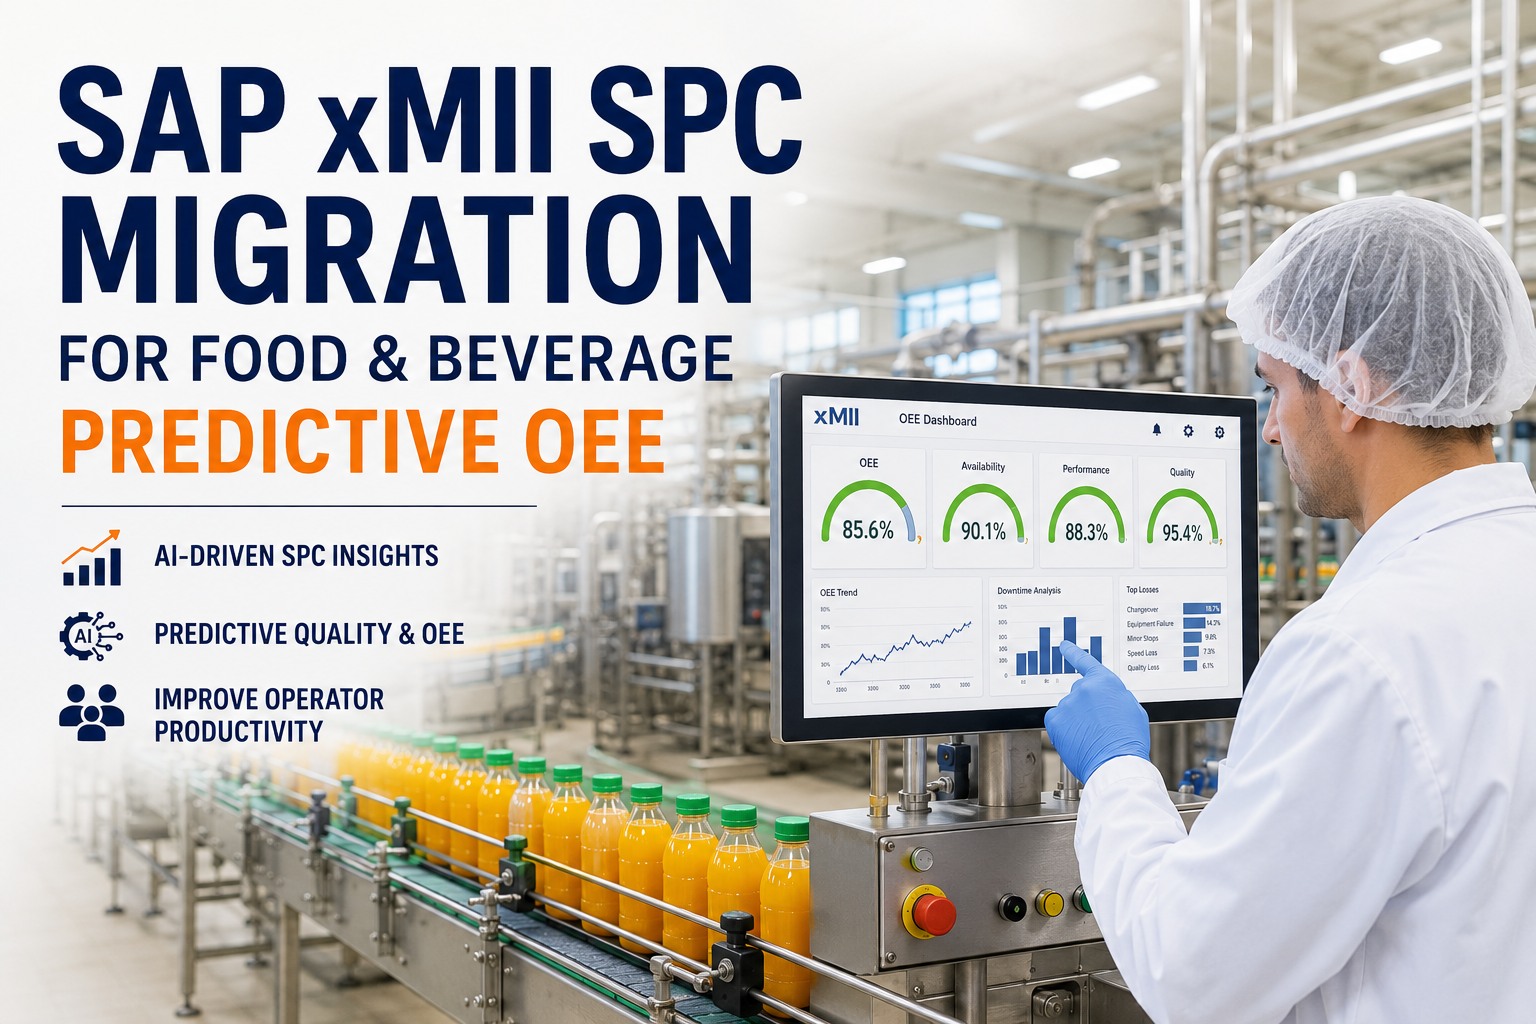
SAP xMII reports OEE. AI-native SPC forecasts it. That single architectural difference reframes the operator's entire shift. Under xMII, the production board shows yesterday's OEE was 62% and last hour's OEE was 58% — useful information for explaining what happened, useless for changing what's about to happen. Under AI-native SPC, the board shows next hour's predicted OEE will land at 56% unless the operator addresses three specific things: a developing bearing wear pattern on Line 3 (predictive Availability), a recipe drift creating speed loss on the filler (predictive Performance), and a quality trend approaching control limits on the cooker (predictive Quality). Three actions in priority order, each tied to its OEE component impact. The result for F&B operations: average plant OEE rises 10-15 points in year one, operators reclaim 30-40% of shift time from diagnosis to execution, and "what should I fix first" stops being a judgment call and starts being a ranked recommendation. This guide breaks down the predictive OEE equation, the operator's day before vs after, GenAI copilots, and the 8-12 week migration roadmap. Book an AI SPC migration workshop for your plant.
Component A
Availability
xMII: % uptime · reactive
AI: failure forecast · 2-4 wks ahead
×
Component B
Performance
xMII: speed % · post-shift
AI: cycle-time forecast · hour-by-hour
×
Component C
Quality
xMII: defect rate · historical
AI: deviation forecast · 1-30 min ahead
=
Outcome
OEE 85%+
World-class · forecast-driven
vs F&B average 60-65%
Why xMII OEE Is a Report Card, Not a Forecast
SAP xMII was architected when OEE was a metric you reported after the shift to grade performance. Modern operations need OEE as a leading indicator that lets the shift change its outcome before the shift ends. Five structural reasons xMII OEE will always be a rearview-mirror metric — and why the operator productivity gap shows up everywhere it's used.
01
Designed for Reporting Cadence
xMII OEE dashboards refresh on hourly or shift boundaries. By the time the number reflects a problem, the shift is hours into producing the wrong output. Predictive OEE forecasts the next 1-4 hours continuously.
02
No Forecast of A × P × Q Components
xMII calculates A × P × Q backwards from completed batches. AI-native forecasts each component forward — availability from failure prediction, performance from cycle-time models, quality from deviation forecasting.
03
Operators Get Numbers, Not Actions
xMII shows OEE was 62% — and leaves the operator to figure out why and what to do. AI-native ranks the top 3 actions that will move OEE most, with predicted point impact for each.
04
Diagnosis Burns Operator Time
In xMII plants, operators spend 30-40% of shift time on diagnosis — figuring out what's happening, where, and why. AI-native compresses that to under 10%, freeing the rest for execution work.
05
Tribal Knowledge Stays Tribal
The senior operator who knows "this OEE drop usually means valve V3" carries that knowledge in their head. When they retire it leaves with them. AI-native captures the pattern and serves it to every shift.
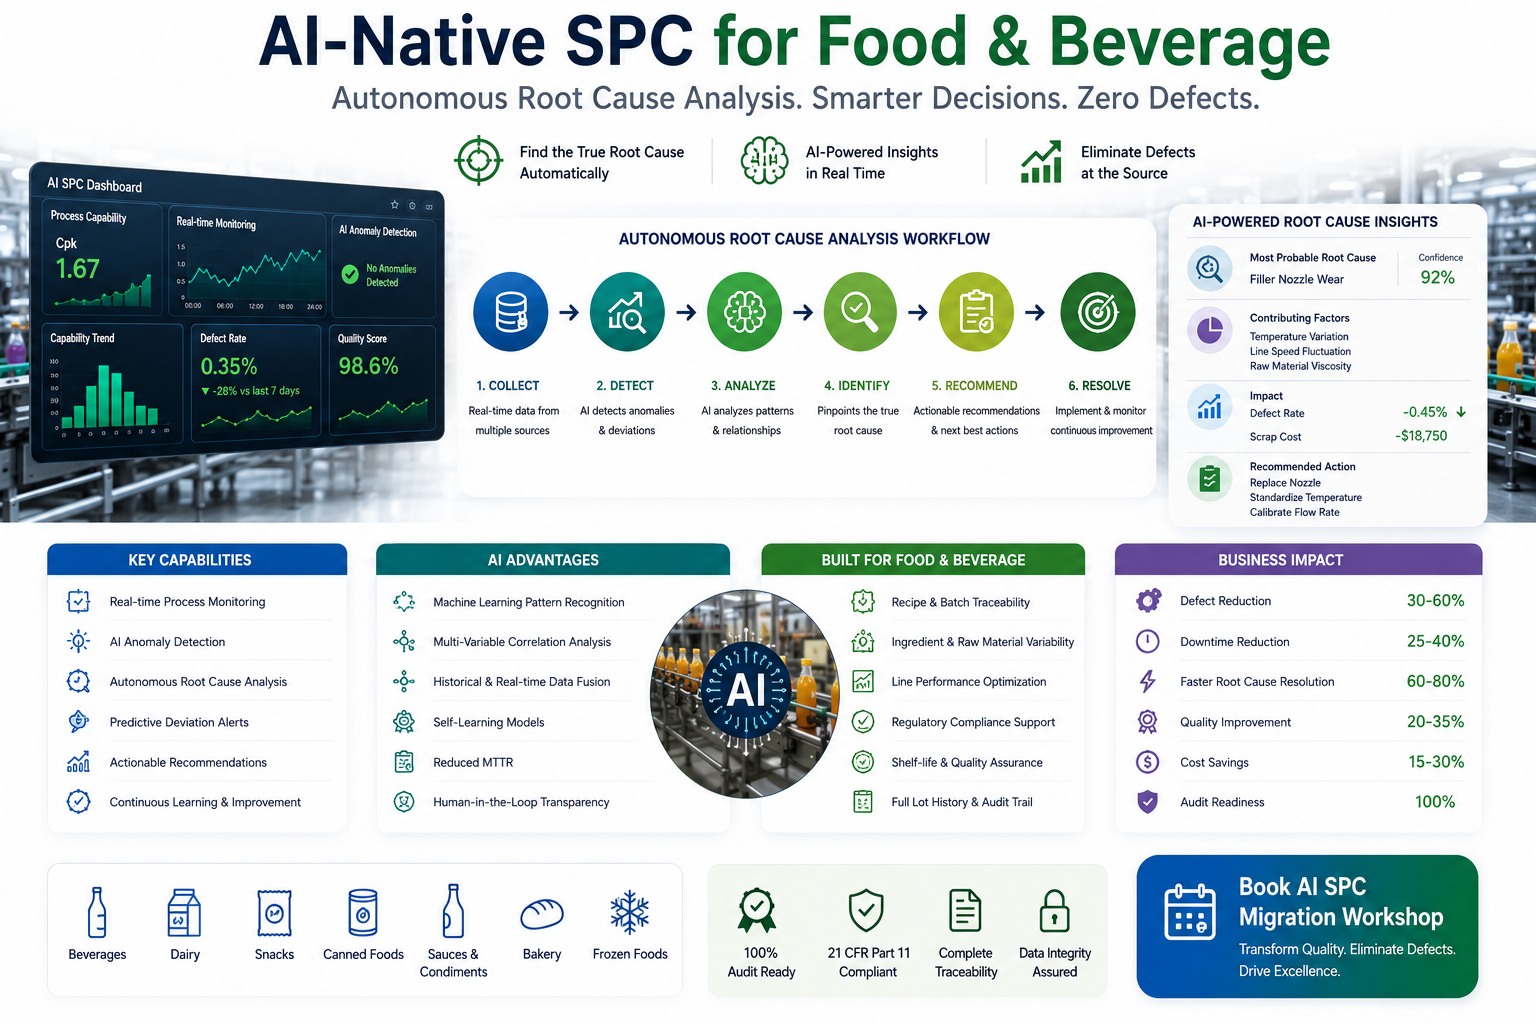
The 3 Predictive OEE Pillars · Detailed
Each of the three OEE components — Availability, Performance, Quality — has its own predictive model, its own lead time, and its own class of operator action. The deep-dive below shows what each pillar forecasts and what action it enables. Together the three pillars multiply into the OEE outcome the plant actually delivers.
Pillar A · Availability
Failure Forecast 2-4 Weeks Ahead
ML models correlate long-term sensor signatures (vibration spectra, thermal trends, motor current curves) against historical failure-precursor patterns. Detects developing failures weeks before traditional condition monitoring fires its first alarm. Maintenance gets scheduled during planned windows instead of becoming unplanned downtime.
Pillar B · Performance
Cycle-Time Forecast Hour-by-Hour
Multivariate models forecast cycle time and speed losses by the next hour — accounting for product mix, line conditions, environmental factors, and developing micro-stoppages. Operators see speed loss coming before the production board shows it as a drop in actuals.
Pillar C · Quality
Deviation Forecast 1-30 Minutes Ahead
Real-time inference detects micro-anomalies that precede a quality failure — sub-spec fill weight trending, seal heat starting to drift, vision noise increasing. Operator gets the alert before the first defective unit reaches the inspector. Quality-driven OEE losses (rework, scrap, holds) drop sharply.
Replace xMII OEE Reports With AI-Native OEE Forecasts
iFactory's F&B AI SPC practice deploys predictive OEE forecasting across Availability, Performance, and Quality components — with ranked operator actions and GenAI copilot guidance. Built on existing xMII infrastructure in 8-12 weeks per line. Designed for 10-15 OEE point improvement in year one.
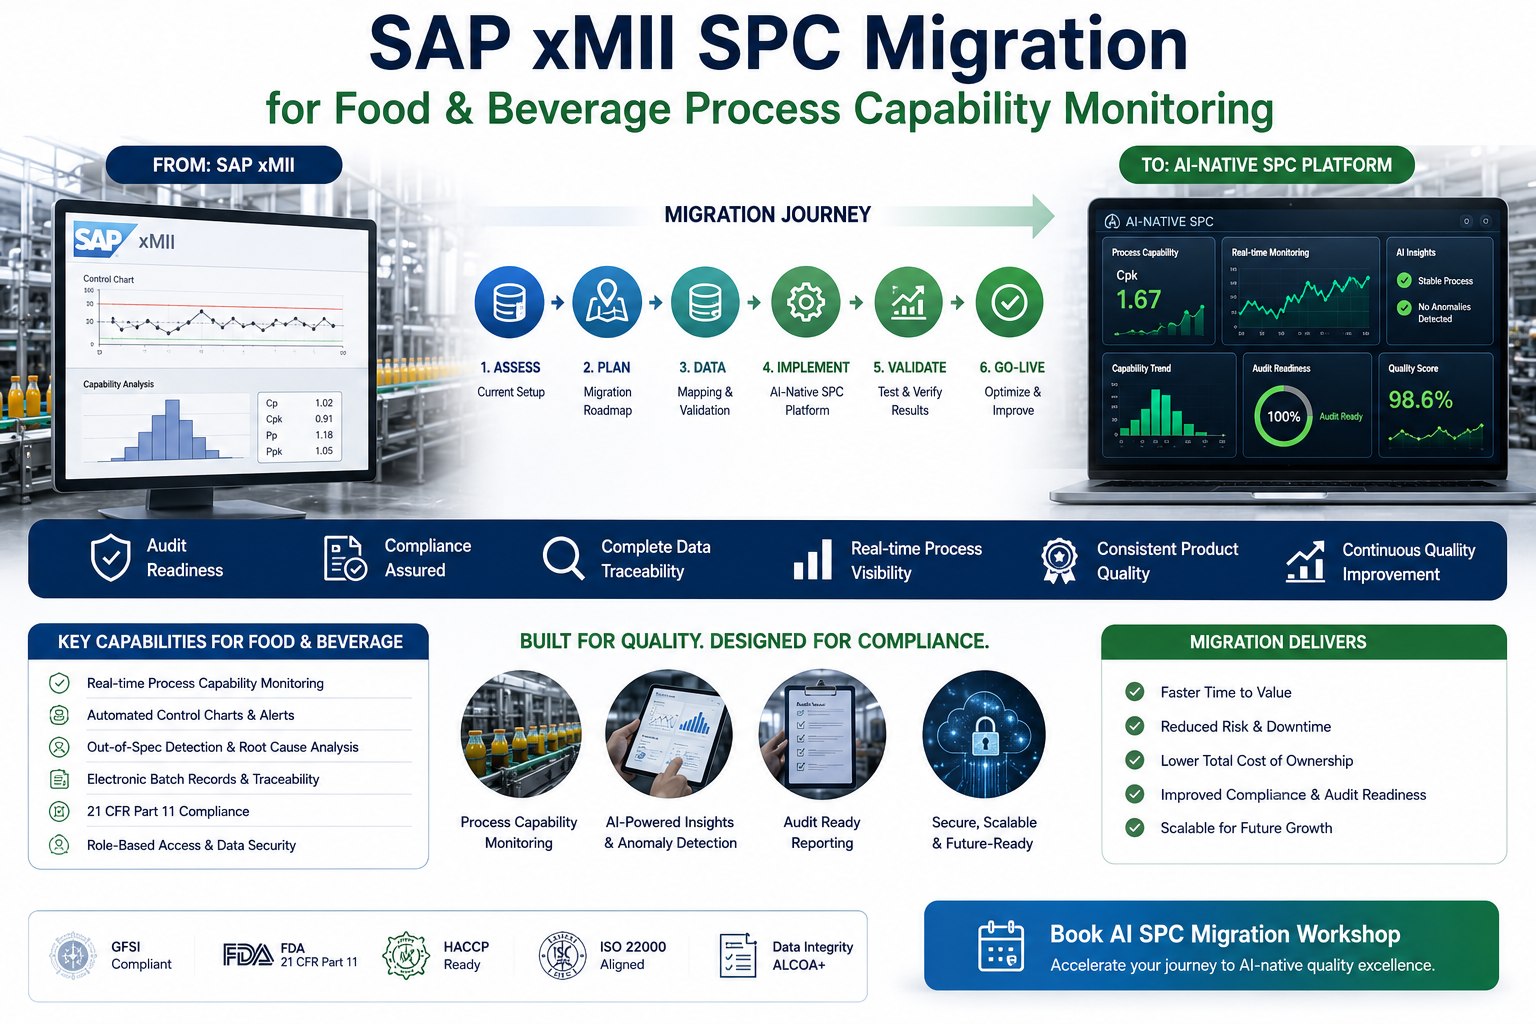
The Operator's Day · xMII vs AI-Native
The biggest productivity unlock isn't about smarter dashboards — it's about how the operator actually spends their 12-hour shift. The breakdown below shows where time goes under each platform. The "diagnosis to execution" ratio is the single best operator productivity metric for an F&B plant — and it tells the AI-native story more clearly than any OEE chart can.
Shift Time Spent On
xMII Plant
AI-Native Plant
Productivity Impact
Diagnosis & root cause hunting
30-40%
5-10%
Pre-ranked actions remove the hunt
Reading reports / SPC charts
15-20%
5-8%
Forecasts surface relevant data only
Manual data entry / logs
10-15%
2-4%
Auto-capture replaces transcription
Process execution & adjustment
20-25%
45-55%
Reclaimed time goes to value work
Improvement & coaching work
5-10%
15-20%
Capacity for continuous improvement
Walking / waiting / context switching
10-15%
5-8%
Mobile copilot keeps operator in flow
Want an operator-day audit for your plant? Book a productivity assessment with our F&B operations team.
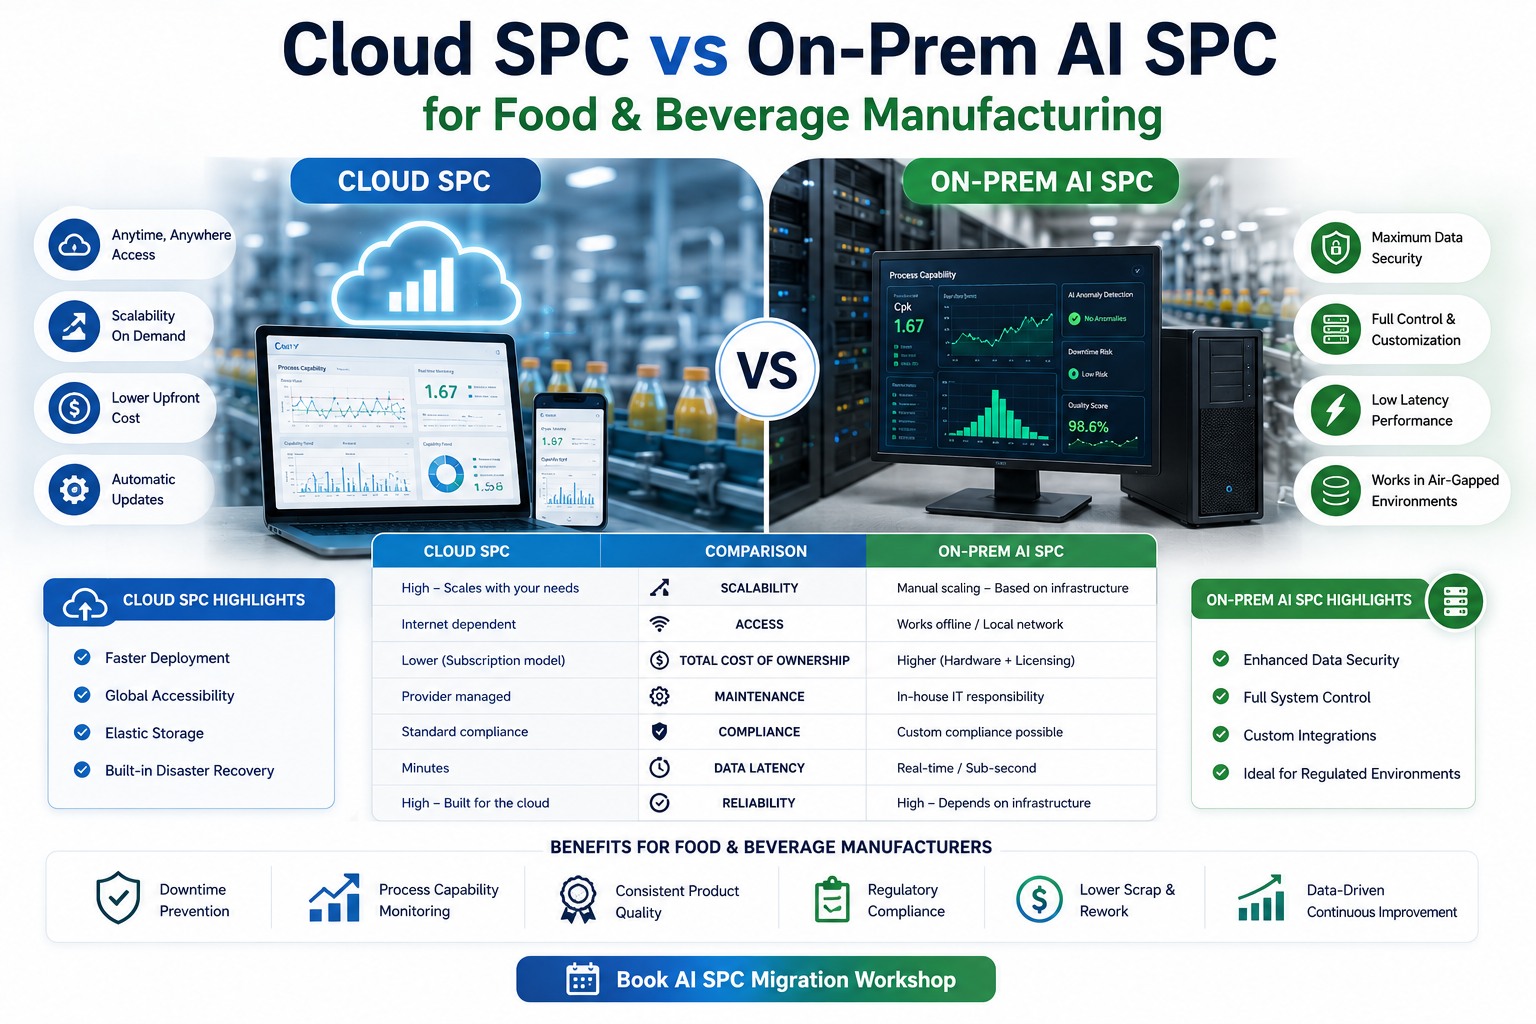
GenAI Operator Copilots · What They Actually Do
The GenAI operator copilot is the layer that translates AI-native OEE forecasts into actions the operator can execute without a degree in data science. The four capabilities below are what production-grade copilots in F&B operations actually deliver — not chatbots, but context-aware assistants tied to the plant's specific data and workflows.
Capability 01
Ranked Action Recommendations
Instead of "OEE dropped to 58%," the copilot shows the top 3 actions ranked by predicted OEE impact — "Tune cooker setpoint (+3.2 OEE pts), check seal heat on Line 2 (+1.8 pts), reduce filler speed 2% (+0.9 pts)." Operator works the list top-down.
Capability 02
Context-Aware SOP Retrieval
When the operator hits an unfamiliar condition, the copilot pulls the relevant SOP section — not a 50-page PDF, but the specific steps for this specific equipment under this specific condition. New operators ramp 3-5x faster.
Capability 03
Pattern-Match to Historical Events
Encounter a defect signature similar to one resolved six weeks ago, the copilot surfaces what was done last time and how well it worked. Tribal knowledge becomes plant-resident knowledge available to every shift.
Capability 04
Natural Language Process Query
"What's been the Cpk on cook temperature this week?" returns the chart and answer. "Show me last shift's micro-stoppages over 30 seconds" returns the timeline. Operators ask questions in their own language; SQL and BI become invisible.
Want to see GenAI copilots running in a live F&B plant? Connect with our solution team for a tailored demo.
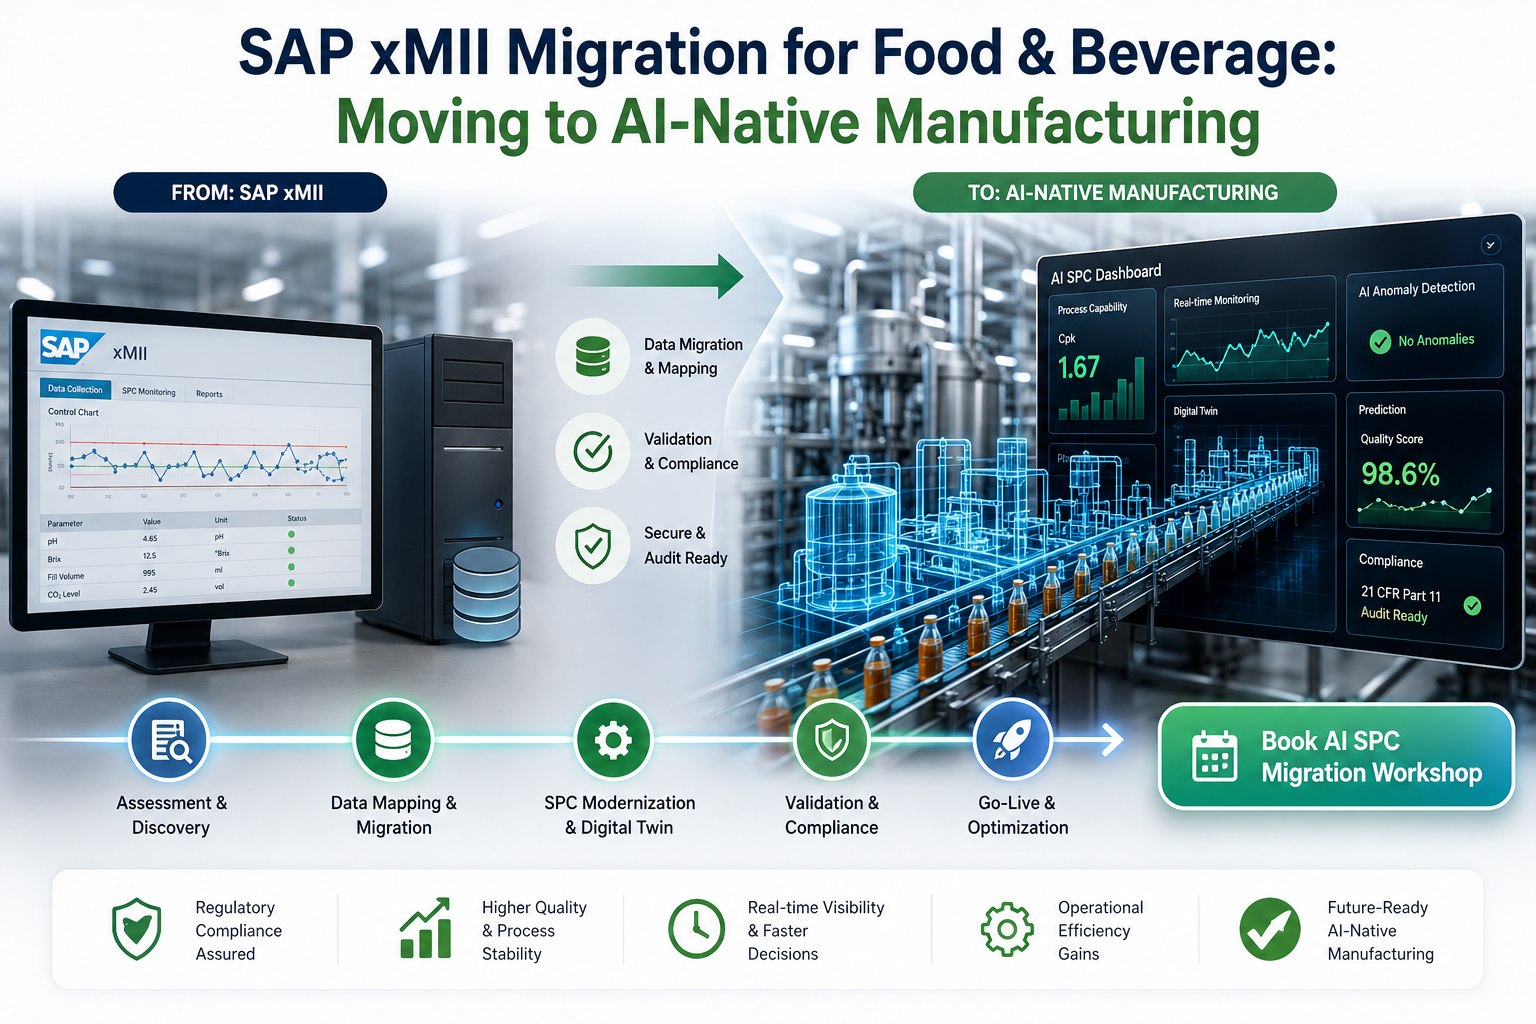
Migration Path · 4-Phase Roadmap in 8-12 Weeks
The predictive OEE layer deploys on existing xMII infrastructure with on-premise edge AI. Four phases take a plant from reactive xMII OEE reporting to a continuously running predictive OEE forecasting layer with GenAI operator copilots. Most plants see measurable OEE improvement starting in week 6.
Phase 1
OEE Baseline & xMII Inventory
Current OEE baseline by component · xMII data sources mapped · operator time allocation audit · Year 1 OEE opportunity quantified
Weeks 1-2
→
Phase 2
Edge Appliance & Forecasting Models
On-prem AI appliance installed · A × P × Q forecasting models trained on 6-12 mo historical data · xMII integration tested
Weeks 2-5
→
Phase 3
Operator Copilot Rollout
GenAI copilot deployed to operator tablets / panels · ranked actions tuned · SOP corpus indexed · shift training
Weeks 5-9
→
Phase 4
Full Predictive OEE Live
Predictive OEE primary metric · copilots in production · OEE improvement measured · xMII retained for transactional layer
Weeks 9-12
Need a tailored 4-phase roadmap for your operations? Book a roadmap planning session with our F&B AI team.
Expert Perspective
Every F&B plant manager I've worked with on the xMII-to-AI-native transition tells me the same story six months in. The OEE point gain is real and it's what executives focus on. But the change the floor actually feels isn't the OEE number — it's that the operators stopped spending half their shift trying to figure out what was wrong. Under xMII, the question every shift was "what is the line doing and why." Under AI-native predictive OEE, the question becomes "the line is forecasted to land at 76% — what are the three things I should do to get to 82." That's a completely different cognitive frame. The first question is a detective's frame. The second is an executor's frame. F&B plants don't need their best operators detecting what's wrong; that work is what the AI is for. They need their best operators executing the right actions in priority order, which is what the predictive OEE forecast plus the GenAI copilot delivers together. The plants that get this right reclaim 30-40% of operator shift time from diagnosis to execution work. That's the metric that flows through to operator retention, training time, and the OEE gain everyone wanted in the first place.
— F&B Plant Operations Best Practice, 2026
10-15 pt
OEE improvement · predictive year one
30-40%
Operator shift time reclaimed
3-5x
Faster troubleshooting · copilots
85%+
World-class OEE benchmark
Bottom Line · Forecast the Shift, Don't Just Report It
The xMII-to-AI-native transition for predictive OEE isn't really about better charts. It's about changing what the operator is being asked to do every shift. xMII reports the OEE that already happened and leaves the operator to figure out what to do next. AI-native predictive OEE forecasts where OEE is heading across all three components — Availability, Performance, Quality — and ranks the actions that will move it most. GenAI copilots translate the forecast into context-aware steps any operator can execute. The plants making the transition reclaim 30-40% of shift time from diagnosis to execution, recover the 5-8 OEE points hiding in unplanned downtime, the 4-6 points hiding in speed loss, and the 3-5 points hiding in quality-driven losses. Total OEE lift: 10-15 points in year one, taking F&B plants from the 60-65% average toward the 85%+ world-class benchmark — without replacing xMII for the transactional work it still does well. Layer the predictive OEE forecasting on top. Keep the system of record below. Win on both.
Replace OEE Reports With OEE Forecasts in 8-12 Weeks
iFactory's F&B AI SPC practice deploys predictive OEE — forecasting Availability, Performance, and Quality with ranked operator actions and GenAI copilots — on existing xMII infrastructure. Sovereign on-prem AI keeps recipe IP inside the plant. Built for 10-15 OEE point lift and 30-40% operator productivity gain in year one.
Frequently Asked Questions
What is predictive OEE and how is it different from xMII OEE?
xMII OEE calculates the metric backwards from completed batches — a report card of what already happened. Predictive OEE forecasts each component (Availability, Performance, Quality) forward for the next 1-4 hours. Availability is forecast from failure prediction 2-4 weeks ahead, Performance from cycle-time models hour-by-hour, Quality from deviation forecasts 1-30 minutes ahead. Operators get ranked actions before OEE drops, not after.
How much OEE improvement does predictive OEE deliver in F&B?
10-15 OEE point improvement in year one is typical. Breakdown: 5-8 points from Availability gains (unplanned downtime prevention via failure forecasting), 4-6 points from Performance gains (micro-stoppage and speed loss recovery), 3-5 points from Quality gains (deviation prevention before first defect). F&B plants commonly move from the 60-65% industry average toward the 85%+ world-class benchmark.
How does AI-native SPC improve F&B operator productivity?
Reclaims 30-40% of shift time. In xMII plants, operators spend 30-40% of the shift on diagnosis — figuring out what's happening and why. AI-native ranks actions by predicted OEE impact, so the diagnosis work is mostly done before the operator sees the dashboard. That reclaimed time goes to process execution (rises from 20-25% to 45-55%) and improvement work (rises from 5-10% to 15-20%).
What do GenAI operator copilots actually do in F&B plants?
Four capabilities: ranked action recommendations (top 3 actions with predicted OEE impact for each), context-aware SOP retrieval (specific steps for this condition, not a 50-page PDF), pattern-match to historical events (surfaces what was done last time this defect signature appeared and how well it worked), and natural language process query (operators ask questions in their own language and get the chart or answer back).
How long does predictive OEE implementation take?
8-12 weeks per line across 4 phases: OEE Baseline & xMII Inventory (Wk 1-2, current OEE baseline and operator time audit), Edge Appliance & Forecasting Models (Wk 2-5, A × P × Q models trained on historical data), Operator Copilot Rollout (Wk 5-9, GenAI copilot deployed and tuned), Full Predictive OEE Live (Wk 9-12, predictive OEE primary metric, xMII retained for transactional layer). Measurable OEE gain from week 6.
Book a workshop for your operations.