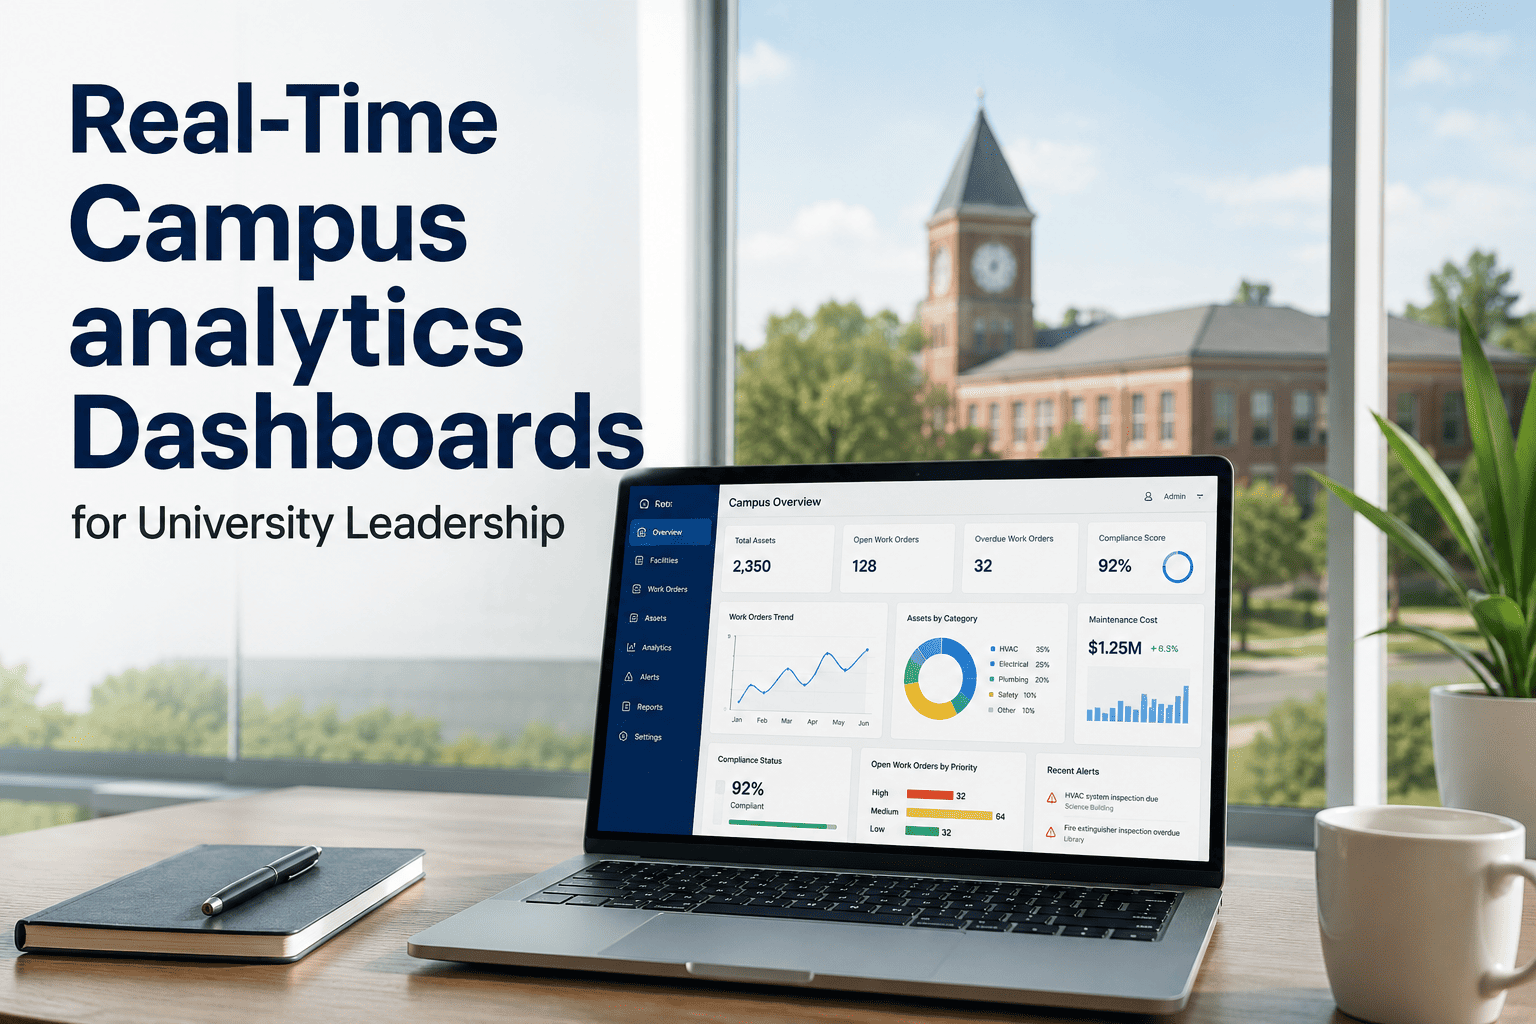
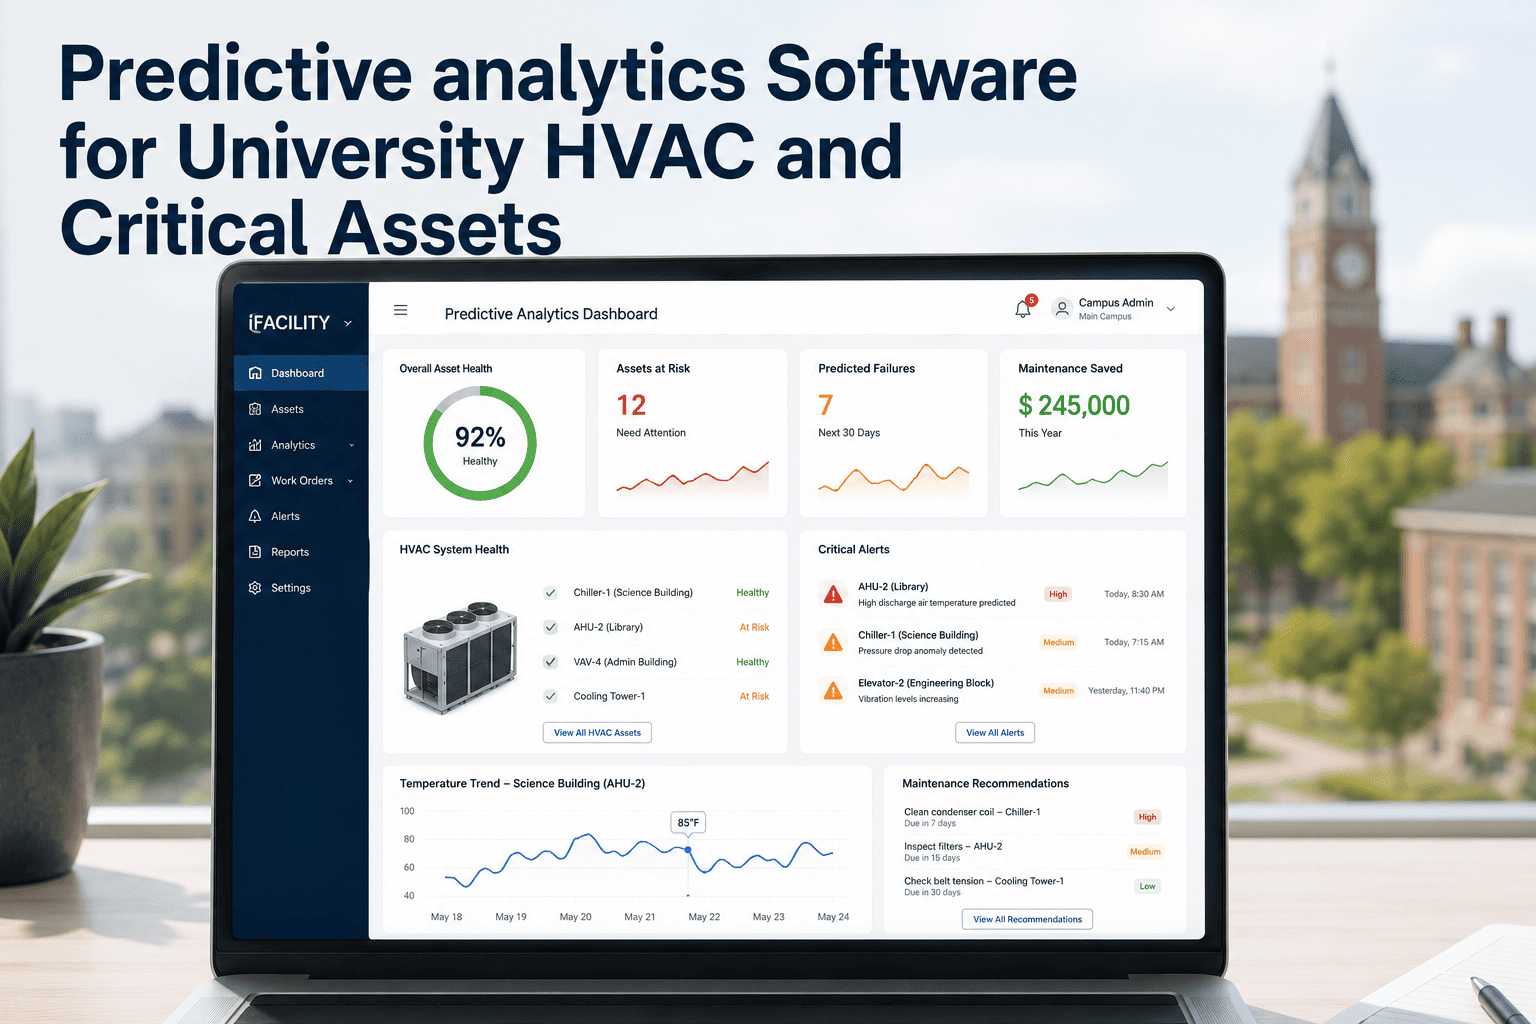
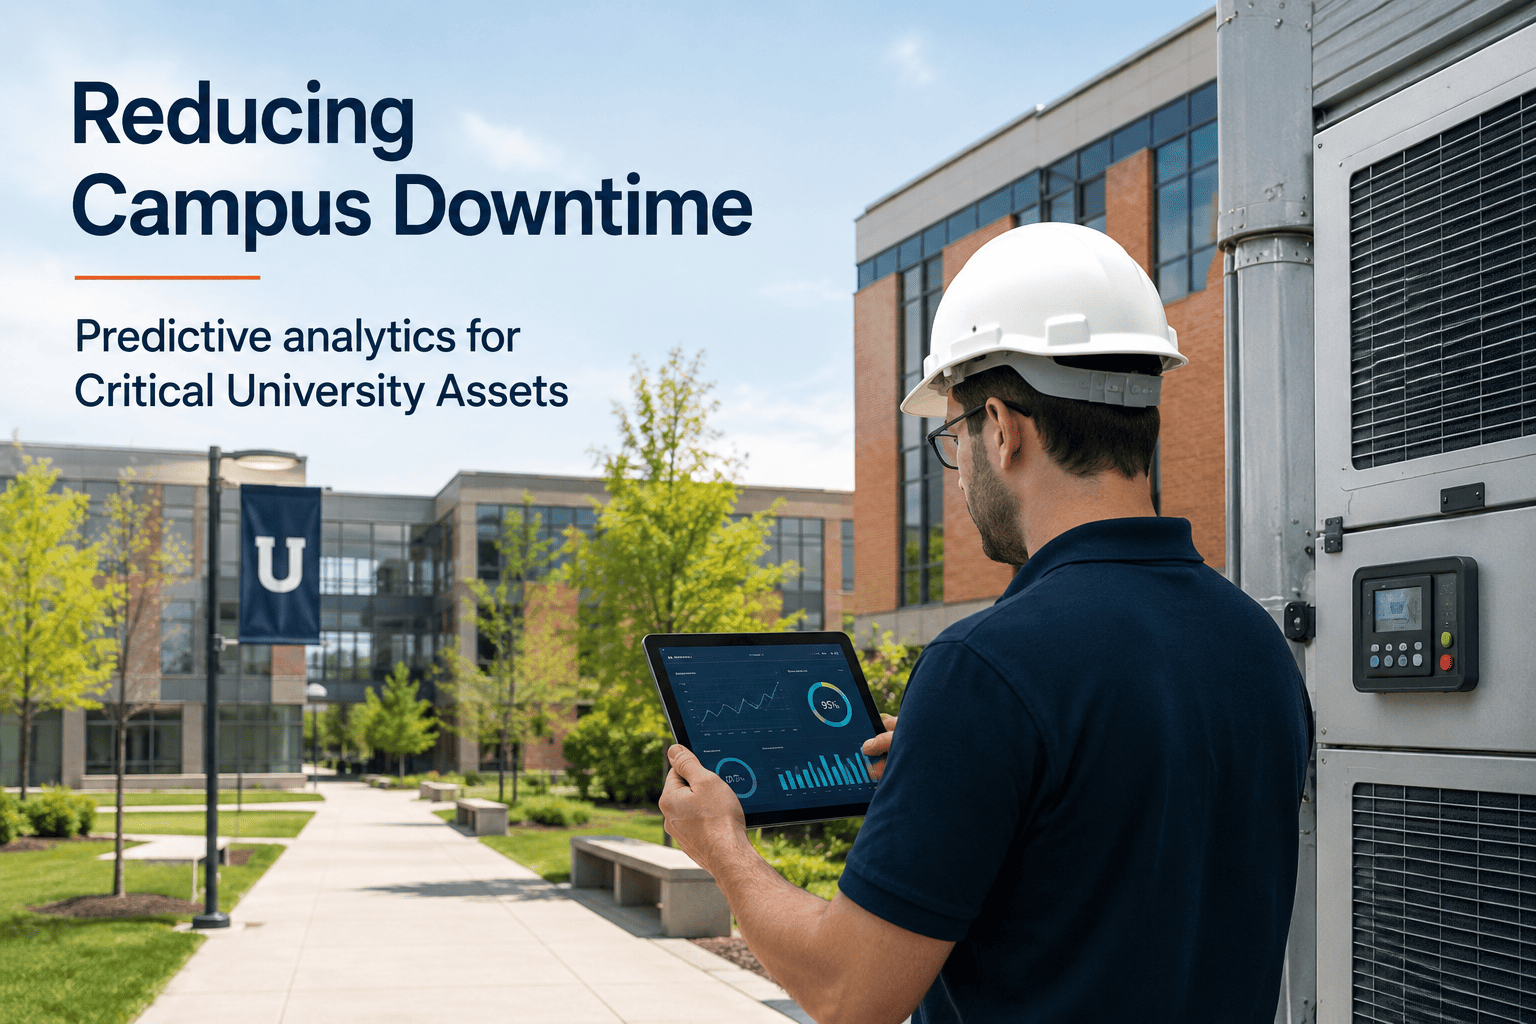
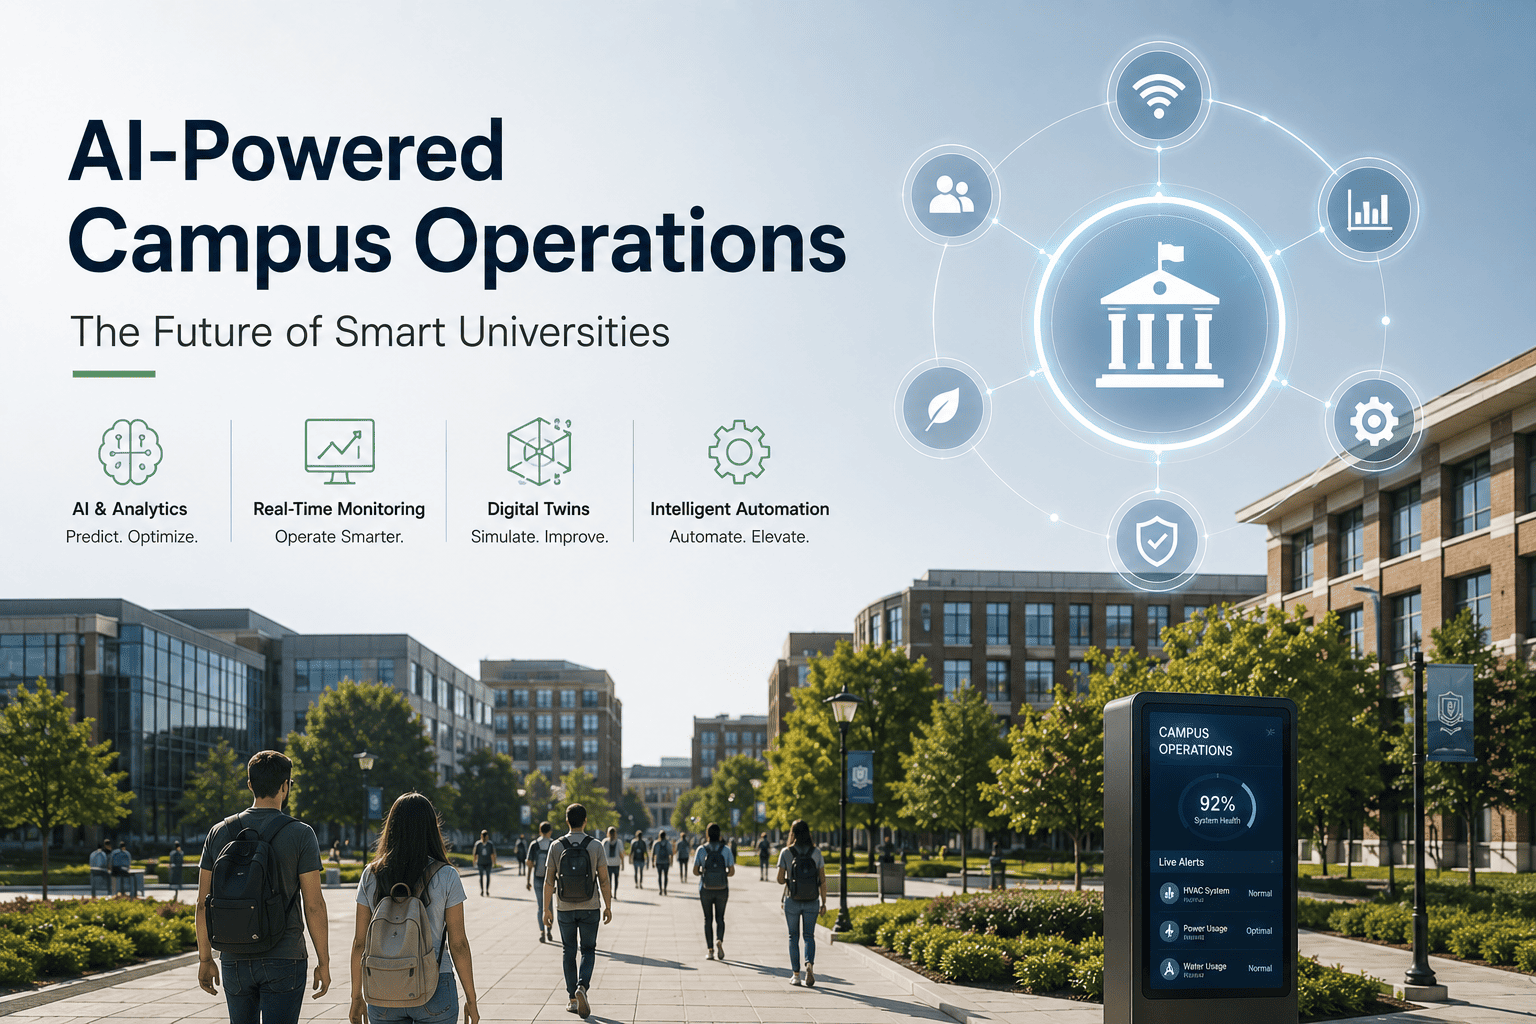
Universities manage thousands of assets — HVAC systems, electrical distribution, elevators, chillers, boilers — running 24/7 across hundreds of buildings. A single chiller failure mid-winter affects 5,000+ students. An elevator stoppage traps occupants and triggers regulatory citations. An electrical fault creates fire risk. Most universities discover these problems when they happen, not before. Machine learning changes this. By analyzing vibration, temperature, current draw, and operational patterns, AI models predict failures 48-72 hours in advance — before equipment stops, before students are affected, before emergency repairs drain budgets. This guide covers how ML-powered campus analytics work, what data feeds them, and why leading universities are deploying these systems now. To see AI campus analytics in action at a facility similar to yours, schedule a technical walkthrough with our team.
Campus Analytics · Machine Learning · 2026
AI-Powered Campus Analytics: How Machine Learning Prevents Infrastructure Failures
Predictive failure analysis · Real-time asset intelligence · HVAC, electrical, elevator, and chiller monitoring · 48-72 hour advance warning · Facility risk elimination.
48-72hr
Advance failure prediction
73%
Emergency downtime reduction
$2-5M
Annual emergency repair cost avoided
99.2%
Infrastructure availability
Why Campus Infrastructure Demands ML-Powered Analytics
University campuses operate as integrated systems — HVAC feeding electrical load, water pressure affecting fire suppression, elevator use patterns dependent on class schedules. Traditional asset monitoring treats each system separately: "Chiller running at 2,000 RPM" is normal data. AI-powered campus analytics sees the entire pattern: "Chiller bearing temperature +3°C from baseline, vibration increasing 15% weekly, motor current draw rising — bearing failure likely in 72 hours." This holistic, pattern-based intelligence is fundamentally different from reactive maintenance alerts.
University Campus Infrastructure Ecosystem
HVAC Systems
Chillers & Boilers
Chiller failures affect 2,000+ occupants · downtime cost $8K-15K/hr
Bearing, compressor, heat exchanger PdM
Electrical Systems
Distribution & Transformers
Electrical faults create fire risk · arc flash hazard
Load analysis, fault prediction, aging detection
Vertical Transport
Elevators & Escalators
Stoppage traps occupants · regulatory citations · $50K+ emergency repairs
Cable tension, brake wear, motor efficiency monitoring
Water Systems
Pumps, Pipes & Cooling Towers
Pipe rupture floods facilities · cooling tower legionella risk
Pressure trending, vibration analysis, water quality
Emergency Systems
Generators & Fire Suppression
Generator failure during outage → campus dark · Fire system failure → life safety liability
Fuel quality, battery health, sprinkler readiness monitoring
Four Infrastructure Problems ML Analytics Solves
01
Chiller & Boiler Bearing Failures — Predictable, Preventable
Chiller bearing wear follows a physics pattern: vibration increases weekly, bearing temperature rises by 2-4°C, motor current draw increases subtly. Reactive monitoring catches this when chiller stops (emergency closure). ML models trained on 500+ chiller failure datasets identify the pattern 72 hours before failure. Universities schedule bearing replacement during planned downtime instead of mid-semester emergency shutdown affecting 5,000 students.
Bearing PdM72hr predictionPlanned replacement
02
Electrical Transformer Aging & Fault Risk Detection
Electrical transformers age predictably — core insulation degrades, winding resistance increases, fault current response changes. These changes are invisible in normal operation until catastrophic failure (fire, arc flash). ML models analyze voltage harmonics, load patterns, and thermal imaging to quantify transformer health. Universities identify aging transformers 3-5 years before failure, schedule replacement proactively, eliminate fire and arc flash risk.
Transformer aging model5-year lead timeFire risk prevention
03
Elevator Cable & Brake Wear — Safety & Compliance
Elevator failures strand occupants and trigger ASME safety violations. Cable wear and brake degradation follow measurable patterns in load, vibration, and motion characteristics. ML models detect cable tension anomalies and brake response delays 48-72 hours before failure. Campus facilities schedule inspections and component replacement before exceeding regulatory safety thresholds.
Cable wear predictionBrake health scoringASME compliance
04
Cooling Tower Legionella & Water System Integrity
Cooling tower legionella risk, pipe scale, and pump cavitation are all pressure/flow/temperature signatures that ML can monitor continuously. Biofilm growth affects water quality in measurable patterns. ML models identify water quality degradation before legionella counts spike, triggering proactive treatment. Universities eliminate cooling tower closures (common compliance action) and maintain campus cooling reliability year-round.
Legionella risk modelingWater quality trendingZero-closure operations
How ML Campus Analytics Actually Work: The Technical Layer
Machine learning campus analytics rest on three technical foundations: continuous sensor data collection, trained predictive models, and real-time inference. Here's what's actually happening under the hood.
Chiller bearing health
Vibration (Hz), temperature (°C), motor current (A), runtime hours
Time-series LSTM + anomaly detection
Bearing failure probability % · time-to-failure (hours)
Transformer insulation
Dissolved gas analysis (DGA), load cycle, oil temperature, fault current response
XGBoost classification + regression
Transformer health score (0-100) · fault risk level
Elevator cable tension
Cable load cells, acceleration profiles, passenger count, door cycles
Gradient boosting + physics-informed neural net
Cable tension deviation % · replacement urgency score
Water system quality
Cooling tower outlet temp, biofilm sensors, pH, chlorine residual, flow rate
Ensemble models (Random Forest + LSTM)
Legionella risk score · treatment recommendation
Generator fuel quality
Fuel water content, viscosity, start test results, load response time
Logistic regression + anomaly clustering
Fuel degradation rate · contamination probability
Campus Deployment Case Study: Large University Chiller Analytics
Campus operates 8 chillers across 4 plants — serving 250+ buildings. Baseline: 2-3 unplanned chiller failures per year, each costing $120K-200K in emergency repairs and lost cooling. ML models trained on chiller telemetry (vibration, temperature, current, pressure) from 18-month baseline period. Models identify bearing wear pattern 72 hours before historical failure threshold.
Data sourcesVibration sensors · RTD thermometers · Current transducers · PLC feeds
Prediction accuracy87% true positive rate on bearing failures (year 2 deployment)
Business impactFrom 2-3 emergency failures/year → 0-1 unplanned failure/year. Savings: $180K-300K annually
ImplementationExisting chiller sensors + central ML server · no hardware replacement
Schedule ML Demo
University has 40+ transformers (10-45 MVA) distributed across campus. Typical lifespan: 30-40 years, but aging patterns vary. ML models combine dissolved gas analysis (DGA) data, oil temperature trends, load history, and fault test results to score transformer remaining useful life (RUL). Identifies 10+ transformers in accelerated aging state — enabling proactive replacement before unplanned failure.
Model trainingIEEE transformer failure database + university historical data (5-year records)
RUL estimationRemaining useful life 2-7 years (vs assumption of 30-year uniform lifespan)
Risk reductionEliminated unplanned transformer failures (2018-2024 baseline: 1 failure every 18-24 months)
Capital planningML enables 5-year replacement roadmap based on risk, not age assumptions
Schedule ML Demo
University depends on backup generators during grid outages (critical research, medical facilities, network infrastructure). Diesel fuel degrades over time — water contamination, microbial growth, viscosity loss all reduce generator startability. ML models track fuel quality trends from monthly lab tests and predict fuel degradation 2-3 months in advance. Campus performs fuel replacement before quality falls below operational threshold.
Prediction targetFuel water content >500 ppm or viscosity >4 cSt (out-of-spec risk)
Lead time60-90 day advance warning from ML trend model
ReliabilityZero generator fuel-related start failures (vs historical 1-2 incidents per year)
Maintenance costPlanned fuel replacement ($5K) vs emergency fuel flushing + service ($25K+)
Schedule ML Demo
What Leading Universities Are Measuring
73%
Reduction in emergency infrastructure downtime
From 2-3 unplanned failures/year → 0-1 per year on monitored systems
$2-5M
Annual emergency repair cost avoided
Chiller ($180K), Transformer ($250K+), Elevator ($50K), Water ($40K+)
99.2%
Infrastructure availability (uptime)
Monitored campus systems achieve near-99.9% uptime (vs 96-98% baseline)
48-72hr
Advance failure prediction window
Enables planned maintenance during break periods, not mid-semester emergency
ML Model Training: How Prediction Accuracy Improves Over Time
ML campus analytics don't arrive fully accurate. Models improve as campus operational data accumulates. Here's the typical progression:
Month 1-3: Baseline Learning
Models learn your campus's normal operational patterns — chiller baselines, transformer load cycles, elevator utilization by time-of-day. Prediction accuracy is 65-70% (conservative, prone to false positives). False alerts are expected and marked as "normal for your campus."
Month 4-9: Pattern Refinement
Models understand seasonal variations (summer chiller load, winter heating demand), semester schedules (low occupancy during breaks), and equipment-specific drift patterns. Accuracy improves to 78-82%. False alarm rate drops significantly. Operators gain confidence in alerts.
Month 10-18: Predictive Maturity
Models have seen 1-2 full years of your campus cycle. Accuracy reaches 85-92% on bearing/thermal failures. Model can distinguish real degradation from normal variation. Operators rely on alerts without hesitation. First prevented failures are documented.
Month 19+: Continuous Improvement
Model accuracy increases with every prevented failure case added to training data. Year 3-5 accuracy reaches 92-96% on mature systems. Universities achieve measurable reduction in emergency maintenance and unplanned downtime.
Frequently Asked Questions
Deploy ML-Powered Campus Analytics for Your University
Real-time asset intelligence across HVAC, electrical, elevator, water, and emergency systems. 48-72 hour advance failure prediction. Zero emergency downtime infrastructure management. Deploy in 4-6 months and start preventing failures immediately.
Chiller PdM
Transformer Health Scoring
Elevator Safety Monitoring
Water Quality Intelligence
Generator Reliability