Campus Energy Crisis: How Universities Are Reducing Utility Costs with AI

By Jacob on May 25, 2026

campus-energy-crisis-ai-cost-reduction

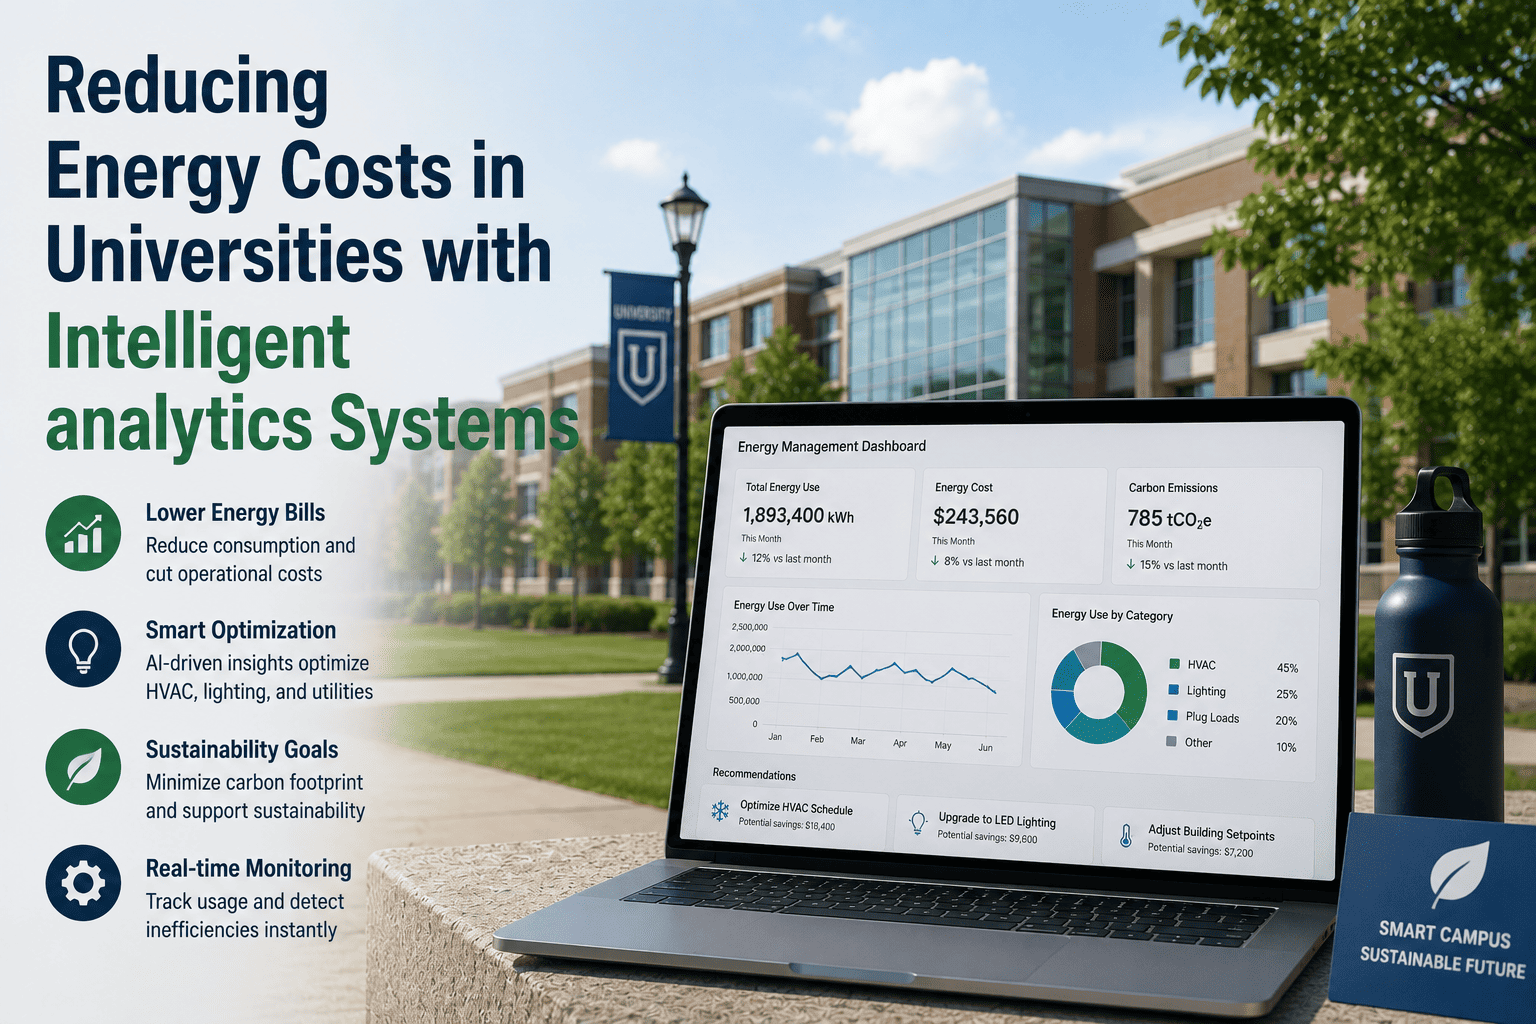
Energy is the second-largest operating expense at U.S. universities after personnel, and in 2026 it is also the fastest-growing one. Utility costs across higher education have risen 34% over the past five years while campus square footage grew only 8%. The gap is not a supply problem. It is a visibility problem. Most campuses manage energy at the aggregate bill level with no per-building consumption data, no system-level fault detection, and no way to distinguish planned usage from the HVAC degradation, phantom loads, and scheduling failures that are driving 30-40% of their utility spend. AI-driven energy management platforms solve this at the building level, continuously. Documented deployments across universities and K-12 districts show 15-19% energy cost reductions within 18 months on existing infrastructure with no capital equipment replacement required. See what AI energy monitoring finds on campuses like yours — Book a Demo.

EDUCATION INDUSTRY · ENERGY COST OPTIMIZATION · SUSTAINABILITY 2026
Campus Energy Crisis: How Universities Are Reducing Utility Costs with AI
Universities face rising utility costs driven by HVAC inefficiency, phantom loads, and scheduling failures invisible at the aggregate bill level. AI-powered energy monitoring identifies and eliminates waste building by building with documented 15-19% cost reductions.
15-19%Energy Cost Reduction Documented
30-40%Avg Campus Energy Waste
$14BAnnual U.S. Education Energy Spend
60-90Days to Full Deployment

The Campus Energy Problem No One Is Measuring Correctly

The way most universities measure energy is the source of the problem. A single utility bill for the entire campus tells facilities leadership that costs went up 12% this quarter but cannot tell them which three buildings are responsible for 40% of the overage, which HVAC units are running 18 hours per day in unoccupied wings, or which chiller has been operating at degraded efficiency for six weeks because no one flagged the performance decline.

Without per-building, per-system energy visibility, every energy reduction initiative targets the symptom — the bill — rather than the cause — the specific building systems generating waste. Sustainability commitments made without this visibility produce incremental gains at significant cost. AI energy management produces structural reductions by resolving the actual sources of waste from continuous monitoring data, building by building, system by system. Find out what your campus is wasting before the next utility bill arrives — Book a Demo.

Institution TypesFour-year universities, research institutions, community colleges, K-12 districts managing multi-building campuses
Energy Systems MonitoredHVAC, chillers, boilers, lighting, electrical distribution, domestic hot water, laboratory ventilation, data center cooling
Primary Waste SourcesUnoccupied space conditioning, HVAC degradation, scheduling failures, simultaneous heating and cooling, phantom loads
IntegrationOpen API with existing BMS, smart meters, IoT sensors, and ERP — no system replacement or data migration required
Deployment TimelinePer-building visibility live in 60-90 days; full AI optimization model at 12-18 months of campus-specific data
Documented Outcome15-19% energy cost reduction, EPA and state energy reporting automated, sustainability metrics current for accreditation

Where Campus Energy Waste Actually Comes From

Campus energy waste is not one problem. It is six overlapping problems operating simultaneously across every building in the portfolio. Most institutions resolve one or two through manual intervention while the others continue compounding. AI energy management resolves all six continuously from the same monitoring layer.

30-40%
Of campus energy budget consumed conditioning unoccupied spaces. Fixed HVAC schedules do not respond to actual occupancy. Classrooms held at full conditioning during breaks, holidays, and evenings account for the single largest recoverable waste category. Without occupancy sensor integration, no one knows which spaces are empty and which systems are running unnecessarily.
18-26%
Chiller and HVAC efficiency loss from undetected degradation. Chiller performance degrades gradually and invisibly without continuous monitoring. A chiller operating at 75% efficiency consumes the same energy as one at 100% while delivering less cooling — generating a cost premium that is invisible at the aggregate bill level and undetectable without per-system performance tracking against baseline.
15-25%
Additional waste from simultaneous heating and cooling in the same zone. BMS control sequences frequently generate simultaneous heating and cooling in adjacent zones — a direct energy waste with no thermal benefit. This is one of the most common and costliest inefficiencies on campuses with aging BMS infrastructure and cannot be detected without per-zone monitoring of supply air temperature and control signal correlation.
8-12%
Of campus energy from laboratory fume hood and ventilation over-ventilation. Research buildings ventilate at fixed air change rates regardless of actual chemical use. Demand-controlled laboratory ventilation reduces ventilation rates during low-occupancy periods. Without lab-specific energy monitoring, these opportunities are invisible and the over-ventilation continues year-round at significant cost.
34%
Rise in university utility costs over five years versus 8% campus growth. The gap between cost growth and usage growth is not explained by energy prices alone. Deferred maintenance on HVAC systems, aging controls infrastructure, and the absence of per-building monitoring have allowed efficiency losses to compound across the portfolio without triggering intervention because no one had the data to see them building by building.
The campus energy bill is not an energy problem. It is a visibility problem. Universities that install per-building AI monitoring consistently find that 3-5 buildings account for 40-60% of their recoverable waste — and that none of those buildings were on anyone's priority list before the data arrived.

How AI Energy Management Works: Six Core Capabilities

AI energy management platforms replace aggregate bill monitoring with continuous, building-level intelligence that identifies waste sources, predicts equipment failures driving inefficiency, and automates the scheduling adjustments that deliver sustained reductions. See these capabilities running on a live campus energy dashboard — Book a Demo.

Per-Building Energy Benchmarking
  • Real-time energy consumption tracked per building against dynamic seasonal baselines
  • Buildings consuming 15%+ above baseline automatically flagged for investigation
  • Consumption rankings across campus identify highest-priority reduction targets
  • Weather-normalized comparisons isolate operational waste from climate variation
Occupancy-Driven HVAC Scheduling
  • Occupancy sensor data replaces fixed timer-based HVAC programming campus-wide
  • Unoccupied spaces setback automatically without manual schedule management
  • Semester, holiday, and event schedules integrated from institutional calendar systems
  • 30-40% of unoccupied conditioning waste eliminated from the first semester of operation
HVAC and Chiller Fault Detection
  • Continuous performance monitoring detects chiller efficiency loss within hours of onset
  • Simultaneous heating and cooling conflicts identified and flagged automatically
  • Economizer lockout failures and sequence-of-operations deviations detected in real time
  • Maintenance triggered at optimal intervention point before efficiency loss compounds
Demand Response and Peak Management
  • Electrical demand monitored continuously with peak-period load reduction automated
  • Utility demand charge management reduces peak billing charges without comfort impact
  • Renewable energy source optimization integrated where campus solar or storage exists
  • Demand response event participation automated for utility incentive programs
Sustainability and Reporting Automation
  • EPA ENERGY STAR, carbon, and state energy reporting generated automatically from live data
  • Accreditation sustainability metrics current without manual data collection cycles
  • LEED and STARS performance tracking updated continuously from operational monitoring
  • Board and president sustainability dashboards generated on demand from live campus data
Integration with Existing Campus Systems
  • Open API connects existing BMS, smart meters, IoT sensors, and CMMS in 60-90 days
  • No replacement of existing building automation or energy management systems required
  • Maintenance and energy data correlated to identify equipment failures driving cost spikes
  • Energy intelligence feeds directly into capital planning and FCI scoring dashboards

Implementation Timeline: Per-Building Visibility to Full Optimization

AI energy management follows a four-phase deployment sequence that delivers measurable cost reductions at each milestone. No capital equipment replacement is required. Service delivery is uninterrupted throughout all phases.

Months 1-2Foundation
Per-Building Visibility Live
  • BMS, smart meters, and IoT sensors connected via open API
  • Per-building consumption dashboard live for all campus buildings
  • Baseline consumption profiles established for each building and system
  • First waste sources identified and flagged within 30 days of deployment
Months 3-6Optimization Live
Occupancy Scheduling and Fault Detection
  • Occupancy-driven HVAC scheduling active across all monitored buildings
  • Fault detection alerts generating for HVAC and chiller inefficiencies
  • Peak demand management active with first billing cycle savings documented
  • Initial energy cost reductions measurable at end of first full semester
Months 7-12Sustainability
Reporting and Capital Integration
  • Sustainability reporting automated for EPA, state, and accreditation requirements
  • Energy performance integrated into FCI and capital planning dashboard
  • Laboratory ventilation optimization active across research buildings
  • Energy cost reductions tracking toward 15-19% documented range
Months 13-18Full Maturity
Peak AI Model Accuracy
  • 15-19% energy cost reduction fully documented against pre-deployment baseline
  • AI model accuracy at peak from 18 months of campus-specific seasonal data
  • Carbon reduction metrics documented for sustainability commitments reporting
  • Energy ROI compounding as model sharpens with additional campus history

Documented Energy Outcomes at University and K-12 Deployments

All outcomes below are measured against pre-deployment baselines on the same operational budgets. No capital equipment replacement was required to achieve any result. Model these outcomes against your campus energy profile and current utility spend — Book a Demo.

Energy Operating Costs
Before AI Energy Management
Aggregate bill management, no per-building visibility, costs rising 6-8% annually
After 18 Months
15-19% cost reduction documented, per-building intelligence continuously updated
The 15-19% reduction is achieved from existing infrastructure without equipment replacement. Occupancy-driven scheduling eliminates the largest single waste category in the first semester. Fault detection resolves the HVAC degradation issues driving cost spikes in subsequent months. The AI model sharpens each semester as it accumulates campus-specific seasonal and occupancy patterns.
Maintenance-Energy Correlation
Before AI Energy Management
Energy cost spikes not linked to equipment failures, maintenance reactive to complaints
After 18 Months
Equipment failures driving energy spikes identified in hours, maintenance dispatched proactively
Energy consumption data and maintenance records are correlated in the unified platform. A chiller showing a 22% efficiency decline triggers both an energy alert and a maintenance work order simultaneously — closing the gap between energy waste detection and physical intervention that manual systems cannot bridge without a shared data layer.
Energy MetricWithout AI ManagementWith AI ManagementChange
Total Energy Operating CostsRising 6-8% annually15-19% reduction documented-15% to -19%
Unoccupied Space Conditioning30-40% of budget wastedEliminated via occupancy scheduling-30% to -40% of waste
HVAC Fault Detection SpeedWeeks to months undetectedHours from onset of degradationDays to hours
Per-Building VisibilityAggregate bill onlyReal-time per building and systemFull visibility
Sustainability Reporting HoursDays of manual collectionAutomated on demandSame day
Carbon Emissions TrackingAnnual estimated onlyContinuous per-building measurementReal-time
Peak Demand ChargesUnmanagedReduced via automated load management-10% to -15%
Maintenance Cost Linked to EnergyNot correlatedUnified data layer, joint alertsIntegrated
-19%
Energy Costs
-40%
Occupancy Waste
Hours
Fault Detection
Auto
Sustainability Reports
Find Out What Your Campus Is Wasting Before the Next Utility Bill Arrives.
The platform connects to existing BMS, smart meters, and sensors via open API. Per-building visibility is live within 60-90 days. No system replacement required.

Frequently Asked Questions

Do we need to install new smart meters or IoT sensors to deploy this?
Not necessarily. The platform connects to existing BMS, meters, and sensors already installed on campus. A sensor gap assessment in the first two weeks identifies any coverage gaps. Most campuses achieve significant energy intelligence from existing infrastructure alone. Find out what your existing sensors can reveal right now — Book a Demo.
How quickly will we see energy cost reductions after deployment?
The largest quick win — unoccupied space conditioning — begins reducing costs in the first semester as occupancy-driven scheduling activates. Fault detection resolves efficiency losses in months 3-6. The full 15-19% documented range is reached by month 18 as the AI model matures. Get a projected reduction timeline modelled against your campus size and usage patterns — Contact Support.
Can the platform support our sustainability and carbon reporting requirements?
Yes. EPA ENERGY STAR, carbon tracking, LEED, STARS, and state energy reporting are automated from live monitoring data. Accreditation sustainability sections and board sustainability dashboards are generated on demand without manual data collection. See a sample sustainability report generated from live campus energy data — Book a Demo.
Does this platform replace our existing building management system?
No. The platform connects to and augments your existing BMS through open API integration. It adds AI analytics, fault detection, and optimization intelligence on top of what you already have. Major BMS platforms from Johnson Controls, Siemens, Honeywell, and Schneider are all supported. Confirm compatibility with your specific BMS before the demo — Contact Support.
How is this different from the energy dashboard our BMS vendor already provides?
BMS dashboards show what the system is doing. AI energy management shows what the system should be doing, flags deviations, correlates energy anomalies with maintenance failures, and continuously optimizes scheduling against actual occupancy — capabilities that require a separate AI analytics layer above the BMS. See the difference between BMS reporting and AI energy optimization in a live side-by-side demo.
What happens to energy savings after the first 18 months?
The AI model continues improving in accuracy as it accumulates more campus-specific seasonal and occupancy data. Documented deployments show energy performance continuing to improve past month 18 as the model identifies increasingly subtle waste sources that only become visible with multi-year operational history. See multi-year energy performance data from deployed campuses — Contact Support.
CAMPUS ENERGY MANAGEMENT · AI COST REDUCTION · SUSTAINABILITY 2026
Ready to Reduce Your Campus Energy Costs with AI?
AI-driven energy management is deployable on your existing campus infrastructure with documented 15-19% cost reductions across universities and K-12 districts. Per-building visibility live in 60-90 days. No system replacement required.

Share This Story, Choose Your Platform!