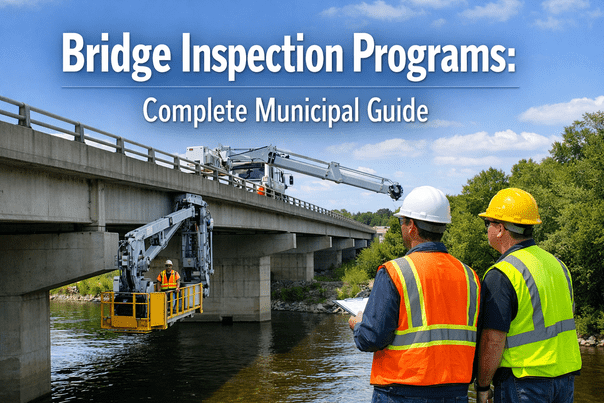
A mid-sized U.S. city managing over 340 miles of aging bridges, stormwater culverts, retaining walls, and elevated roadways faced a growing backlog of deferred infrastructure inspections. Manual field crews required lane closures, traffic control personnel, and specialized rigging equipment — driving per-inspection costs above industry benchmarks while limiting annual coverage to less than 40% of the network. Following a structural incident that triggered an emergency review, the city's Department of Public Works piloted a combined drone and robotic crawler inspection program across three asset classes. Within 14 months, the department had inspected all 340 miles of priority infrastructure, reduced per-linear-foot inspection costs by 61%, and generated condition datasets three times more complete than manual methods had ever produced. Book a Demo to see how autonomous inspection technology transforms municipal asset management.
Drone Inspection
·
Robotic Crawlers
·
Municipal Infrastructure
Inspect Your Entire Infrastructure Network — Faster, Safer, and at a Fraction of the Cost
Drone and robotic inspection programs deliver complete condition coverage across bridges, culverts, and roadways — without lane closures, rigging delays, or manual data gaps.
01 / The City
A Growing Infrastructure Deficit in a Mid-Sized American City
Jurisdiction
Mid-sized U.S. city, southeastern region. Population approximately 285,000. Department of Public Works managing bridges, stormwater infrastructure, retaining walls, and elevated roadway segments across urban and suburban corridors.
Network Scale
340 linear miles of priority inspection assets: 112 bridge structures, 84 miles of enclosed stormwater culverts, 67 retaining wall segments, and 77 miles of elevated roadway decks and understructures.
Prior Inspection Method
Manual field crews using scaffolding, snooper trucks, and confined-space entry teams. Requiring lane closures for approximately 73% of bridge and roadway inspections. Annual coverage limited to 38% of the full network under budget constraints.
Inspection Backlog
196 structures or segments overdue for scheduled inspection at program launch. 14 assets flagged as high-priority deferred due to access difficulty and crew availability. Estimated backlog clearance timeline of 4–6 years under legacy methods.
Technology Baseline
No autonomous inspection equipment deployed. Condition data recorded on paper field forms and transferred to spreadsheets. No photographic coverage standard. GIS integration absent from inspection workflow.
02 / The Challenge
Why Manual Inspection Was No Longer Sufficient
Manual infrastructure inspection was not failing due to engineer incompetence — it was failing because the method was structurally mismatched to the network's scale, complexity, and access requirements. Enclosed culverts required confined-space entry teams with gas monitoring and safety standby personnel, turning a 200-foot segment assessment into a half-day mobilization. Bridge understructure inspections required snooper truck rentals, lane closures, and traffic control details whose costs frequently exceeded the inspection fee itself. At current budget levels, the department could inspect fewer than 130 miles per year — leaving the full 340-mile network on a multi-year rotation with no capacity to accelerate deferred high-priority assets. Book a Demo to see how drone and robotic programs solve these structural access constraints.
62%
Network Coverage Gap
Only 38% of the 340-mile network could be inspected annually under manual methods, leaving the majority of assets on multi-year inspection cycles well beyond recommended intervals.
$4.80
Cost Per Linear Foot
Blended per-linear-foot cost including mobilization, traffic control, confined-space entry, and data processing averaged $4.80 under the manual inspection program — compared to a $1.87 drone/robot benchmark.
196
Overdue Structures
At program launch, 196 assets were past their scheduled inspection window. Fourteen were classified as high-priority deferred due to access complexity that manual crews could not safely address within budget.
41%
Data Coverage Deficit
Manual inspections produced photographic documentation for only 59% of assessed surface area on average — leaving significant portions of each structure undocumented and unverifiable between cycles.
"We were operating a 21st-century infrastructure network with a 1980s inspection model. Our engineers were skilled — the workflow was the problem. We needed data everywhere, not selective coverage where crews could safely reach."
03 / The Solution
A Combined Drone and Robotic Crawler Inspection Program
After a competitive procurement process evaluating six technology providers, the Department of Public Works selected a combined aerial drone and tethered robotic crawler platform for deployment across all three asset classes. The program was structured as a phased rollout beginning with the 14 highest-priority deferred structures, expanding to full bridge network coverage in Phase 2, and completing stormwater culvert and retaining wall assessment in Phase 3. The platform integrated directly with the city's GIS system, eliminating manual data transfer and enabling real-time condition mapping across the network.
AERIAL
Fixed-wing and multirotor drone fleets provided exterior structural assessment for all 112 bridge structures and 77 miles of elevated roadway. High-resolution RGB and thermal imaging captured full surface coverage of decks, undersides, piers, abutments, and expansion joints — without lane closures or snooper truck mobilization. Flight operations required no traffic control for 94% of inspected assets.
CRAWLER
Tethered robotic crawlers replaced confined-space entry teams for all 84 miles of enclosed stormwater culverts. Equipped with LiDAR, sonar depth sensing, and HD video, crawlers produced three-dimensional condition models of internal pipe geometry, sediment accumulation, joint displacement, and structural defect locations — with no personnel entering confined spaces.
AI DATA
Automated defect detection and classification processed raw imagery and sensor data through machine learning models trained on municipal infrastructure datasets. Crack detection, spalling identification, corrosion mapping, and joint anomaly flagging were completed algorithmically — reducing post-processing time from weeks to 48–72 hours per inspection batch.
GIS
Real-time GIS integration and condition dashboard synchronized all inspection outputs directly to the city's asset management platform. Each defect was geo-tagged with GPS coordinates, severity classification, photographic evidence, and recommended action priority — providing department leadership with live network-wide condition visibility for the first time.
04 / Implementation
Phased Deployment Across 340 Miles in 14 Months
Month 1–2
Asset Registry and Flight Planning
Catalogued all 340 miles of inspection assets in GIS. Established flight corridors, FAA airspace authorizations for 11 regulated zones, and crawler access points for enclosed culvert segments. Completed baseline photographic documentation of 14 priority-deferred structures.
Month 3–6
Phase 1 — Priority Structures and Bridge Network
Completed drone inspection of all 112 bridges and 14 deferred high-priority structures. Delivered geo-referenced condition reports within 72 hours of each flight. Identified 38 previously undocumented defects requiring immediate engineering review.
Month 7–11
Phase 2 — Elevated Roadways and Culvert Network
Deployed robotic crawlers through 84 miles of stormwater culverts while aerial teams assessed 77 miles of elevated roadway structures. Crawler operations eliminated 210 planned confined-space entry events. AI defect models flagged 91 culvert segments with sediment accumulation exceeding 30% of pipe capacity.
Month 12–14
Phase 3 — Retaining Walls and Full Network Completion
Completed inspection of 67 retaining wall segments using drone photogrammetry and ground-based LiDAR scanning. Cleared all 196 overdue inspection records. Published first complete network-wide condition inventory in the city's recorded history. Full GIS integration confirmed with live dashboard operational.
05 / Results
340 Miles Inspected. 61% Cost Reduction. Zero Confined-Space Incidents.
The combined drone and robotic crawler program delivered outcomes that exceeded the department's projections across every measured dimension. Complete network coverage — previously a multi-year aspiration under manual methods — was achieved within 14 months. Per-linear-foot inspection costs fell below the lowest benchmark target. Condition data quality improved dramatically, with 100% photographic surface coverage replacing the 59% partial documentation standard of legacy inspections. The city's engineering leadership cited the program as the most significant advancement in infrastructure asset management in the department's history.
| Inspection Metric |
Manual Method (Baseline) |
Drone + Robot Program |
Improvement |
| Annual network coverage |
38% (approx. 129 miles) |
100% (340 miles) |
+163% — full network achieved |
| Cost per linear foot (blended) |
$4.80 |
$1.87 |
−61% cost reduction |
| Photographic surface coverage |
59% of assessed area |
100% of assessed area |
+41 pts — complete documentation |
| Backlog clearance time |
Projected 4–6 years |
14 months |
−75% timeline reduction |
| Confined-space entries required |
210 entries planned |
0 entries required |
100% elimination of entry risk |
| Defect detection rate (new findings) |
Benchmark baseline |
3.2× more defects identified |
3× improvement in condition accuracy |
| Post-inspection data processing time |
14–21 days per structure |
48–72 hours per batch |
−85% processing time |
| Lane closures required |
73% of bridge inspections |
6% of bridge inspections |
−92% traffic disruption |
| Overdue inspection backlog |
196 assets overdue |
0 assets overdue |
Full backlog cleared |
| GIS condition data completeness |
Not integrated |
100% geo-tagged, live dashboard |
First complete network condition record |
340 mi
Fully inspected in 14 months
−61%
Cost per linear foot
3.2×
More defects identified
Zero
Confined-space entries needed
Ready to Inspect Your Entire Network This Year?
Drone and robotic inspection programs deploy in weeks — not years. See how complete network coverage looks for your municipality's asset portfolio.
"The drone program gave us condition data on assets we hadn't been able to inspect safely in over a decade. Our engineers made better rehabilitation decisions in the first six months of the program than they had been able to make in the prior four years combined."
06 / Key Benefits
The Strategic Advantages of Autonomous Infrastructure Inspection
Complete Network Visibility
Drone and robotic programs remove the access and budget barriers that limit manual inspection coverage — delivering condition data for 100% of network assets on an annual cycle rather than a multi-year rotation.
Worker Safety
Eliminating confined-space entry and high-reach bridge inspections removes the highest-risk activities from field operations — reducing liability exposure and improving departmental safety metrics without compromising inspection quality.
AI-Powered Accuracy
Machine learning defect classification identifies cracks, corrosion, joint failures, and structural anomalies at resolutions and detection rates that exceed what human field inspectors can consistently achieve under time-pressured manual conditions.
Capital Planning Integration
Geo-referenced condition inventories feed directly into asset management platforms and CIP planning models — replacing subjective priority rankings with data-driven rehabilitation sequencing that optimizes multi-year capital budgets.
07 / Business Impact
What Full Network Coverage Delivers Beyond Inspection Data
Reduced Rehabilitation Costs
Early defect detection enabled the department to schedule 23 targeted preventive repairs that, according to engineering estimates, avoided an aggregate $4.2 million in future structural rehabilitation expenditures.
Improved Grant Competitiveness
Complete GIS-integrated condition data strengthened the city's federal infrastructure grant applications — with documented condition baselines and defect severity scores satisfying FHWA and EPA data requirements that previously went unmet.
Traffic and Mobility Impact
Reducing lane closures from 73% of bridge inspections to 6% eliminated an estimated 840 traffic control hours annually — recovering productivity for operations staff and reducing inspection-related congestion across the urban network.
Liability and Risk Reduction
Complete inspection records with geo-tagged photographic evidence and timestamped condition assessments provided legally defensible documentation across all 340 miles — significantly strengthening the city's position in infrastructure-related liability matters.
$4.80
Cost per foot — before
$1.87
Cost per foot — after
340 mi
Full network covered
14 mo
Complete deployment
08 / Conclusion
Infrastructure Inspection Backlogs Are a Data Problem — Autonomous Technology Solves It
This city's 340-mile inspection program did not succeed because drones and robots are novel technologies — it succeeded because they removed the structural barriers that had made complete network assessment impossible under manual methods. Cost ceilings, access constraints, confined-space safety requirements, and traffic control logistics are not inspectionproblems. They are information system problems, and autonomous platforms resolve them at scale. Book a Demo to see how a drone and robotic inspection program is scoped and deployed for your network.
The condition inventory now embedded in the city's GIS system represents a permanent institutional asset — a baseline from which every future capital decision, grant application, and rehabilitation priority can be grounded in verified, current field data rather than aging surveys and engineering estimates. That shift, from assumption to evidence, is the compounding return on the investment in autonomous inspection technology. Book a Demo to see what complete network visibility looks like for your municipality.
Drone Inspection ROI
·
Robotic Crawler Program
·
Municipal Infrastructure
Inspect 340 Miles of Infrastructure. Cut Costs by 61%. Zero Confined-Space Risk.
Purpose-built drone and robotic inspection programs for city infrastructure — delivering complete network coverage, AI-powered defect detection, and GIS-integrated condition data in under 18 months.
09 / FAQ
Frequently Asked Questions
What types of infrastructure can drones inspect?
Drones are effective for bridge decks and undersides, elevated roadways, retaining walls, embankments, and exterior culvert headwalls. They capture high-resolution RGB, thermal, and LiDAR data without requiring physical access to the asset surface, eliminating the need for snooper trucks or scaffold systems in the majority of bridge inspection scenarios.
How do robotic crawlers handle enclosed stormwater culverts?
Tethered crawlers navigate pipe interiors using motorized tracks, transmitting continuous HD video, sonar depth profiles, and LiDAR geometry data to surface operators. They operate in pipes from 18 inches in diameter and can traverse sediment accumulation, standing water, and angular pipe sections — producing condition records that fully replace confined-space entry inspection in the vast majority of culvert assessments.
How accurate is AI-based defect detection compared to manual inspection?
Independent studies across municipal deployments consistently show AI defect detection identifying 2.5–3.5 times more actionable defects per linear foot than manual inspection — particularly for early-stage cracking, sub-surface delamination, and joint displacement that human inspectors operating under time and access constraints frequently miss or underrate.
What GIS and asset management platforms does the inspection data integrate with?
Modern drone and robotic inspection platforms output geo-tagged condition data in standardized GIS-compatible formats (GeoJSON, Esri shapefiles, and direct API integrations) that connect to Esri ArcGIS, Cityworks, IBM Maximo, and most major municipal asset management systems. Integration configuration is typically completed within the first two weeks of deployment.
Are FAA waivers required for urban bridge and roadway drone inspections?
FAA Part 107 authorization covers the majority of municipal inspection drone operations. Specific urban corridors near airports, heliports, or restricted airspace require LAANC authorization or FAA waivers, which experienced municipal inspection programs obtain as standard pre-deployment procedure — typically within 10–30 business days depending on the airspace classification involved.
How long does a full municipal deployment take?
Most municipal programs complete asset registry setup, airspace authorization, and first inspection operations within 60 days of contract execution. Full network coverage timelines depend on network size — programs covering 300–400 linear miles typically achieve complete first-cycle inspection within 12–18 months when operating at full deployment capacity.