Education facilities management is undergoing its most significant operational shift in decades. AI-driven predictive maintenance, automated compliance documentation, and centralized analytics platforms are no longer pilot programs — they are the operational baseline at institutions that are managing aging infrastructure, compliance pressure, and workforce shortages without budget increases. Campus leaders who understand what is changing in 2026 and what it costs to ignore it will make fundamentally different decisions than those who do not. See how 2026 FM trends apply to your campus — Book a Demo.
Why 2026 Is a Turning Point for Education FM
Three compounding pressures have made the status quo operationally unsustainable for most campus facilities teams in 2026. Technician vacancy rates at large campuses exceed 18%, deferred maintenance backlogs across U.S. higher education now exceed $112 billion, and 2026 regulatory updates — OSHA Heat Illness Prevention, expanded EPA testing mandates, and tightened accreditor documentation standards — require continuous compliance records that manual systems structurally cannot produce.
The institutions managing these pressures most effectively are not the ones that have resolved the underlying constraints. They are the ones that have deployed automation to ensure that available staff, budgets, and data are directed at highest-priority work rather than administrative overhead that software can eliminate. Map 2026 FM pressures to your institution's current operational gaps — Book a Demo.
The Top 6 Education FM Trends Defining 2026
Each trend below is already underway at leading institutions. Together they define the operational gap between campuses that are managing 2026 conditions effectively and those accumulating compounding liability.
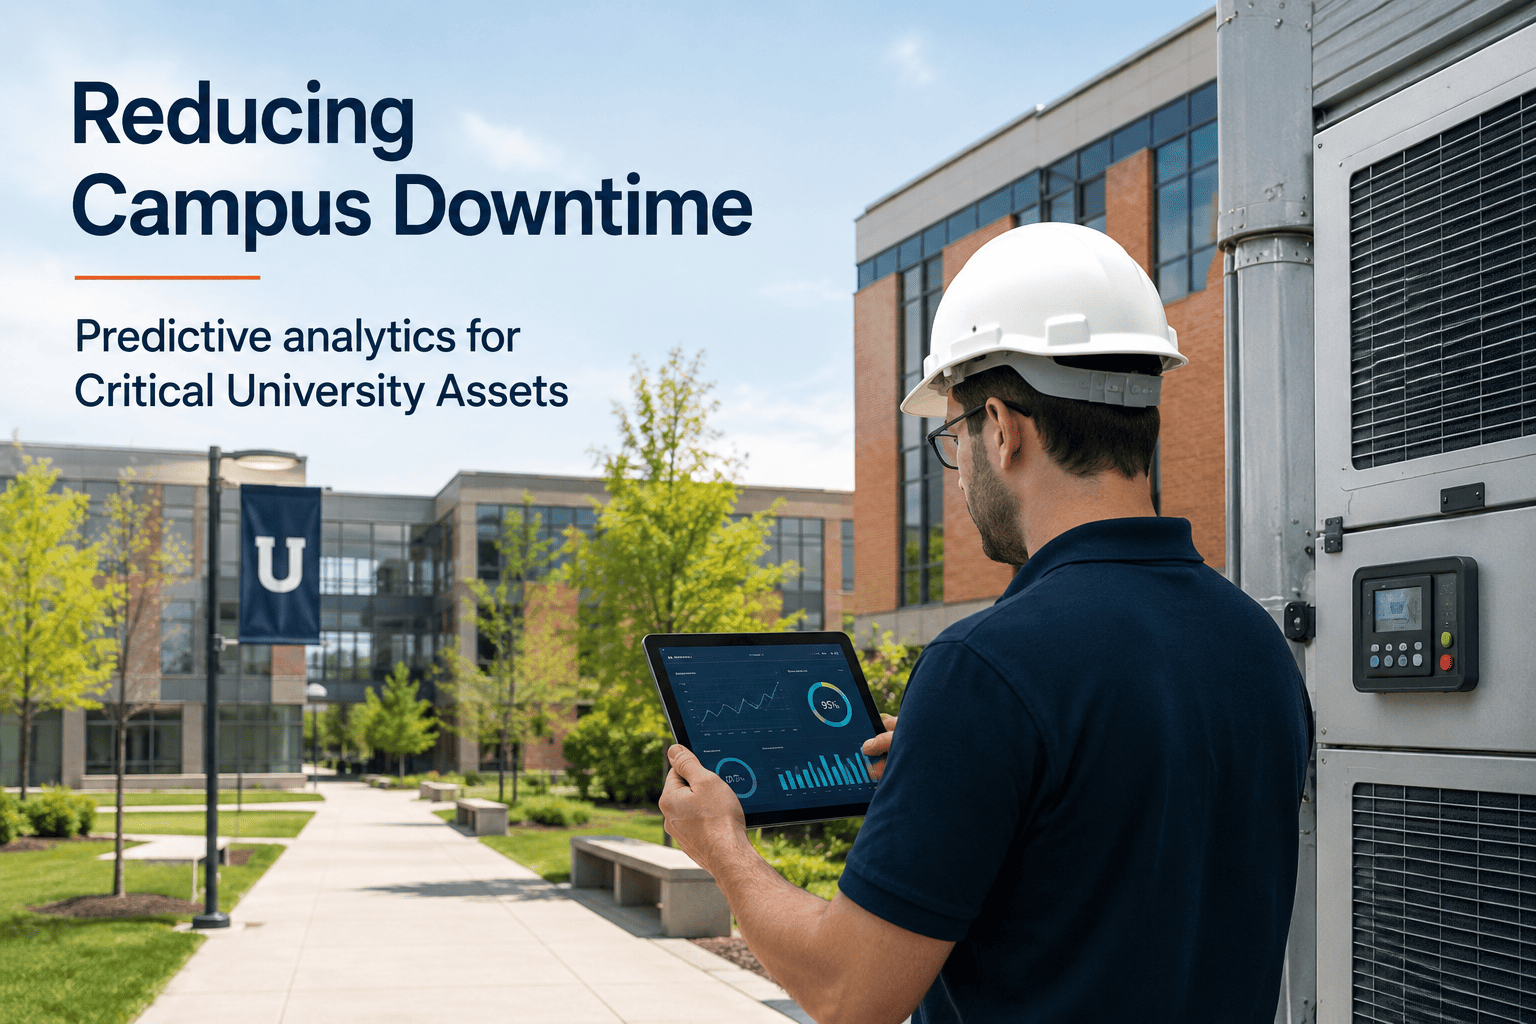
The dominant shift in 2026 is the movement from complaint-driven maintenance to AI-driven condition monitoring that generates work orders before failure occurs. Institutions document 60-75% reductions in emergency work orders and 18-30% lower maintenance costs within 18 months. The 3-5x cost premium of emergency repairs over planned work makes this the single highest-ROI operational change available to facilities leadership.
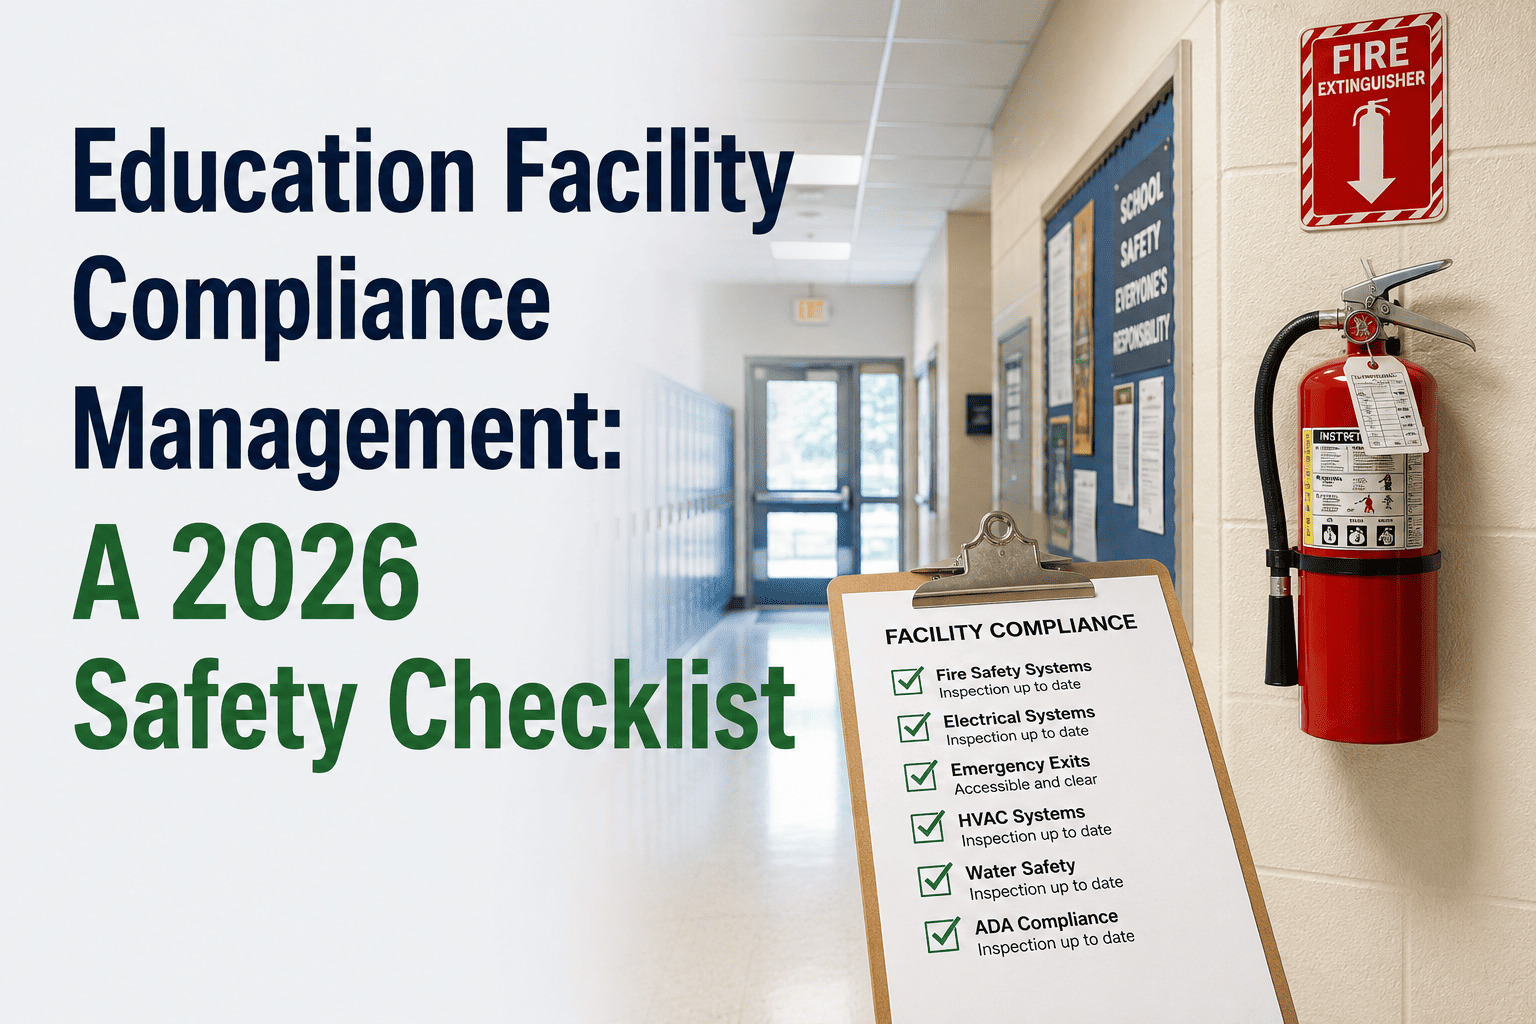
OSHA 2026, EPA, NFPA, and accreditation documentation generated manually consumes 140 staff hours per quarterly cycle. The same records produced automatically from live maintenance and IoT data take 18 hours. Institutions deploying compliance automation document zero deficiencies across all regulatory frameworks simultaneously — a result not achievable through manual documentation improvement at any staffing level.
Traditional 3-5 year facility condition assessments produce data that is obsolete before capital decisions are made. Continuous IoT condition scoring keeps FCI current within 30 days, reducing capital project cost variance from 22% to 6% average. Board capital requests backed by live condition data achieve single-session approval rather than deferrals for additional evidence — compressing the capital cycle by 6-18 months.
Most campuses waste 30-40% of their energy budget conditioning empty spaces and operating degraded HVAC on fixed schedules. Without per-building monitoring, teams manage utility costs at aggregate and cannot isolate which buildings are consuming 30-40% above baseline. AI energy platforms document 15-19% campus-wide cost reductions by resolving these invisible inefficiencies building by building from continuous monitoring data.
With technician vacancy rates exceeding 18% at large campuses, automation has become the operational bridge that keeps facilities functioning. Automated work order routing, AI scheduling, and digital compliance documentation reclaim 12-80 staff hours per role per month — directing every available skilled hour toward physical field work that only humans can perform rather than administrative coordination that software handles entirely.
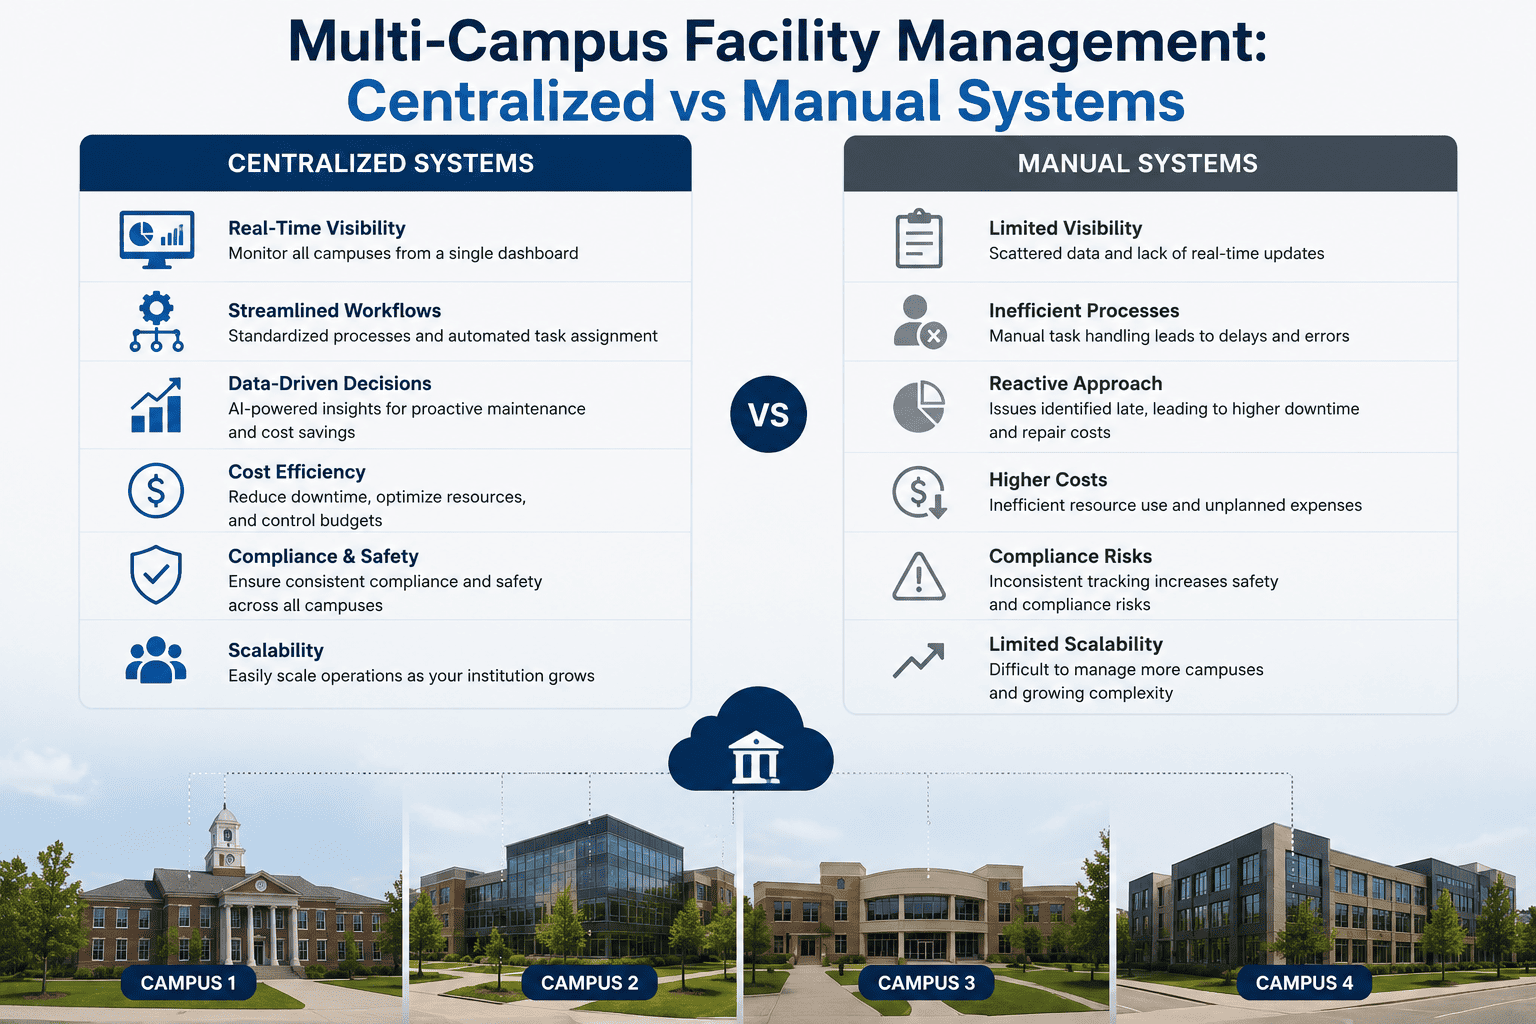
The most operationally advanced campuses in 2026 have unified maintenance, energy, compliance, space utilization, and capital data into a single AI analytics layer with role-based dashboards for every stakeholder. Decisions made from correlated evidence across domains produce outcomes that no single-system tool can replicate. Capital requests, compliance submissions, and energy programs all strengthen when built from the same unified data foundation.
Documented Outcomes Across 2026 Education FM Deployments
Results from K-12 and university deployments measured against pre-deployment baselines on existing operational budgets. No additional headcount added. Model these outcomes against your institution's current baseline — Book a Demo.
| FM Performance Metric | 2026 Manual Baseline | With AI Platform | Change |
|---|---|---|---|
| Emergency Work Orders | 60-75% of maintenance budget | 60-75% fewer events | -60% to -75% |
| Maintenance Cost per Sq Ft | $4.85 reactive average | $3.40-$3.99 | -18% to -30% |
| Compliance Reporting Hours | 140 hrs per cycle | 18 hrs automated | -87% |
| Audit Deficiencies | Multiple per cycle | Zero documented | -100% |
| Energy Operating Costs | No per-building visibility | 15-19% reduction | -15% to -19% |
| Asset Condition Data Age | 18-26 months average | Under 30 days | -98% |
| Capital Project Cost Variance | 22% average overage | 6% average | -73% |
| Planned-to-Reactive Ratio | 25% planned / 75% reactive | 75% planned / 25% reactive | 3x improvement |