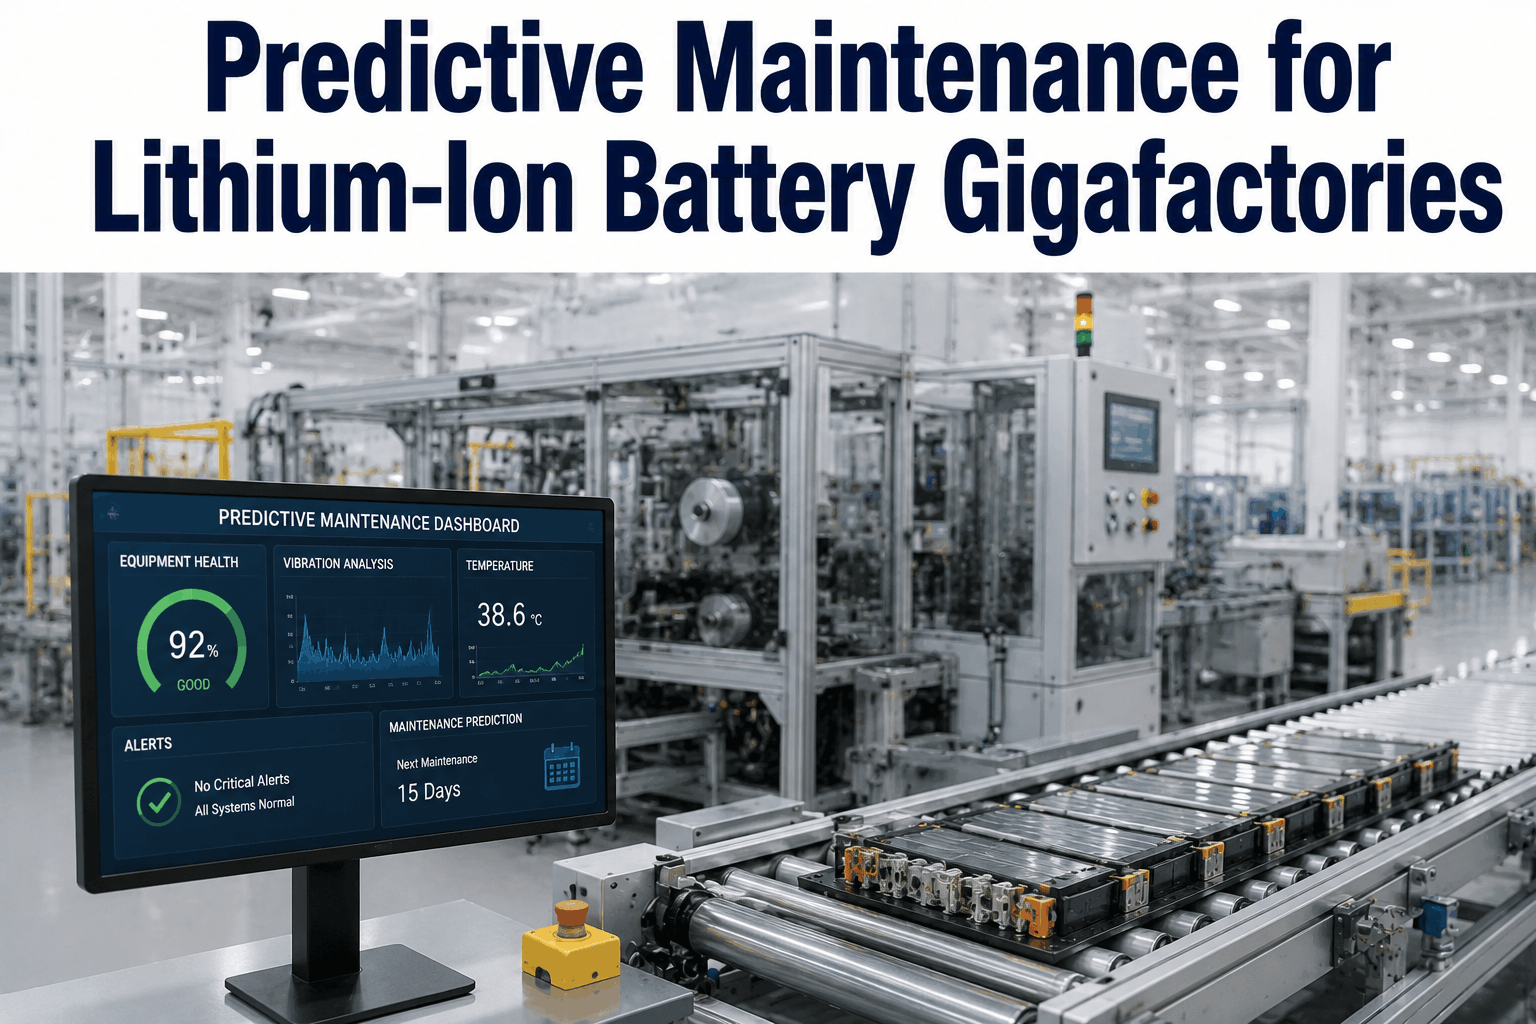
Battery gigafactories run 24 hours a day, 7 days a week, with production targets measured in gigawatt-hours and downtime costs measured in millions per shift. A single coating line failure can scrap an entire electrode batch. A calendering unit running out of tolerance produces cells that fail formation weeks later. The margin for unplanned stops is zero — and traditional time-based maintenance schedules built for factories with planned downtime windows simply do not map onto gigafactory operational reality. Get iFactory Support to deploy AI predictive maintenance across your gigafactory production lines today.
Protect Billion-Dollar Gigafactory Production Targets with AI Predictive Maintenance
iFactory AI monitors coating, calendering, stacking, and formation equipment continuously — detecting degradation signatures weeks before failures stop your lines and scrap your product.
The Six Critical Gigafactory Equipment Systems AI Monitors
Battery cell manufacturing follows a linear process sequence where each stage's output quality depends on the stage before it. Equipment degradation that affects process precision — coating weight uniformity, calendering gap consistency, electrolyte fill accuracy — creates defects that either scrap cells at end-of-line testing or, worse, reach the customer as latent field failures. AI monitoring at each stage prevents both outcomes. Contact iFactory to map your specific cell chemistry and process configuration to the monitoring model.
Stage 1
Electrode Coating Lines
Slot-die coating systems apply cathode and anode slurry to current collector foil at speeds of 50–100m/min. AI monitors die gap uniformity, slurry viscosity trends from pump motor current, drying oven temperature profiles, and web tension — detecting coating weight drift before it crosses the specification limit that triggers batch scrap.
Stage 2
Calendering Units
Calendar rolls compress dried electrode coatings to target porosity and thickness. Roll gap, line load, and surface temperature must remain within ±1µm tolerances across the full roll width. AI monitors hydraulic system pressure stability, roll bearing vibration signatures, thermal profiles across roll width, and gap actuator response time — the four primary indicators of roll degradation and alignment drift.
Stage 3
Slitting and Cutting Systems
Precision slitting of calendered electrode web to final width tolerances of ±0.1mm uses tungsten carbide circular blades that dull gradually. AI tracks cutting force signatures from motor current data — detecting blade wear that produces burrs or width variation before the defect rate exceeds the scrap threshold. Blade life prediction from wear curves reduces emergency blade changes by 60–80%.
Stage 4
Stacking and Winding Equipment
Z-fold stacking and winding machines align separator and electrode layers with sub-millimeter precision at rates of hundreds of cells per hour. Servo motor health, vision system calibration drift, vacuum suction cup degradation, and mechanical alignment are the primary failure modes AI monitors — each capable of producing misaligned cells that fail safety testing downstream.
Stage 5
Electrolyte Filling and Sealing
Electrolyte dosing systems fill cells to gravimetric tolerances of ±0.1g in a controlled dry-room environment. AI monitors pump mechanism wear from cycle count and fill time statistics, seal integrity from pressure decay tests, and dry-room dew point — which directly affects electrolyte moisture uptake and cell lifetime if the sealing environment is compromised.
Stage 6
Formation and Aging Chambers
Formation cycling equipment charges and discharges every new cell through precise current and voltage profiles to establish the solid electrolyte interphase. AI monitors channel-level current source accuracy, temperature uniformity across formation racks, busbar connection resistance, and cooling system performance — channel failures in formation are invisible without continuous electrical monitoring.
Gigafactory Equipment Failure Modes and Their Production Cost
Unlike conventional manufacturing where a single machine failure affects one production stream, gigafactory failures have cascading quality and scrap implications that extend far beyond the immediate equipment downtime window. The table below maps critical failure modes to their production cost impact. Book a demo to see how iFactory quantifies avoided failure cost across your specific production configuration.
Scroll for more →
| Equipment | Primary Failure Mode | Production Impact | iFactory Detection Method |
|---|---|---|---|
| Slot-Die Coater | Die lip clogging / slurry viscosity drift | Full electrode roll scrap, 2–4hr line stop | Motor current + inline basis weight sensor fusion |
| Calendering Unit | Roll bearing spalling / gap actuator wear | Electrode porosity out-of-spec, downstream scrap cascade | Vibration envelope + hydraulic pressure trend |
| Slitter | Blade dulling / burr generation | Width variation, separator damage, safety test failure | Cutting force signature from spindle motor current |
| Stacker / Winder | Servo motor degradation / alignment drift | Misaligned cells, 100% inspection rejection | Servo torque ripple + vision system confidence metrics |
| Formation Chamber | Channel current source failure / cooling degradation | Partial batch loss, cell quality deviation, rework | Channel-level electrical accuracy + thermal mapping |
| Dry-Room HVAC | Desiccant wheel degradation / dew point exceedance | Moisture contamination of electrolyte, entire shift scrap | Continuous dew point monitoring with trend alerting |
AI Performance Metrics: Gigafactory Monitoring Outcomes
Unplanned Downtime Reduction
62–78% Reduction
Gigafactories deploying iFactory AI across coating, calendering, and formation equipment achieve 62–78% reduction in unplanned line stoppages. The majority of reduction comes from early detection of bearing, actuator, and thermal degradation that previously presented as sudden stops with no warning.
Electrode Scrap Rate Reduction
35–50% Fewer Scrap Events
Early detection of coating weight drift and calendering gap variation prevents the equipment from operating out of tolerance long enough to produce entire roll quantities of off-spec electrode. Catching drift at 2-sigma deviation rather than 3-sigma prevents batch scrap events that occur when processes are allowed to run until product quality triggers the stop.
Mean Time Between Failures (MTBF)
2.1× MTBF Improvement
Condition-based intervention before fault progression reaches critical severity extends component life — bearings replaced at 70% life remaining last longer in service than bearings run to failure. Across a full gigafactory equipment population, AI-managed maintenance consistently achieves 2× or greater MTBF improvement within 18 months of deployment.
Formation Chamber OEE
+8–14 OEE Points
Formation and aging chambers represent the largest capital block in most gigafactory configurations. AI channel-level monitoring identifies under-performing or failed channels before they cause batch rejects — keeping effective formation capacity utilization at maximum and reducing the percentage of capacity consumed by rework cycles.
The Gigafactory AI Monitoring Architecture
Process Data Integration Layer Foundation
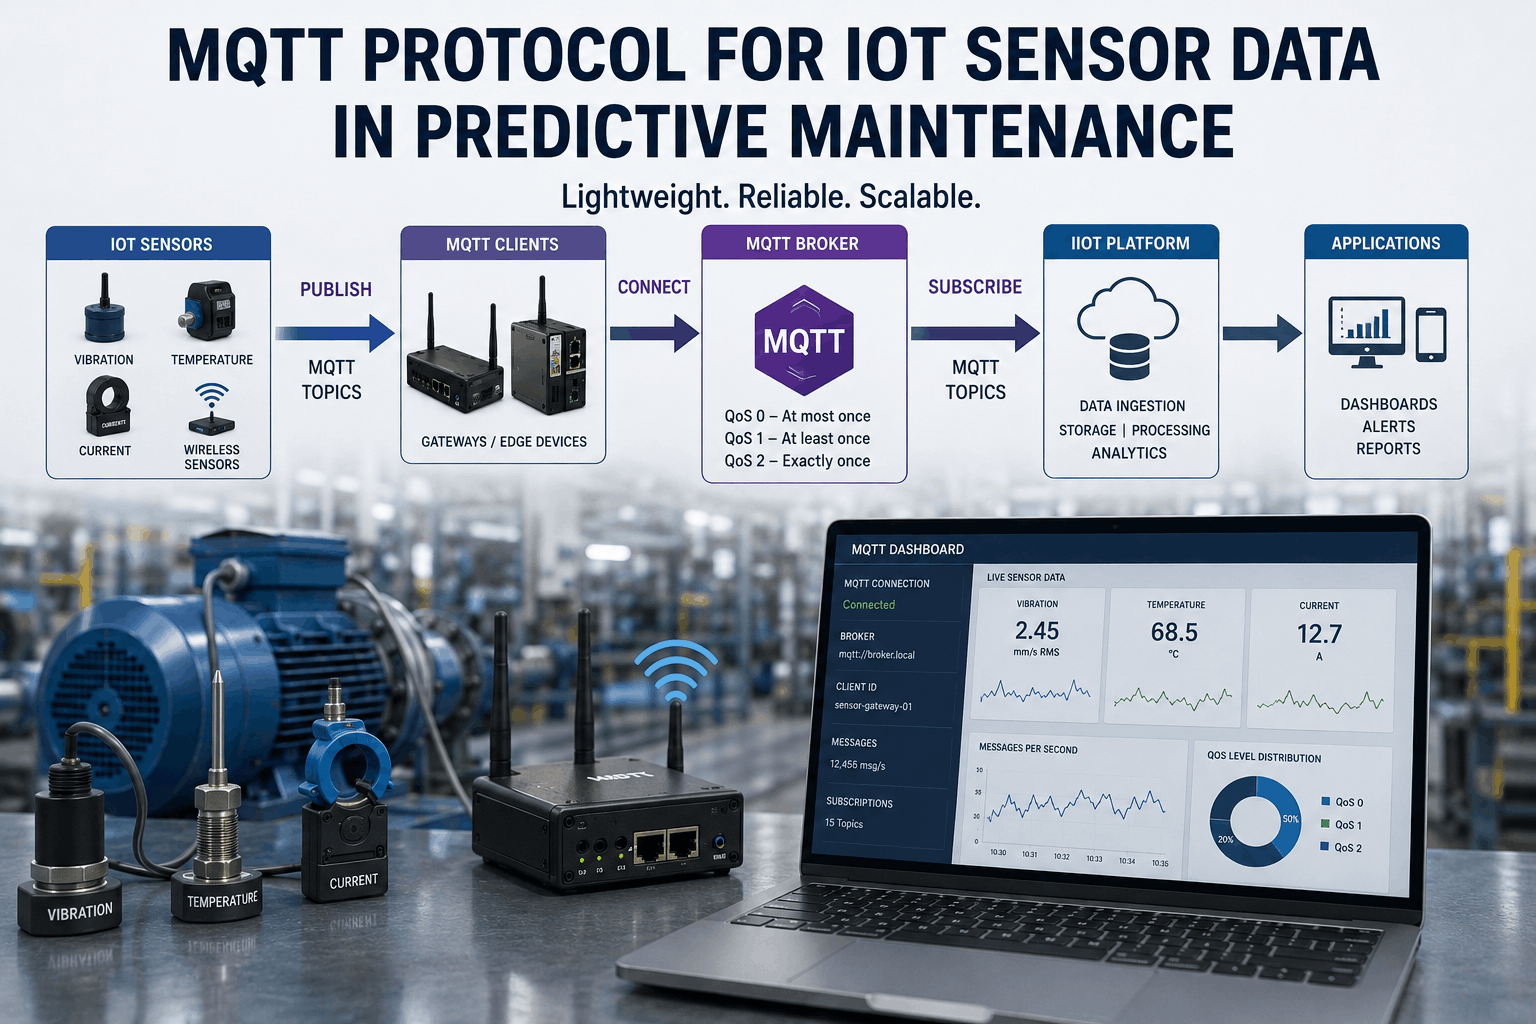
Gigafactory equipment generates process data from MES, SCADA, PLC controllers, and inline quality sensors at rates of millions of data points per hour. iFactory's integration layer connects to OPC-UA, MQTT, and REST API endpoints across all equipment systems — normalizing heterogeneous data streams from different equipment vendors into a unified asset health data model without custom engineering for each machine type.
Product Quality — Equipment Health Correlation
The diagnostic power unique to gigafactory AI is correlating downstream quality outcomes (cell capacity, internal resistance, formation efficiency) with upstream equipment condition trends. When cells from a specific coating shift show elevated internal resistance at end-of-line, AI traces back to the coating weight data from that shift and identifies the die gap drift event that produced the correlation — closing the loop between equipment health and product quality.
Dry-Room and Utility System Monitoring
The controlled environments that house gigafactory process equipment — dry rooms maintaining dew points below −40°C, cleanroom HVAC systems, chilled water and compressed dry air utilities — are themselves critical assets whose failure produces immediate product quality consequences. iFactory monitors utility systems with the same AI models applied to process equipment, triggering escalated alerts when utility performance approaches the threshold that would affect cell production quality.
Planned Maintenance Window Optimization
With no scheduled downtime windows in 24/7 gigafactory operations, every maintenance intervention must be planned into brief transition periods between production campaigns. iFactory's maintenance scheduling AI ranks pending interventions by urgency and remaining useful life, identifying the optimal intervention window that minimizes production impact while ensuring no component reaches critical failure before the next planned access opportunity.
New Line Commissioning Acceleration
Gigafactory capacity expansions add new production lines every 6–18 months. iFactory's AI accelerates commissioning by establishing equipment health baselines during the ramp phase and immediately flagging components that are degrading faster than expected from commissioning loads — catching infant mortality failures before they disrupt ramp-up schedules and delay production capacity achievement milestones.
Regulatory and Quality Traceability
EV battery quality standards and automotive OEM customer requirements increasingly mandate equipment condition traceability for cells supplied into vehicle programs. iFactory maintains a complete time-stamped equipment health record for every production shift — enabling traceability from individual cells back to equipment operating state during their manufacture. Contact iFactory Support to configure traceability reporting for your OEM customer requirements.
Gigafactory Monitoring Infrastructure
Edge AI Processing
On-premises edge servers process sensor data locally — ensuring zero latency for critical alerts and compliance with air-gapped network security requirements common in gigafactory IT architectures
MES/SCADA Integration
Bidirectional integration with existing MES and SCADA systems — consuming process data and returning condition alerts and work order triggers without replacing existing control infrastructure
Multi-Site Deployment
Unified AI model management across multiple gigafactory sites — centralizing model updates, alert configuration, and performance benchmarking from a single management console
OEE and Loss Analytics
Automatic availability, performance, and quality loss categorization mapped to equipment health events — closing the loop between maintenance actions and OEE impact measurement
Gigafactory AI Deployment: 6-Phase Rollout
01
Critical Equipment Mapping
Identify the 20% of equipment responsible for 80% of unplanned downtime and quality scrap events. In most gigafactories, coating lines, calendering units, and formation chambers account for the majority of production-impacting failures — these form the Phase 1 monitoring scope.
02
Data Connectivity Assessment
Audit available data streams from each equipment system: PLC tags, drive parameters, inline quality sensor outputs, and utility monitoring signals. Identify gaps requiring additional sensors versus data that exists but is not currently being used for predictive analytics — most gigafactories have 60–80% of required data already available.
03
Pilot Line Deployment
Deploy iFactory on a single production line covering all process stages. Run the pilot for 60–90 days alongside current maintenance practices — capturing baseline failure events and validating AI alert accuracy before scaling. Pilot ROI calculation from the first detected failure typically exceeds deployment cost.
04
Quality Correlation Enablement
Connect end-of-line cell test data and formation curve analytics to equipment health timelines. This step unlocks the highest-value capability — understanding which equipment events produce which quality outcomes — and typically requires 30–60 days of concurrent data collection to build statistically significant correlations.
05
Full Factory Expansion
Scale monitoring to all production lines and utility systems using the model configurations validated during the pilot. iFactory's deployment framework replicates pilot configurations to new lines automatically — reducing per-line deployment time from weeks to days for subsequent rollout phases.
06
Continuous Model Improvement
AI models improve as the failure event library for each equipment type grows. iFactory's model improvement cycle incorporates confirmed failure events and near-miss data from each site into updated detection models deployed across the fleet. Contact iFactory Support to join the gigafactory model improvement program.
Frequently Asked Questions
How does AI predictive maintenance work in a 24/7 gigafactory with no scheduled downtime?
AI changes the maintenance paradigm from schedule-driven to condition-driven. Instead of waiting for a fixed PM interval, iFactory continuously monitors equipment health and predicts the time-to-failure for each component. Maintenance teams then plan interventions in the brief transition periods between production campaigns or during scheduled micro-stops — acting on AI-generated urgency rankings rather than calendar triggers.
Can iFactory detect coating weight drift before it causes electrode scrap?
Yes. Coating weight drift is detectable from multiple upstream process signals before it reaches the in-specification limit that triggers batch hold. Slot-die pump motor current variations, die pressure changes, and slurry feed system anomalies all precede coating weight deviation by 15–45 minutes at typical line speeds — providing intervention time before scrap accumulates to a full electrode roll quantity.
How does iFactory handle the heterogeneous equipment base in a gigafactory — multiple OEMs, generations of equipment?
iFactory's integration layer supports OPC-UA, MQTT, Modbus, and REST API protocols — covering the data interfaces of virtually every gigafactory equipment supplier. Equipment from different OEMs is normalized into iFactory's unified asset health data model, allowing the same AI analytics framework to apply across a mixed equipment base without requiring custom integration for each equipment type.
Can AI monitoring help with automotive OEM traceability requirements for battery cells?
Yes. Automotive OEM quality agreements increasingly require battery cell suppliers to maintain equipment condition records traceable to individual cell production. iFactory maintains time-stamped equipment health records for every production shift with configurable retention periods, and generates traceability reports in formats compatible with IATF 16949 quality management requirements.
What is the typical ROI timeline for gigafactory AI predictive maintenance deployment?
Gigafactory deployments typically achieve positive ROI within 4–8 months from the first coating line or formation chamber failure detected and avoided. A single prevented coating line failure that would have scrapped a full electrode roll shift typically represents $50,000–$200,000 in avoided scrap cost depending on cell chemistry and throughput rate — often exceeding the deployment cost of monitoring that entire production stage.
Your Gigafactory Production Targets Require Predictive Intelligence at Every Stage
iFactory AI monitors coating lines, calendering units, stacking machines, and formation chambers continuously — giving your maintenance team the lead time to act before equipment failures scrap product or stop your lines.