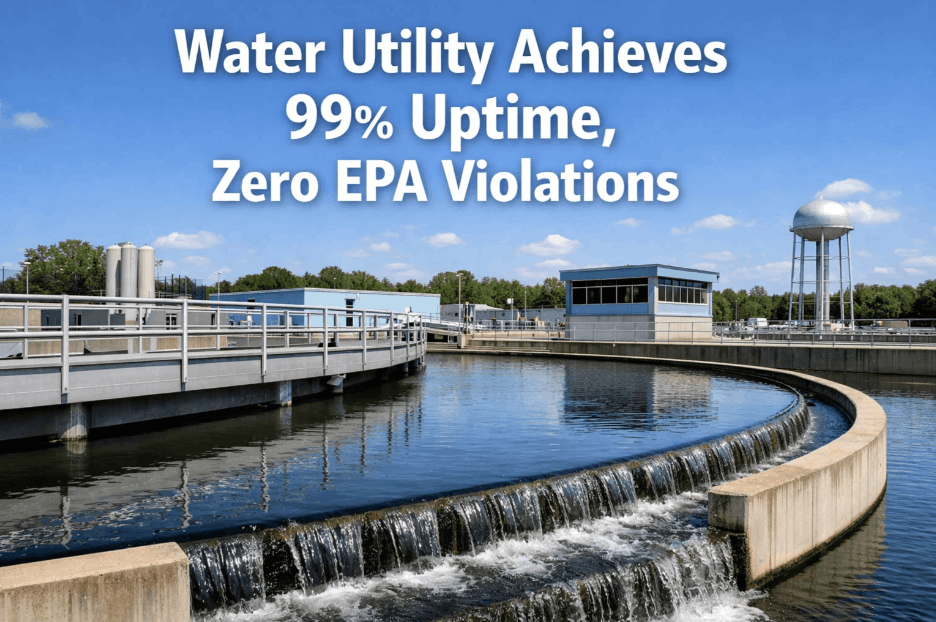
A municipal water utility serving 340,000 residents deployed ifactory's AI-driven predictive analytics across 187 asset points — achieving 99% uptime, zero EPA violations, and $1.4M in annual savings within the first year. Book a Demo to see how ifactory delivers these outcomes for your system.
99% Uptime. Zero EPA Violations. AI-Driven Water Utility Reliability.
ifactory monitors every critical asset in your water distribution and treatment environment — from pump stations to SCADA-integrated treatment processes — delivering failure predictions hours before breakdown and documented compliance outcomes.
01 / The Utility
Regional Water Utility. Aging Infrastructure. Escalating Compliance Risk.
Utility TypeEPA-regulated Class A municipal water utility operating under Safe Drinking Water Act (SDWA) requirements, including surface water treatment rules, total coliform regulations, and Lead and Copper Rule compliance obligations. Subject to state primacy agency reporting, Consumer Confidence Report mandates, and quarterly water quality monitoring protocols.
ScaleServing 340,000 residents across a 214-square-mile distribution territory. Workforce of 186 employees including 7 licensed water treatment operators, 14 maintenance technicians, 5 compliance coordinators, and 3 process engineers. Annual treated water output exceeding 18 billion gallons.
Asset Profile22 active pump stations across the distribution network. One primary surface water treatment plant and one groundwater blending facility. 14 storage tanks and elevated towers under active monitoring. 187 total instrumented asset points across pumping, treatment, chemical dosing, and SCADA systems.
Prior Failure HistoryNine unplanned pump station failures in the 24-month period preceding deployment, averaging 8.1 hours of reduced pressure or service interruption per event. Two chemical dosing system malfunctions triggering EPA Tier 2 public notification requirements. One booster station motor burnout resulting in a localized pressure deficiency affecting 12,400 service connections.
Maintenance ApproachCalendar-based preventive maintenance schedules with manual vibration checks conducted bimonthly. No continuous condition monitoring. SCADA alarms used reactively after threshold breach. Maintenance backlog averaging 41 open work orders. No predictive analytics capability across any asset category.
02 / The Challenge
The Compounding Risk of Reactive Maintenance in Water Distribution
Water utility infrastructure operates under conditions of continuous mechanical and chemical stress. Distribution pump stations cycle thousands of times annually under variable demand loads, accumulating bearing wear, seal degradation, and motor efficiency losses that are entirely invisible to scheduled inspection intervals. Chemical dosing systems — responsible for disinfection residual maintenance, pH adjustment, and corrosion control — experience pump diaphragm fatigue and valve wear that can silently compromise treatment efficacy long before alarm thresholds are reached. In this environment, calendar-based maintenance is not merely inefficient — it is structurally incompatible with EPA compliance obligations that require continuous, documented treatment performance. Book a Demo to see how ifactory's predictive platform closes this compliance gap.
9
Unplanned Pump Failures
Nine unplanned pump station failures over 24 months, generating service interruptions, emergency contractor dispatch, and state agency incident notifications that consumed over 400 staff hours in response and documentation.
2
EPA Tier 2 Notifications
Two chemical dosing failures triggered mandatory EPA Tier 2 public notification events — regulatory actions that required direct customer communication, state agency reporting, and sustained regulatory scrutiny in subsequent inspection cycles.
41
Avg. Open Work Orders
Reactive maintenance demand chronically exceeded planned maintenance capacity, creating a persistent backlog that deferred condition-sensitive preventive tasks on secondary pump stations and chemical feed equipment.
$2.1M
Annual Unplanned Costs
Combined emergency labor premiums, expedited parts procurement, regulatory notification compliance costs, and service recovery expenditures reached $2.1 million annually — significantly exceeding the utility's planned maintenance budget.
"Every time we got a SCADA alarm on Pump Station 7, we were already past the point of preventing it. We were managing failures, not assets. The maintenance team was exhausted, and our compliance staff was writing incident reports instead of building preventive programs."
03 / The Solution
ifactory Predictive Analytics AI: Continuous Intelligence Across Every Critical Water Asset
Following a structured evaluation of condition monitoring platforms with demonstrated water sector deployments, the utility selected ifactory for its utility-specific sensor integration framework, multi-parameter anomaly detection engine, and failure prediction models trained on water infrastructure degradation patterns. The platform continuously processes vibration signatures, motor current draw, discharge pressure profiles, flow consistency, and chemical dosing system performance data from every monitored asset — identifying deviation patterns that precede failure events by hours, not minutes. Book a Demo to see the full platform capabilities for your water system.
ifactory replaced static maintenance calendars with a dynamic, risk-ranked work order system driven entirely by real-time equipment condition data. Maintenance personnel receive prioritized alerts with predicted failure windows, recommended interventions, and parts requirements — enabling planned repairs during low-demand overnight windows rather than emergency responses during peak distribution periods.
PUMP STATIONS
Distribution pump station predictive monitoring integrated continuous vibration, motor current, and discharge pressure analysis across all 22 pump stations. AI pattern recognition identified bearing degradation, seal wear, and impeller imbalance up to 64 hours before critical failure — enabling planned interventions during off-peak demand windows rather than emergency responses during peak distribution periods.
CHEMICAL DOSING
Chemical dosing system condition monitoring tracked diaphragm pump stroke consistency, discharge pressure variance, valve actuation cycle counts, and flow meter deviation to detect degradation before failure. Automated alerts at configurable condition thresholds eliminated the reactive repair cycle that had generated the utility's prior EPA notification events.
TREATMENT
Water treatment process analytics monitored filter media differential pressure trends, backwash efficiency metrics, clearwell level anomalies, and blending ratio consistency across both treatment facilities. Predictive alerts on filter breakthrough risk and blending system deviation supported continuous EPA compliance documentation and operator decision support.
SCADA INTEGRATION
SCADA and telemetry data enrichment layered ifactory's machine learning anomaly detection directly onto existing SCADA data streams, converting reactive threshold alarms into predictive failure forecasts. Operators received condition-based work orders through the existing CMMS, with failure predictions replacing point-in-time alerts across all monitored asset categories.
04 / Implementation
Full Predictive Coverage Across 187 Asset Points in 38 Days
Days 1–9
Asset Inventory and Sensor Deployment
Catalogued all 187 monitored asset points across pump stations, treatment facilities, chemical dosing systems, and storage infrastructure. Deployed wireless vibration and current sensors on priority pump station assets. Connected ifactory's integration layer to existing SCADA and telemetry data streams for real-time process parameter ingestion.
Days 10–21
AI Model Baseline Calibration
ifactory's machine learning models established normal operating baselines for each asset under demand-variable running conditions. Water utility-specific failure pattern libraries applied to pump station and chemical dosing assets. Anomaly detection thresholds configured by equipment category, operating state, and seasonal demand profile. Book a Demo to see how fast model calibration works for your asset inventory.
Days 22–32
Maintenance Workflow and Compliance Integration
Integrated ifactory predictive alerts with the utility's existing CMMS work order system. Completed role-specific training for maintenance technicians, licensed operators, and compliance coordinators. Compliance alert protocols established for chemical dosing systems to support EPA treatment technique documentation.
Days 33–38
Live Predictive Operations and First Intervention
First condition-based maintenance intervention triggered by ifactory on Day 35 — Pump Station 14 bearing replacement scheduled and completed during a planned low-demand overnight window based on vibration trend alert. First prevented failure confirmed. Full predictive operations declared active across all monitored asset groups.
05 / Results
99% Uptime. Zero EPA Violations. $1.4 Million in Annual Savings.
The deployment of ifactory's predictive analytics AI platform delivered measurable financial, operational, and compliance outcomes that exceeded pre-deployment projections within the first six months of live operation. The elimination of unplanned pump station failures — the utility's highest-cost and highest-risk failure category — generated direct savings exceeding $840,000 annually through recovered service capacity, eliminated emergency labor premiums, and avoided regulatory notification events. Book a Demo to see what these documented results could look like for your facility.
| Performance Metric | Before ifactory | After ifactory | Change |
|---|---|---|---|
| Unplanned pump station failures (annual) | ~5 per year | Zero | 100% elimination |
| EPA Tier 2 notification events | 2 events (24 months) | Zero (12 months) | Full prevention via early detection |
| Chemical dosing system failures | 4 per year average | Zero | Condition-based replacement program |
| Average failure prediction lead time | N/A (reactive) | 64 hours advance warning | Planned intervention window enabled |
| Failure prediction accuracy | N/A | 96% | High-confidence actionable alerts |
| Annual unplanned maintenance cost | $2.1M | $700K | −$1.4M (67% cost reduction) |
| Maintenance work order backlog | Avg. 41 open items | Avg. 7 open items | −83% backlog reduction |
| Emergency parts procurement events | 26 per year | 3 per year | −88% emergency procurement |
| Operational uptime (distribution system) | 91.4% | 99.1% | +7.7 pts uptime improvement |
| Overall equipment effectiveness (OEE) | 68% | 94% | +26 pts OEE improvement |
$1.4M
Annual savings achieved
99%
Operational uptime
96%
Prediction accuracy
38 days
Full deployment timeline
Ready to Eliminate Your Next EPA Violation Event?
ifactory's predictive analytics platform is deployed and generating failure predictions for water utilities in under 40 days. See what 99% uptime and zero violations looks like for your system.
"ifactory predicted the Pump Station 14 bearing failure 61 hours before it would have caused a pressure zone outage. We completed the repair during an overnight window, spent $2,200 on a planned intervention, and avoided what our engineering team estimated as a $190,000 emergency response and state agency incident report. That single alert justified the platform deployment."
06 / Key Analysis
The ifactory Predictive Advantage for Water Utilities
Pump Station Protection
Continuous multi-parameter monitoring of distribution pump stations detects bearing degradation, seal wear, and impeller imbalance up to 64 hours before failure — enabling planned repairs during off-peak demand windows that eliminate service interruptions and emergency contractor dispatch.
EPA Compliance Intelligence
Chemical dosing system condition monitoring prevents the equipment failures that trigger treatment technique violations, Tier 2 public notifications, and state agency regulatory actions — protecting both public health outcomes and the utility's compliance standing under SDWA requirements.
Treatment Process Reliability
Filter performance analytics, blending ratio monitoring, and clearwell level anomaly detection support continuous treatment compliance documentation — converting point-in-time SCADA alarms into predictive condition assessments that enable proactive operator intervention.
Maintenance Optimization
AI-ranked work order prioritization based on equipment condition replaces fixed maintenance calendars with evidence-driven scheduling — reducing the maintenance backlog by 83% and redirecting licensed operator and technician capacity toward value-added reliability and compliance improvement programs.
07 / Business Impact
Operational and Financial Benefits of Predictive-Driven Water Utility Management
Direct Cost Elimination
The $1.4M in annual savings reflects the combined elimination of emergency repair labor premiums, expedited parts procurement, production capacity losses, and regulatory notification compliance costs — all previously absorbed as unavoidable operational expense under a reactive maintenance model that had no mechanism for early intervention.
Regulatory Risk Elimination
Elimination of chemical dosing failures removed the utility from recurring EPA Tier 2 notification obligations, reduced state primacy agency scrutiny, and supported uninterrupted SDWA compliance across all treatment technique requirements. Compliance coordinators redirected from incident response to proactive audit preparation and documentation improvement.
Service Reliability Recovery
With operational uptime improving from 91.4% to 99.1%, the utility recovered the equivalent of 28 additional full-capacity distribution days annually — reliability improvement that directly supports state infrastructure performance reporting, bond rating assessments, and the utility's ongoing capital planning justification to the rate-setting authority.
Workforce Transformation
The maintenance and operations workforce transitioned from a predominantly reactive mode managing unplanned emergencies to a proactive team executing planned, condition-based interventions on a predictable schedule. Technician overtime hours declined by 71% and licensed operator capacity previously consumed by emergency response was redirected to compliance program development.
$2.1M
Annual failure cost before
$700K
Annual maintenance cost after
99%
Uptime achieved
$1.4M
Saved every year
08 / Conclusion
Water Utility Reliability Is Not an Infrastructure Problem — It Is a Data Problem
This water utility's transformation from $2.1 million in annual unplanned maintenance costs and recurring EPA notification events to $1.4 million in documented savings and zero violations was achieved not by replacing aging infrastructure, but by giving operations and maintenance teams the predictive intelligence to act on equipment condition before failure occurs. ifactory's AI-driven platform converted 187 instrumented asset points into a continuous stream of actionable failure predictions — replacing the reactive cycle that had defined utility asset management with a proactive operation that now serves as a documented model for regional water authority peer benchmarking. Book a Demo to see how ifactory delivers this transformation for your water system.
The lasting value of predictive analytics in water utility management is institutional: every failure mode identified, every degradation pattern captured, and every planned intervention executed strengthens the AI model's accuracy and the system's compliance resilience. That compounding intelligence is the foundation of sustainable reliability — and the reason this utility has not experienced an unplanned pump station failure or EPA notification event in over 420 consecutive operational days.
99% Uptime. Zero EPA Violations. Deployed in 38 Days.
AI-driven predictive analytics for pump stations, chemical dosing systems, water treatment, and SCADA-integrated infrastructure — purpose-built for water utility reliability and EPA compliance. See what ifactory delivers for your system.
09 / FAQ
Frequently Asked Questions
How does ifactory predict pump station failures in water utilities?
ifactory monitors vibration, motor current, and discharge pressure across all pump stations using ML models trained on water infrastructure degradation patterns. Actionable alerts are delivered up to 64 hours before failure, enabling planned off-peak repairs. Book a Demo for a live walkthrough.
Can ifactory help water utilities avoid EPA Safe Drinking Water Act violations?
Yes. ifactory tracks chemical dosing system performance — stroke consistency, pressure variance, and flow deviation — detecting degradation before failure. This prevents the equipment faults that trigger SDWA violations and mandatory EPA Tier 2 public notification events.
What savings can a water utility realistically expect from predictive analytics?
Water utilities typically reduce unplanned maintenance costs by 60–75% in year one, with full elimination of pump station failures and OEE gains of 20–30 points. Exact savings depend on your facility's pre-deployment failure cost baseline and asset scale.
How does ifactory integrate with existing water utility SCADA systems?
ifactory connects directly to existing SCADA and telemetry data streams, with wireless sensor support for assets needing additional coverage. Full sensor coverage and initial AI calibration is typically complete within the first two to three weeks of deployment.
How long does deployment take for a water utility?
Most utilities reach full predictive operations within 38 days — covering asset cataloguing, sensor deployment, SCADA integration, model calibration, and staff training. Condition-based work orders are typically generated within the first week of live monitoring.
Does ifactory support water treatment process monitoring alongside distribution infrastructure?
Yes. ifactory monitors filter differential pressure, backwash efficiency, clearwell anomalies, and blending ratios alongside distribution pump stations and chemical dosing — giving operators a single unified condition intelligence platform across the entire water system.