Advanced Metering Infrastructure represents one of the largest capital investments in modern water utility operations, with the average mid-size utility deploying $15M to $40M in smart meters and communication network hardware over a 5 to 7 year rollout. Yet the majority of that investment produces one output: a monthly meter read for billing. The same AMI infrastructure that produces billing data also contains the operational signals for leak zone identification, meter tampering detection, pressure event correlation, and meter accuracy degradation trending. iFactory connects to your AMI head-end system, meter data management platform, and billing system to activate all four operational analytics capabilities from the infrastructure you have already paid for. Book a free AMI analytics assessment for your utility.
iFactory activates four operational analytics capabilities from existing AMI data: DMA night minimum flow analysis for zone-level leak detection, meter accuracy deterioration trending for proactive meter exchange scheduling, communication network health monitoring for read rate optimization, and tamper and backflow event detection for revenue protection. All analytics integrate with your AMI head-end system (Itron, Sensus, Badger Meter, Mueller, Aclara) via API without requiring AMI system replacement or upgrade.
Four Analytics Capabilities Your AMI Data Already Enables
AMI head-end systems are designed to collect and store meter data. iFactory is designed to analyze it. These four capabilities are available from AMI data your utility already collects, typically unused because the AMI head-end software has no analytics layer. Book a demo to see all four activated for your AMI platform.
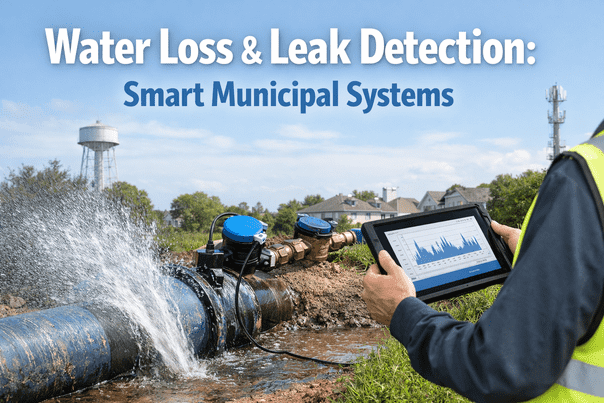
The most valuable signal in AMI data for water loss management is night minimum flow between 2 AM and 4 AM, when legitimate consumption is at its minimum and any sustained flow above the expected residential minimum indicates an active leak in that district metered area. iFactory calculates the expected night minimum flow per DMA based on customer count, property type, and historical night usage patterns, then monitors actual AMI meter readings against this baseline nightly.
Water meters degrade predictably over time, particularly at the high and low flow ends of their range. A meter registering at 96% accuracy on average may be registering at 80% accuracy on low flows, which is where household nighttime consumption, outdoor drip irrigation, and small fixture usage occurs. iFactory tracks each meter's consumption pattern over time and flags meters showing signs of low-flow registration decline, high-flow saturation, or register drift.
AMI networks typically target 98 to 99 percent read success rates, but declining read rates often indicate deteriorating endpoint communication equipment before complete communication failure. Meters dropping from 99% to 94% read success rate are showing early signs of endpoint battery depletion, antenna degradation, mesh network coverage loss, or interference. iFactory monitors read success rate trending per endpoint and per network sector to identify communication infrastructure issues before read rates drop below billing thresholds.
AMI meters generate tamper flag events (magnetic interference, reverse flow, meter cover removal, communication manipulation) that are recorded in the AMI head-end but often go unreviewed because the volume of events exceeds manual review capacity. iFactory processes all tamper events from your AMI head-end, correlates them with consumption anomalies and neighbor meter patterns, and scores each event by revenue risk to prioritize field investigation.
All four analytics capabilities are available from the data your AMI head-end system already stores. iFactory connects to your AMI head-end via API and activates leak detection, meter accuracy trending, network health, and tamper detection without any AMI system modification or upgrade.
AMI Head-End Platform Compatibility
iFactory integrates with all major AMI head-end platforms via REST API or data export. No AMI system replacement is required and no changes to your existing AMI configuration are needed. Book a demo to confirm integration for your specific AMI head-end platform and version.
| AMI Platform | Integration Method | Data Available | Analytics Enabled |
|---|---|---|---|
| Itron OpenWay Riva / Itron Gridstream | REST API via Itron Analytics Platform or direct database export | Hourly meter reads, endpoint status, tamper events, network health, battery status | All four capabilities (leak detection, accuracy, network health, tamper) |
| Sensus FlexNet / Sensus Analytics | Sensus Analytics API or SFTP hourly export | Interval meter reads, alarm events, endpoint communication status, network topology | All four capabilities |
| Badger Meter BEACON AMA | BEACON API or scheduled export | Hourly reads, leak and tamper flags, endpoint health, flow profile data | All four capabilities. Badger Meter flow profile data enables enhanced meter accuracy analysis. |
| Mueller System7 / Mi.Net | Mi.Net API or data warehouse export | Meter reads, network status, alarm events, endpoint data | Leak detection, accuracy trending, network health, tamper (read rate dependent) |
| Aclara STAR Network / TM Series | Aclara MAS API or SFTP export | Meter reads, endpoint status, tamper events, network health indicators | All four capabilities |
| Master Meter ALLEGRO / Meter Data Management Systems | MDS API or CSV export from billing system | Meter reads, consumption data. (Operational flags depend on MDM configuration) | Leak detection and accuracy trending from consumption data. Tamper and network health require endpoint data access. |
Client Results: Water Utilities Using iFactory AMI Analytics
Average non-revenue water percentage reduction within 18 months of iFactory AMI analytics deployment through DMA leak detection and targeted pipe rehabilitation prioritization.
Average annual billing revenue recovered from meter accuracy improvement and tamper detection across all iFactory AMI analytics deployments at mid-size utility scale (50,000 to 200,000 connections).
Average AMI network read rate achieved within 12 months of iFactory network health monitoring deployment, up from an average of 96.4% read rate before proactive endpoint management.
Average time from active leak onset to iFactory DMA alert identifying the affected zone, enabling field crews to be dispatched to the correct zone boundary without prior field survey.
DMA night minimum flow analysis runs automatically every night from your AMI data and produces a ranked leak zone list every morning before your field crews start their day. No acoustic survey required for zone identification. No manual data analysis required. No additional instrumentation needed.
iFactory vs Competing AMI Analytics and Water Loss Management Platforms
Most AMI head-end platforms include basic reporting. Few include the analytics layer that converts meter data into operational intelligence. iFactory differentiates by integrating all four operational analytics capabilities with CMMS work order generation and on-premise government deployment. Book a demo to see iFactory compared to your current AMI analytics capabilities.
| Capability | iFactory | Cityworks (Esri) | Lucity (CentralSquare) | IBM Maximo | MaintainX | Limble CMMS | AMI Head-End Native | AssetWorks |
|---|---|---|---|---|---|---|---|---|
| AMI Analytics Capabilities | ||||||||
| DMA night flow leak detection from AMI data | Nightly zone-level analysis | No AMI analytics | No AMI analytics | Via IoT add-on | No | No | Basic reporting only | No AMI analytics |
| Per-meter accuracy deterioration trending (AWWA M6) | Individual meter risk scoring | No | No | No | No | No | Age-based only | No |
| Tamper event risk scoring and revenue loss estimation | AI-scored priority queue | No | No | No | No | No | Raw event log only | No |
| Operations Integration and Architecture | ||||||||
| Automatic CMMS work order from meter or leak alert | Pre-populated work order in 60 sec | GIS-linked work order | Manual work order | Via workflow | Manual work order | Manual work order | No CMMS | Via integration |
| On-premise deployment (government data sovereignty) | Full on-premise, zero cloud egress | Cloud or on-prem | Cloud or on-prem | Cloud or on-prem | Cloud SaaS | Cloud SaaS | Vendor cloud | Cloud or on-prem |
Based on publicly available product documentation as of Q1 2025. Verify capabilities with each vendor before procurement decisions.
Regional Compliance: AMI Data, Water Loss Reporting, and Revenue Protection Requirements
| Region | Key AMI and Water Loss Compliance Requirements | iFactory Coverage |
|---|---|---|
| USA | AWWA M36 Water Loss Control standards require annual water loss audit and real losses component documentation. AWWA M6 Residential Meter Testing and Data Management recommends meter accuracy testing schedules by meter size and age. State Public Utility Commission (PUC) regulations in many states mandate maximum meter inaccuracy thresholds for billing. EPA AWIA 2018 requires water loss assessment as part of asset management certification. AWWA WSO (Water System Optimization) program requires NRW tracking and reporting. | AWWA M36 water loss audit data from AMI DMA analysis. AWWA M6 meter accuracy testing compliance tracking per meter class. State PUC accuracy threshold monitoring. AWIA water loss assessment evidence. All data on-premise within US jurisdiction. |
| UAE | UAE Smart Utility program requires water loss monitoring and AMI deployment documentation. DEWA technical requirements for smart metering network performance and read rate standards. Abu Dhabi DoE water efficiency reporting requirements including NRW targets. UAE Vision 2031 water conservation goals require utility NRW tracking. ESMA metrological requirements for water meter accuracy and certification. | UAE Smart Utility AMI performance documentation. DEWA read rate monitoring and network health. DoE NRW reporting data. ESMA meter accuracy tracking. Arabic platform outputs. All data on-premise within UAE jurisdiction. |
| UK | Ofwat PR24 leakage performance commitment with AMI-derived leakage measurement. Water UK's Leakage Operational Framework requires DMA metering and night flow analysis. UK Measuring Instruments Directive (MID) for water meter accuracy certification. Ofwat smart metering programme expectations for data quality and operational analytics. Water fittings regulations for backflow prevention cross-connection control. | Ofwat leakage performance commitment tracking from AMI night flow. Water UK DMA monitoring framework. MID meter accuracy compliance. Smart metering operational analytics evidence. Backflow detection for cross-connection control. All data on-premise within UK. |
| Canada | Infrastructure Canada asset management reporting for AMI infrastructure investment. Measurement Canada regulations for water meter accuracy certification and testing schedules. Provincial water efficiency reporting requirements (Ontario, BC, Alberta). Canadian Water and Wastewater Association (CWWA) NRW management guidelines. PIPEDA compliance for customer meter data privacy. | Infrastructure Canada AMI investment performance reporting. Measurement Canada accuracy tracking by meter class. Provincial NRW reporting data. CWWA guidelines compliance. PIPEDA-compliant on-premise customer data processing. Bilingual EN/FR platform. All data within Canada. |
| Germany / EU | EU Measuring Instruments Directive (MID) 2014/32/EU for water meter accuracy and certification. GDPR for smart meter consumption data processing and customer privacy. German Energy Industry Act (EnWG) smart metering framework applicable to water utilities adopting smart metering. DVGW W 406 water meter standards. EU Water Framework Directive cost recovery requirements including water loss tracking. | EU MID meter accuracy compliance tracking. GDPR-compliant on-premise smart meter data processing. DVGW W 406 metering standards. EU WFD water loss cost recovery tracking. All meter data processed within EU jurisdiction. Data residency guaranteed. |
Frequently Asked Questions
Continue Reading
iFactory connects to your AMI head-end via API and activates all four operational analytics capabilities within 2 to 3 weeks. Average outcome: 23% NRW reduction, $1.2M annual revenue recovery, 99.1% read rate. All smart meter data on-premise within your government network.