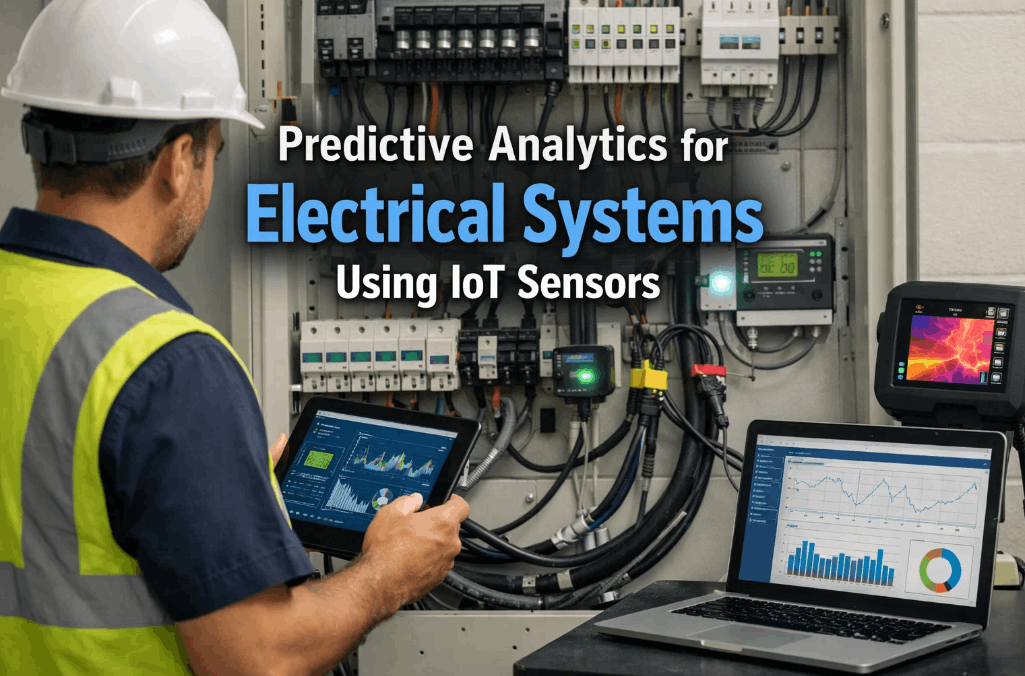
For modern commercial facilities, the switchgear and electrical distribution network are the "Invisible Infrastructure"—silent, mission-critical, and historically neglected until catastrophic failure occurs. Traditional maintenance relies on annual infrared scans and manual meter readings, yet 70% of electrical failures result from transient anomalies like harmonic resonance or subtle thermal drift that occur between inspection cycles. Predictive analytics for electrical systems using IoT sensors transforms high-current environments into "Intelligent Grids." By synchronizing wireless current monitoring with AI-driven power quality analysis, iFactory detects insulation decay and connector fatigue weeks before they trigger arc-flash events or building-wide brownouts. Book an Electrical Health Audit to secure your facility's power continuity.
Monitor Power Quality & Grid Health in Real Time
Deploy a smart electrical sensor network to detect current imbalances, voltage sags, and thermal anomalies before they impact your critical operations.
The Strategic Value of IoT-Driven Electrical Condition Monitoring
Legacy electrical maintenance is inherently reactive. Manual inspections only capture a "snapshot" in time, often missing the intermittent power monitoring IoT data that signals imminent component death. Integrating electrical IoT sensors into your switchgear and distribution panels allows for continuous oversight of Total Harmonic Distortion (THD), phase unbalance, and thermal resistance drift. This real-time visibility is the foundation of electrical predictive Analytics, enabling shifts from scheduled shutdowns to precision, condition-based interventions. Schedule a Demo to see how AI identifies "invisible" electrical risks.
For data centers, hospitals, and Class-A office towers, even a 500ms voltage sag can cause massive equipment damage or tenant loss. Smart electrical Analytics provides a high-fidelity "Digital Twin" of your power grid, correlating ambient temperature with current draw to identify loose connections long before traditional IR windows see a hotspot. By automating the auditing of electrical sensor monitoring data, facilities compress their maintenance costs while improving portfolio-wide safety scores.
Four Critical Electrical Failure Modes Resolved by AI
Electrical failures follow distinct physical signatures. Electrical AI detection monitors these waveforms 24/7 to catch anomalies that escape human detection.
Thermal Drift in Connector Pins & Busbars
Loose mechanical connections create localized resistance, resulting in exponential heat growth. IoT temperature sensors detect these "Micro-Hotspots" ($10K+ savings in prevented fire damage) weeks before they reach a binary failure state. Book a Demo to model your panel health.
Harmonic Distortion & Insulation Stress
Non-linear loads (VFDs, LED drivers) inject Total Harmonic Distortion (THD) into the system. Over time, high THD causes neutral-wire overheating and motor insulation breakdown. Power quality monitoring identifies these resonance patterns instantly.
Phase Imbalance & Transformer Skew
Uneven distribution of single-phase loads across a three-phase system creates circulating currents, overheating transformers and reducing efficiency. Current monitoring building analytics identify imbalance triggers in real-time.
Transient Voltage Spikes & Sag Detection
High-speed transients from grid switching or nearby lightning damage sensitive IT infrastructure. Electrical fault prediction models use high-frequency sampling (up to 1MHz) to detect surge-arrester degradation before it fails to protect your assets.
Electrical Analytics ROI: Performance Lift by Asset Class
The economic benefits of a smart electrical Analytics overlay scale with the criticality of your facility. Verified ROI is consistently 6.5x–9.2x within the first 12 months.
| Facility Category | Primary Operational Risk | Annual Cost at Risk | AI Prevention Savings | Payback Window | Year-1 ROI |
|---|---|---|---|---|---|
| Tier 3/4 Data Centers | Voltage sag, harmonic interference | $850K–$2.2M | $750K–$1.8M | 4–6 weeks | 9.2× |
| Level 1 Trauma Hospitals | ATS failure, critical power quality | $500K–$1.1M | $450K–$950K | 5–8 weeks | 8.1× |
| Class-A Commercial Office | Electrical fires, peak demand fees | $180K–$320K | $140K–$280K | 8–12 weeks | 6.5× |
| Cold Storage & Food Logistics | Motor failure, phase imbalance | $300K–$650K | $260K–$550K | 6–9 weeks | 7.8× |
By deploying an electrical sensor network, facilities managers eliminate the "Insurability Gap"—proving that proactive failure prevention reduces property risk and CAPEX outlays.
Five Key Metrics for Power Analytics & Health Integrity
To achieve true electrical condition monitoring, our AI ingestion layer monitors five interconnected electrical signatures. Book a Demo to see live sensor telemetry.
1. Current Unbalance & Zero-Sequence Flux
Monitors the vector sum of currents. AI detects when an imbalance exceeds 2%, triggering a re-balancing strategy before the neutral wire reaches critical thermal saturation.
2. Voltage Total Harmonic Distortion (V-THD)
The platform tracks the "Smoothness" of the voltage waveform. Sudden increases in harmonics indicate failing VFD filters or capacitors, preventing secondary equipment damage across the entire grid.
3. Pin-to-Pin Thermal Delta (ΔT)
Wireless infrared thermal nodes monitor breaker connectors. The AI triggers alerts if a 7°C delta is detected between phases, identifying loose bolts or connector oxidation immediately.
4. Power Factor & Displacement Error
Real-time lagging/leading power factor monitoring prevents utility surcharge penalties. The AI cross-references this with motor load to identify failing capacitor banks autonomously.
5. Transient Waveform Capture
Fuses high-speed voltage sampling with surge-count metadata. It identifies "Micro-Surges" that degrade sensitive PLC boards and medical imaging equipment silently (Scope-3 liability protection).
Compliance Automation: NFPA 70B & OSHA Electrical Safety Workflow
The new **NFPA 70B standard** now mandates shift-based condition monitoring for critical assets. Manual logbooks are no longer sufficient for insurance liability or OSHA audits. Book a Demo to automate your NFPA 70B compliance.
iFactory electrical predictive Analytics auto-generates tamper-proof compliance logs. Every current spike, thermal alert, and maintenance workaround is logged with an encrypted digital timestamp, ensuring your facility is "Audit-Ready" 24/7/365.
Digital Safety Metrics & Deliverables
The platform establishes a secure digital "Safety-Mesh," mapping electrical sensor network data directly to your maintenance tickets.
- Automated IR Logs: Virtual thermal snapshots generated every 15 minutes, replacing annual manual scans.
- Waveform Forensics: Automated "Black-Box" recording of the 60 seconds of data prior to any trip.
- Arc-Flash Mitigation: Early identification of failing insulation reduces the severity of incident energy.
- OSHA 1910 Alignment: Direct integration with safety permitting and work-order management.
- Predictive EOL: Alerts for upcoming breaker and capacitor bank end-of-life status.
- Liability Archiving: 5-year data retention for forensic insurance investigations.
By converting your electrical assets into a synchronized smart electrical Analytics node, you transform risk management from a paperwork burden into a real-time safety asset that lowers insurance premiums.
60-Day Deployment Roadmap: The Path to Electrical Intelligence
Deploying electrical IoT sensors requires zero downtime. Our non-invasive current transducers (Split-Core CTs) and wireless thermal nodes deploy in weeks, not months.
Split-core CTs and wireless IR nodes tap into main switchgear and sub-panels. No power shutdown required. Electrical sensor network baseline data begins flowing into the cloud immediately.
Machine learning models ingest your facility's unique load-cycle data (HVAC spikes, IT cycles). Electrical AI detection thresholds are calibrated to flag a 0.5% deviation from your healthy "Fingerprint."
The electrical predictive Analytics dashboard goes fully live. Automated ROI reports document energy savings and identified hot-spot risks, delivering 4–8x payback before project closure.
Stop Electrical Breaker Trips Before They Paralyze Your Business
Real-time power quality monitoring and AI thermal sensing with automated NFPA 70B compliance—deployed in 60 days with guaranteed ROI.
Correlation Matrix: Power Quality vs. Maintenance Lifecycle
Your equipment's lifespan is directly linked to the "Cleanliness" of your electricity. Power monitor analytics building metrics reveal how micro-anomalies shave years off your asset life.
Electrical Health Indicators & Predicted Lifecycle Impact
| Voltage Unbalance (%) | A 1% unbalance leads to a 10% increase in motor temperature, cutting insulation life by 50% |
| THD (Harmonics) | Rising THD (>5%) creates 15%–20% extra heat in neutral wires, accelerating fire risk |
| Crest Factor Deviation | Abnormal peak-to-RMS ratios indicate failing power supply units in IT infrastructure |
| Thermal Delta (ΔT) | A 10°C rise in connector temperature triples the rate of oxidation, leading to thermal runaway |
Energy Savings: Quantifying Electrical Efficiency Gains
Most commercial buildings waste 12%–18% of their electrical spend on "Phantom Loads" and reactive power losses. Electrical sensor monitoring identifies these leaks in weeks.
Peak Demand Shaving
AI identifies the top 5 consumption drivers during peak utility cost-windows. Automated load-shifting reduces annual demand charges by $40K–$110K per property.
Phase Rebalancing Savings
Rebalancing three-phase loads across the facility reduces "Stray Currents" and neutral heating, resulting in a 3%–5% direct reduction in total kWh consumption.
Breaker Renewal Deferral
By managing thermal loads and harmonics, the healthy life of switchgear is extended by 25%—deferring $250K+ in substation replacement CAPEX by 3–5 years.
Insurance Premium Recovery
Documented 24/7 condition monitoring allows for "Risk-Based Premium" negotiation, saving $15K–$35K annually in facility insurance costs.
The Electrical Analytics Maturity Curve
Smart electrical Analytics ROI scales with your facility's digital integration. Moving from Level 1 to Level 4 doubles your maintenance efficiency.
| Maturity Level | Technical Capability | Reliability Capture | Typical Environment |
|---|---|---|---|
| Level 1 — Manual Compliance | Annual IR scans, manual breaker testing | 10–15% | Standard office, manual maintenance |
| Level 2 — Cloud Metering | Smart sub-meters, simple energy charts | 20–35% | BMS-integrated commercial buildings |
| Level 3 — Sensor Telemetry | 24/7 CT monitoring, thermal nodes, THD tracking | 45–65% | Industrial plants & Data Centers |
| Level 4 — Predictive AI Ops | Machine learning fault prediction, automated compliance | 75–90% | Critical Mission Facilities |
| Level 5 — Autonomous Grid | Self-healing load shed, AI-PM automation | 90–98% | Industry 4.0 Smart Microgrids |
Key Takeaways: Why Electrical Analytics Matter Now
The transition to electrical predictive Analytics is no longer optional for high-value properties. Book a Demo to see your facility's potential ROI.
Rapid Payback: 4–12 week ROI window depending on facility type, with 6.5x or higher year-one returns.
Invisible Risk Exposure: Harmonics and phase imbalance follow measurable curves that AI catches 2–4 weeks before failure.
Audit-Ready Safety: Smart electrical Analytics automate NFPA 70B and OSHA compliance logging entirely.
Non-Invasive Install: 60-day deployment with zero power shutdowns or operational disruptions.
Frequently Asked Questions
Below are the most common questions from operations leaders evaluating electrical IoT sensors and AI overlays.
Does installation require a building-wide power shutdown?
No. Our current transducers (Split-Core CTs) snap around existing conductors without disconnecting power. This allows for seamless deployment in live environments like active hospitals and 24/7 data centers.
How do sensors communicate in underground electrical rooms?
We use a 900MHz LoRaWAN mesh network. This low-frequency signal penetrates thick concrete and steel switchgear better than WiFi or 5G, ensuring 100% data continuity in shielded environments.
How accurate is the fault prediction on older legacy panels?
Extremely accurate. The AI doesn't care about the age of the breaker—it monitors the physics of the current. It identifies failing insulation and thermal drift regardless of whether the equipment is 3 or 30 years old.
What is the battery life of the wireless thermal sensors?
Our specialized nodes are designed for 5–7 years of continuous reporting at high-density sampling rates. Battery status is monitored directly on the electrical predictive Analytics dashboard.
Can we integrate this with our current BMS (Johnson Controls, Siemens)?
Yes. iFactory provides a full MQTT and BACnet/IP export layer, allowing our advanced predictive alerts to be viewed directly inside your existing BMS or SCADA interfaces.
Get Your Custom Electrical ROI Report Today
Quantify exactly how predictive Analytics will eliminate electrical downtime and reduce demand charges for your specific portfolio.