
Property analytics software pays for itself faster than most operators realize — but only if the ROI model captures every value stream, not just the obvious ones. iFactory Property Analytics delivers a typical payback inside 10 months by compressing labor, retaining tenants, and converting reactive spend into preventive savings. Book a demo to walk through a portfolio-specific ROI model built on your unit count, vendor spend, and current pain points.
Build the Business Case Before You Pitch the Budget
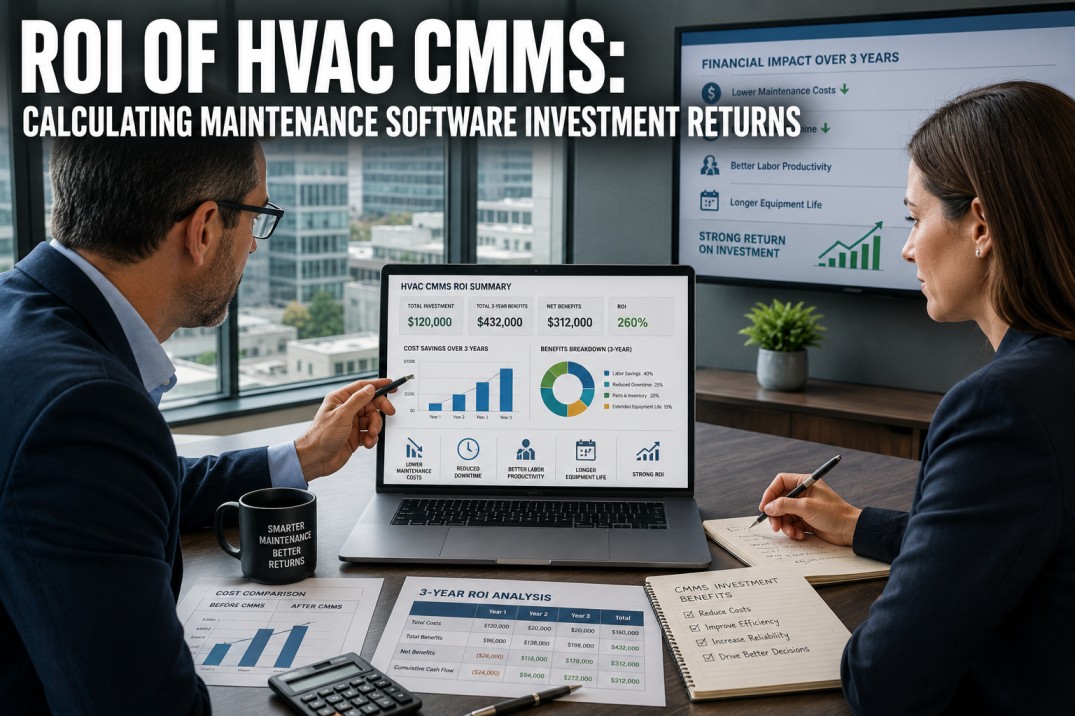
A complete ROI model captures five value streams — labor savings, vendor cost control, tenant retention, compliance, and faster reporting. Most teams undercount three of them.
How to Actually Calculate Property Software ROI
The formula is simple. The discipline is making sure every number that goes into it reflects real operating conditions — not vendor marketing or wishful thinking.
The Five Streams That Build Your Total Benefit
Most ROI calculations only count labor savings — and that's why they underestimate the real return. A complete model captures five distinct value streams. The last two are where teams consistently leave money on the table.
Labor Time Savings
Hours recovered from coordination work, status calls, manual dispatch, and report compilation. Multiply by fully-loaded hourly rate.
Vendor & Maintenance Cost
Reactive emergency repairs cost 4.8× more than scheduled PM. Centralized vendor governance also captures 15–25% pricing leverage.
Tenant Retention Value
Maintenance-responsive properties see meaningfully higher renewal rates. Each saved turnover preserves rent, vacancy days, and turn costs.
Compliance & Risk Reduction
Audit-ready records, insurance premium reductions, and avoided fines from missed inspections add up to significant annual value.
Faster Decision Velocity
Real-time data shortens budget cycles, CapEx planning, and vendor reviews. Compounds into better strategic outcomes over time.
What's Actually on the Cost Side of the Equation
The denominator in the ROI formula needs the same discipline as the numerator. Most sticker prices miss 30–40% of the true first-year cost. This breakdown shows where the hidden numbers live.
| Cost Category | What It Covers | Year 1 | Year 2+ |
|---|---|---|---|
| Subscription Licensing Per-unit or per-property fees |
Core platform access, user seats, base features | Visible | Visible |
| Implementation & Setup One-time onboarding |
Data migration, integration setup, configuration | Often Hidden | — |
| Integration Fees PMS, accounting, IoT |
API connections, webhook configuration, sync tooling | Often Hidden | Visible |
| Team Training Adoption labor |
Workshops, documentation, on-boarding hours per role | Often Hidden | Minor |
| Transition Productivity Dip Temporary slowdown |
Lost productivity during cutover period | Hidden | — |
| Premium Features AI add-ons, analytics |
Advanced AI modules, custom reporting, premium support | Visible | Visible |
Get a Portfolio-Specific Cost-Benefit Analysis in 30 Minutes
Our team plugs your unit count, vendor spend, and current pain points into a side-by-side ROI worksheet — so you walk away with a defensible business case, not a generic pitch.
ROI by Portfolio Size — Three Realistic Scenarios
ROI math shifts meaningfully with portfolio size. Smaller portfolios pay back faster on labor savings; larger ones see compounding gains from vendor consolidation and tenant retention. These three scenarios show how the numbers actually move.
100-Unit Portfolio
Single property · Mid-tier operator
500-Unit Portfolio
5–10 properties · Growing operator
2,000+ Unit Portfolio
15+ properties · Enterprise operator
Where the Returns Show Up — Month by Month
ROI isn't linear. Different value streams kick in at different times. Understanding the curve helps set realistic expectations with leadership and avoid the "where's the value?" conversation at month three.
Quick Wins Land
Status call volume drops as automated notifications launch. Accounting catches its first miscoded exceptions. Visible labor savings emerge.
Workflow Compression
PM compliance climbs above 90%. SLA breach rate falls. Vendor invoice processing time collapses. Coordinator hours fully redeployed.
Vendor Renegotiation Window
Performance scorecards enable contract renegotiation. Reactive spend shifts to preventive. Insurance underwriters notice the improved posture.
Full Payback Achieved
Tenant renewal lift becomes measurable. CapEx planning shifts from reactive to predictive. Annual ROI calculation crosses 100%.
Compounding Returns
Asset valuation gains and portfolio-wide benchmarking unlock strategic decisions. ROI typically lands at 150–300% in years two and beyond.
Four ROI Calculation Errors That Sink Business Cases
Property analytics business cases fail in the same predictable ways. Avoiding these four mistakes will keep your model defensible when leadership pushes back.
Counting Only Labor Hours
Skipping retention, vendor consolidation, and compliance value undercounts ROI by 50–70%. Build all five streams into the numerator from day one.
Using Sticker Price as TCO
Implementation, integration, training, and productivity dip can add 30–40% to year-one cost. Request itemized 3-year TCO from every vendor before signing.
Front-Loading All Benefits
Assuming month-one productivity gains creates credibility problems. Distribute realistic benefit recognition across the 12-month payback curve.
Ignoring the Status Quo Cost
"Doing nothing" isn't free. Document the rising cost of spreadsheets, manual processes, and lost tenants alongside the software cost.
Frequently Asked Questions
How quickly do most property portfolios reach ROI breakeven?
Most portfolios reach breakeven between 6 and 12 months. Mid-size operators (100–500 units) typically see the fastest payback because they capture both labor savings and vendor consolidation gains simultaneously. Enterprise portfolios sometimes take slightly longer to break even but generate substantially higher absolute returns.
What's the single biggest ROI driver — labor or something else?
It depends on portfolio size. Under 200 units, labor savings dominate. Between 200 and 1,000 units, vendor cost control overtakes labor. Above 1,000 units, tenant retention and asset valuation gains become the largest contributors. A complete ROI model captures all five value streams regardless of where the dominant lever sits.
How do I justify the investment when the benefits are mostly soft savings?
Quantify what looks soft. Labor hours have an hourly rate. Tenant retention has a turnover cost (vacancy days + turn cost + marketing). Compliance risk has insurance premium impact. Every "soft" benefit can be converted to a hard number if you map it to an existing line item in your operating budget.
What's the typical 3-year TCO for property analytics software?
For a 500-unit portfolio, 3-year TCO typically runs in the $40K–$120K range depending on platform tier and AI add-ons. Year 1 carries implementation and integration overhead; years 2 and 3 are mostly subscription. Always request an itemized 3-year quote that separates one-time from recurring costs.
How do I measure ROI after implementation to prove the business case?
Set baselines before go-live: hours per work order, vendor spend per unit, response time averages, renewal rates, month-end close time. Measure the same metrics at 90, 180, and 365 days. The delta multiplied by your value-per-hour assumptions gives you a defensible post-implementation ROI number to share with leadership.
Get a Defensible ROI Model Built on Your Numbers
Stop relying on generic vendor ROI claims. Walk through a portfolio-specific cost-benefit worksheet that captures all five value streams and accounts for true TCO.


.png)
