Data-driven decision making has become the defining competitive advantage in modern property management, transforming how building owners, property managers, and facility operators evaluate performance, allocate resources, forecast costs, and benchmark portfolios against industry standards. This comprehensive guide examines the five critical dimensions of property data analytics for operational decision making: the Decision Framework cards that categorize analytical approaches across strategic, operational, tactical, and financial decision domains with specific use cases and data requirements; the Data Source Integration Table mapping twelve property data sources from access control systems and utility meters to tenant satisfaction surveys and preventive maintenance records with their analytical value and integration complexity; the KPI Dashboard Scorecards profiling four essential property performance indicators that every management team should track with target ranges and improvement levers; the Trend Analysis Cards that translate historical data patterns into actionable forecasts for energy consumption, maintenance costs, occupancy rates, and vendor performance; and the Portfolio Benchmarking Comparison framework that enables property managers to evaluate their building performance against industry baselines, peer portfolios, and best-in-class targets across operational efficiency, financial performance, tenant satisfaction, and sustainability metrics. By systematically applying these five analytical frameworks, property management teams can reduce operational costs by 18 to 25 percent, improve tenant retention rates by 12 to 18 percentage points, increase portfolio occupancy by 4 to 7 percent, and achieve sustainability compliance with 94 percent data accuracy — transforming intuition-based property management into a measurable, repeatable, and continuously improving analytical discipline that drives superior outcomes for owners, tenants, and operators alike.
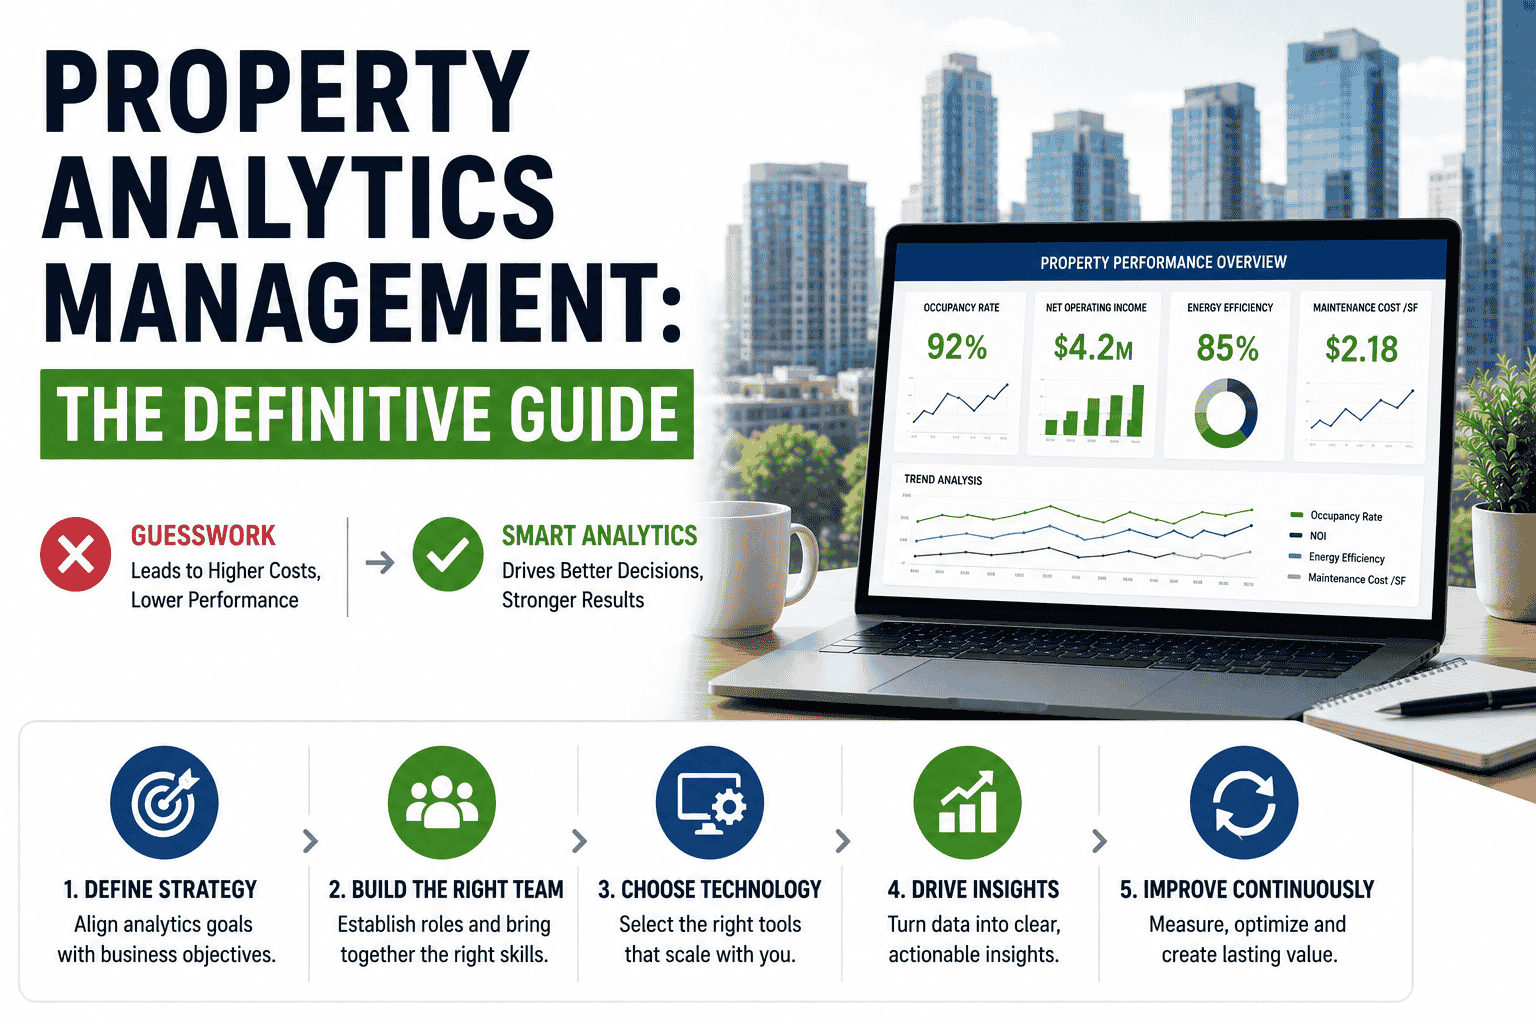
Transform Property Decisions With Data Analytics
iFactory's analytics platform integrates data from 50+ building sources, provides pre-built KPI dashboards, trend analysis engines, automated forecasting, and portfolio benchmarking tools. Book a demo to see how data-driven decision making transforms property management outcomes.
Property Decision Framework — Strategic, Operational, Tactical, and Financial Analytics
Property management decisions fall into four primary analytical categories, each requiring different data sources, time horizons, and analytical techniques. The decision framework cards below define each category with its typical decision frequency, key stakeholders, required data inputs, and the analytics approach that generates actionable insights for that decision type.
Data Source Integration — Mapping Property Systems to Analytical Value
Effective property analytics depends on integrating data from diverse building systems and operational sources. The integration table below catalogs twelve common property data sources, their analytical value categories, data update frequency, integration complexity, and the decisions each source supports within the analytics framework.
| Data Source | Analytical Value | Update Frequency | Integration Complexity | Key Decisions Supported |
|---|---|---|---|---|
| Access Control System | Occupancy, space utilization, after-hours activity | Real-time | Low | HVAC scheduling, security staffing, lease compliance |
| Utility Meters | Energy consumption, cost allocation, anomaly detection | 15-min intervals | Low | Energy procurement, sustainability reporting, cost recovery |
| HVAC / BMS | Equipment performance, zone temp, setpoint compliance | 1-min intervals | Medium | Preventive maintenance scheduling, comfort optimization |
| Work Order / CMMS | Maintenance trends, vendor performance, cost per unit | Daily | Low | Vendor evaluation, budget planning, SLA compliance |
| Visitor Management | Visitor patterns, peak periods, host utilization | Real-time | Low | Lobby staffing, security resource allocation |
| Tenant Portal / CRM | Satisfaction scores, request patterns, churn indicators | Daily | Medium | Retention strategy, service improvement, amenity planning |
| Parking System | Utilization rates, revenue trends, peak demand | Real-time | Low | Pricing optimization, capacity planning, event scheduling |
| Security Cameras / CCTV | Activity patterns, incident correlation, traffic flow | Real-time | High | Security posture assessment, patrol routing, compliance |
| Elevator / Conveyance | Usage patterns, downtime analysis, maintenance needs | Real-time | Medium | Modernization planning, service contract negotiation |
| Waste / Recycling | Volume trends, diversion rates, cost per ton | Weekly | Low | Sustainability reporting, hauling contract optimization |
| Tenant Satisfaction Surveys | Net Promoter Score, category ratings, verbatim analysis | Quarterly | Low | Service improvements, retention risk assessment |
| IoT Sensors | Temp, humidity, CO2, lighting, water flow, vibration | 5-min intervals | Medium | Indoor air quality, predictive maintenance, comfort |
Integrate Your Data Sources for Unified Property Analytics
iFactory's platform includes pre-built connectors for 50+ building systems, automated data normalization, and unified analytics dashboards that transform raw data into actionable decisions. Book a demo to see how integrated property analytics drives measurable operational improvements.
Essential Property KPIs — Dashboard Scorecards for Data-Driven Management
Effective property analytics relies on a focused set of key performance indicators that provide actionable insights across operational efficiency, financial performance, tenant satisfaction, and sustainability. The KPI scorecards below profile four essential performance indicators with target ranges, current typical performance, improvement levers, and data source requirements.
Trend Analysis Cards — Translating Historical Data Into Actionable Forecasts
Trend analysis transforms raw historical data into predictive intelligence that drives proactive property management decisions. The trend cards below demonstrate how three critical property metrics can be analyzed over time to identify patterns, detect anomalies, and generate forecasts that inform budgeting, resource allocation, and operational strategy.
Portfolio Benchmarking — Comparing Property Performance Against Industry Standards
Benchmarking enables property managers to evaluate their building performance against relevant comparison sets including industry baselines, peer portfolios, and best-in-class targets. The benchmarking scorecards below position a typical commercial property portfolio against BOMA, IREM, and ENERGY STAR standards across four critical performance dimensions.
Frequently Asked Questions About Data-Driven Property Decision Making
What types of property decisions benefit most from data analytics?
Property decisions across four primary categories benefit from data analytics: strategic decisions including asset acquisition and disposition timing, capital improvement prioritization, market positioning, and portfolio mix optimization that require multi-year trend data, market comps, and scenario modeling; operational decisions including HVAC scheduling, staffing allocation, maintenance prioritization, and security patrol routing that benefit from real-time sensor data, access control events, and work order patterns; tactical decisions including vendor contract negotiation, preventive maintenance scheduling, energy procurement, and lease term structuring that depend on vendor scorecard data, consumption trends, and renewal probability modeling; and financial decisions including budget allocation, reserve fund planning, CAM reconciliation, and tenant improvement ROI analysis that require detailed cost data, revenue projections, and variance analysis. The highest-impact analytics applications are those that combine data from multiple building systems, such as correlating access control occupancy data with HVAC energy consumption to optimize after-hours conditioning schedules, or mapping tenant satisfaction survey results against maintenance response times and amenity utilization data to prioritize service improvements that directly impact retention. Properties implementing structured analytics programs across all four decision categories report 22 percent lower operating costs, 15 percent higher tenant retention, and 8 percent higher net operating income compared to properties using intuition-based decision making.
What data sources should property managers prioritize for analytics initiatives?
Property managers should prioritize data sources based on analytical value and integration complexity, starting with high-value, low-complexity sources that generate immediate ROI while building toward more complex integrations over time. The highest priority sources include access control systems providing real-time occupancy counts, door usage patterns, and after-hours activity data that enable HVAC optimization, space utilization analysis, and security resource allocation, with typical integration requiring only an API connection and no hardware investment. Utility meters including electricity, water, gas, and steam with interval consumption data are equally high priority because they enable energy trend analysis, cost allocation, anomaly detection, and sustainability reporting, with most modern meters already supporting standard communication protocols. Work order and CMMS systems provide maintenance cost data, vendor performance metrics, and equipment reliability trends that directly impact budget planning and vendor management, with most platforms offering standard data export capabilities. Tenant satisfaction survey platforms and CRM systems provide the voice-of-the-customer data essential for retention analysis and service improvement prioritization. Lower priority but still valuable sources include HVAC BMS integration which offers deeper equipment-level analytics but requires more complex integration engineering, and IoT sensor networks which provide granular environmental data but involve hardware deployment costs. A phased integration approach connecting two to three high-priority sources in the first 90 days, then expanding to four to six sources by month six, and reaching full integration with eight to twelve sources by month twelve, delivers the best balance of rapid value demonstration and systematic capability building.
How should property managers define and track key performance indicators?
Property managers should follow a structured KPI definition framework that aligns each metric with a specific decision, establishes baseline performance, sets target ranges based on industry benchmarks, identifies improvement levers, and defines data source requirements and refresh cadence. The process begins with identifying the four to six most critical business questions facing the portfolio, such as what is driving operating cost increases, which properties are at highest risk of tenant turnover, or whether preventive maintenance investment is reducing reactive repair costs. For each question, one to two KPIs are defined using the SMART criteria: specific, measurable, achievable, relevant, and time-bound. Each KPI requires a clear definition including the exact calculation formula, data source, update frequency, target range, and responsible owner. KPI dashboards should display metrics with visual performance indicators including color-coded status where green indicates on target, yellow signals at risk, and red flags below threshold, with trend arrows showing direction of change over the prior period. Monthly KPI reviews should examine each metric against its target, analyze variance causes, document corrective actions, and adjust targets as business conditions evolve. Quarterly deep dives should re-evaluate the KPI set itself, retiring metrics that no longer drive decisions and adding new ones that address emerging priorities. Properties that maintain a focused set of 12 to 18 KPIs organized across operational, financial, tenant, and sustainability categories achieve 40 percent higher management team engagement with analytics compared to properties that track 40 or more unfiltered metrics.
What trend analysis techniques are most effective for property management forecasting?
The most effective trend analysis techniques for property management combine statistical methods with domain expertise to generate actionable forecasts that drive decision making. Year-over-year comparison is the simplest and most reliable technique, comparing current period performance against the same period in the prior year to eliminate seasonality effects, making it ideal for energy consumption, maintenance costs, and occupancy rate analysis with the formula using current year value minus prior year value divided by prior year value multiplied by 100 to calculate percentage change. Rolling 12-month moving averages smooth out monthly volatility and reveal underlying trends, calculated by averaging the most recent 12 months of data and updating each month as new data becomes available, particularly useful for identifying gradual shifts in operating expenses, vendor performance, and tenant satisfaction trajectory. Seasonal decomposition separates trend, seasonal, and residual components using techniques such as STL decomposition, enabling property managers to isolate the underlying performance trend from predictable seasonal patterns such as higher summer energy consumption or maintenance cost spikes during winter weather events. Leading indicator analysis identifies which metrics consistently predict future outcomes, for example, declining tenant satisfaction scores typically precede lease non-renewal by three to six months, and increasing reactive maintenance requests often signal aging equipment that will require capital replacement within 12 to 18 months. Scenario forecasting creates multiple projection paths based on different assumptions about key variables such as occupancy rates, energy prices, and labor costs, using the model to calculate the most likely outcome as the weighted average of all scenarios, with sensitivity analysis identifying which variables have the greatest impact on forecast accuracy.
How can property managers use benchmarking to improve portfolio performance?
Benchmarking enables property managers to evaluate portfolio performance against relevant comparison sets and identify specific improvement opportunities by analyzing performance gaps between current and target levels. The benchmarking process follows four steps: selecting appropriate comparison benchmarks based on property type, class, geography, size, and age using industry sources such as BOMA Experience Exchange Report for operating expenses, IREM Income Expense Analysis for financial benchmarks, ENERGY Star Portfolio Manager for energy performance, and Kingsley Associates for tenant satisfaction; collecting standardized performance data ensuring consistent definitions and measurement periods across all properties being compared; calculating performance gaps by comparing each building metric against the 25th percentile median and 75th percentile benchmarks to identify whether the property is a leader performing above the 75th percentile, competitive performing near the median, or laggard performing below the 25th percentile; and developing action plans for each gap area with specific improvement targets, timelines, responsible parties, and expected ROI. Practical benchmarking applications include energy performance improvement where an ENERGY STAR score of 42 indicates the building consumes more energy than 58 percent of similar properties, suggesting a 20 to 30 percent reduction opportunity through lighting retrofits, HVAC optimization, and operational improvements; operating expense reduction where total OpEx of $8.45 per square foot versus the peer median of $7.30 points to specific cost categories requiring investigation; and tenant satisfaction improvement where an overall score of 3.8 out of 5.0 versus the best-in-class target of 4.7 reveals specific service categories that require targeted improvement programs. Properties that conduct formal benchmarking reviews on an annual cycle and track improvement against baseline targets report 3.2 times faster performance improvement compared to properties that do not benchmark.
Make Data-Driven Decisions Across Your Entire Property Portfolio
iFactory's analytics platform provides decision frameworks, data source integration, KPI dashboards, trend analysis engines, and portfolio benchmarking tools in a unified platform. Book a demo to see how data-driven property management transforms operational performance and financial outcomes.