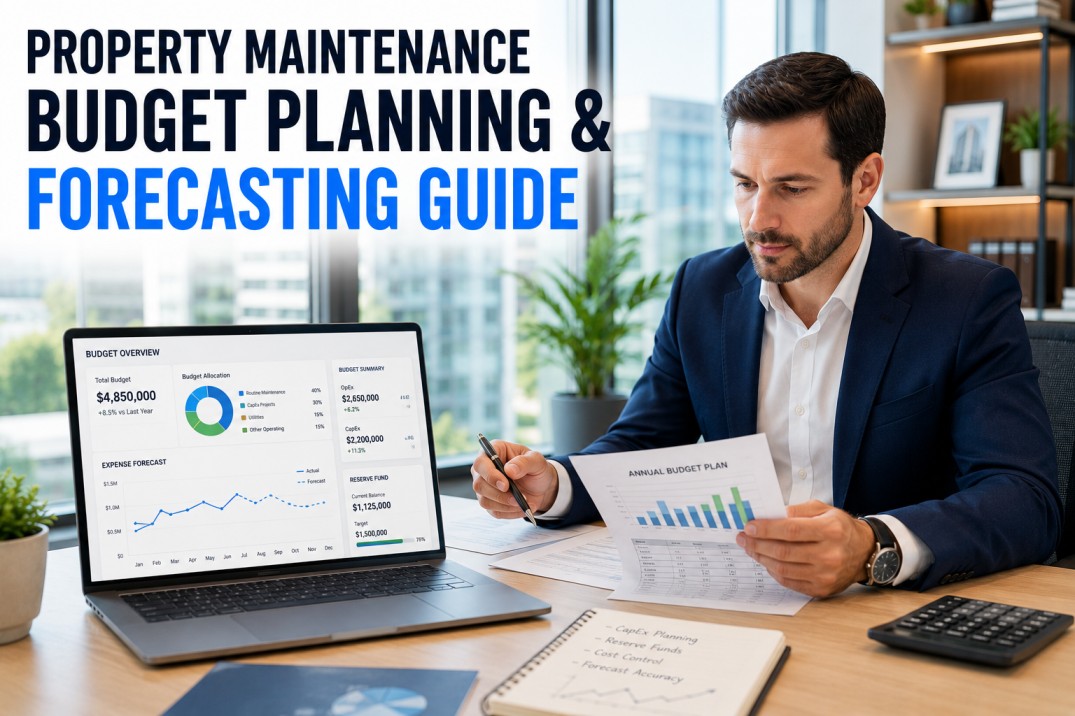
Property analytics budget planning and forecasting is the systematic process of estimating, allocating, and monitoring financial resources for building data infrastructure, analytics platform subscriptions, sensor networks, integration services, and analytics personnel across commercial real estate portfolios — a discipline that has become essential as 68% of property managers report that analytics technology spending is now their fastest-growing operational cost category with annual increases averaging 12-18%, yet fewer than 35% of properties have a structured budget planning process specifically for analytics tools and services separate from general IT or facilities maintenance budgets. Unlike traditional property operating expenses with predictable year-over-year patterns based on square footage and occupancy rates, analytics budgets face unique planning challenges including rapidly evolving technology platforms with changing pricing models, sensor hardware with 3-5 year replacement cycles that create lumpy capital expenditure requirements, data integration costs that scale non-linearly as additional building systems are connected, and analytics staffing needs that shift from implementation-phase consulting to ongoing managed services as programs mature. A comprehensive approach to property analytics budget planning addresses five critical dimensions: operating expenditure categories covering analytics platform subscriptions, data connectivity fees, cloud hosting and storage costs, third-party data licensing, and ongoing support and managed services contracts, capital expenditure planning for sensor hardware deployment, integration platform implementation, dashboard development projects, and infrastructure upgrades required to support analytics data pipelines, reserve fund allocation for technology refresh cycles, platform migration costs, data backup and disaster recovery infrastructure, and unplanned analytics needs arising from regulatory changes or tenant demands, forecasting methodology using historical spending patterns combined with portfolio growth projections, technology roadmap milestones, and vendor pricing escalation assumptions to produce multi-year budget estimates with confidence intervals, and variance analysis processes that compare actual spending against budget at monthly and quarterly intervals with investigation of significant deviations and corrective action planning to keep analytics spending aligned with property financial objectives. This article explores five analytics budget categories with typical cost ranges and allocation percentages, compares capital and operating expenditure approaches for common analytics investments, provides a 12-month rolling budget forecast framework with variance tracking columns, profiles four reserve fund categories with funding targets and replenishment schedules, and presents benchmark budget metrics for properties with mature analytics programs.
Build a Smarter Property Analytics Budget With Structured Planning
iFactory's platform includes budget planning templates, cost category tracking, CapEx and OpEx allocation tools, reserve fund management, forecast modeling with historical trend analysis, and automated variance reporting. Book a demo to see how structured budget planning optimizes analytics spending across your property portfolio.
Analytics Budget Categories — Cost Breakdown & Allocation
Property analytics budgets span five primary cost categories with distinct spending patterns, contract structures, and year-over-year growth characteristics. The category cards below profile each budget area with typical annual cost ranges for a mid-size commercial property, percentage of total analytics budget, and key factors that drive cost variability within each category.
CapEx vs OpEx Comparison — Analytics Investment Planning
Analytics investments fall into capital and operating expenditure categories with different budget treatment, approval processes, and financial reporting implications. The comparison cards below evaluate common analytics investments across five decision factors to help property managers determine the appropriate budget treatment for each spending category.
Optimize CapEx and OpEx Allocation for Analytics Investments
iFactory's platform provides CapEx vs OpEx classification guidance, budget category tracking, multi-year cost projection models, and investment approval workflow integration. Book a demo to see how structured financial planning optimizes analytics budget allocation across your property portfolio.
12-Month Rolling Budget Forecast — Actual vs Plan Tracking
A rolling 12-month budget forecast provides continuous visibility into analytics spending against plan, enabling early detection of variances and proactive corrective action before small deviations become significant budget overruns. The forecast table below displays a sample monthly budget tracking view with planned, actual, and variance columns across the five primary analytics budget categories for a mid-size commercial property.
| Category | Monthly Budget | Monthly Actual | Variance | YTD Budget | YTD Actual | YTD Variance |
|---|---|---|---|---|---|---|
| Platform Subscriptions | $2,800 | $2,800 | $0 | $33,600 | $33,600 | $0 |
| Hardware & Sensors | $1,200 | $1,450 | -$250 | $14,400 | $15,800 | -$1,400 |
| Data & Integration | $950 | $920 | $30 | $11,400 | $11,150 | $250 |
| Analytics Services | $1,500 | $1,800 | -$300 | $18,000 | $20,100 | -$2,100 |
| Training & Adoption | $450 | $380 | $70 | $5,400 | $4,900 | $500 |
| Total Analytics Budget | $6,900 | $7,350 | -$450 | $82,800 | $85,550 | -$2,750 |
Analytics Reserve Fund Planning — Capital Replacement & Contingency
An analytics reserve fund ensures financial resources are available for planned technology refresh cycles, unplanned equipment failures, platform migration costs, and emerging analytics needs without requiring special budget approval or diverting funds from other property operating categories. The reserve category cards below describe four reserve fund purposes with target funding levels, replenishment schedules, and typical draw scenarios.
Budget Performance Metrics — Benchmark Data for Analytics Programs
Properties with structured analytics budget planning processes achieve tighter budget adherence, lower cost overrun frequency, and higher return on analytics investment compared to properties without formal budget planning. The benchmark metrics below compare budget performance for properties with mature analytics financial planning against those with ad-hoc or reactive budget approaches.
Frequently Asked Questions About Property Analytics Budget Planning & Forecasting
What are the key categories in a property analytics budget?
A property analytics budget should include five primary categories that capture the full range of technology, data, and service costs required to operate an analytics program. Platform subscriptions represent the largest category at 30 to 35 percent of total budget, covering analytics software licensing, dashboard access, report generation capabilities, API access, and standard technical support, typically priced per square foot or per data source with annual increases of 5 to 10 percent baked into multi-year contracts. Hardware and sensors account for 20 to 25 percent of budget and include energy meters, occupancy sensors, environmental monitors, equipment telemetry devices, and the network gateways that connect them to the analytics platform, with 3 to 5 year replacement cycles creating lumpy capital expenditure patterns. Data and integration costs make up 15 to 18 percent of budget, covering cloud hosting fees, data storage, third-party data licensing for benchmarking, utility data acquisition, and ongoing integration maintenance for connections to building management systems, access control, and utility meters. Analytics services represent 18 to 22 percent of budget and include consulting support, data analysis, custom report development, and managed analytics services, with higher costs in early program years that stabilize as the program matures. Training and adoption programs account for 8 to 12 percent of budget, with highest spending in year one during system deployment and tenant onboarding, transitioning to lower ongoing costs for refresher training, new hire orientation, and user support as the platform becomes embedded in daily property operations.
How should property managers decide between CapEx and OpEx for analytics investments?
The decision between capitalizing or expensing analytics investments depends on the nature of the cost, its useful life, and the property's financial reporting policies. Capital expenditure treatment is appropriate for investments that provide benefit over multiple years including sensor network hardware depreciated over 5 to 7 years, analytics platform implementation costs including configuration and integration labor that are operational in nature but provide benefit over the platform's expected useful life, custom dashboard development projects with multi-year utility, and data pipeline infrastructure including gateways, servers, and networking equipment. Operating expenditure treatment is appropriate for recurring costs including platform subscription fees, cloud hosting based on monthly usage, data connectivity charges, sensor calibration and maintenance contracts, analytics consulting retainers, and training programs. Most property analytics programs use a hybrid approach where initial deployment costs including hardware, implementation, and integration are capitalized in the first year, while ongoing platform subscriptions, data fees, and support services are expensed as incurred. Property managers should consult with their accounting team to determine the appropriate capitalization threshold for their organization, typically $2,500 to $5,000 per item, and ensure consistent treatment across similar investment types. A well-structured CapEx and OpEx classification framework simplifies budget approval because capital investments often have different approval thresholds and funding sources than operating expenses, and accurate classification ensures proper financial reporting and cost allocation to tenants through operating expense reconciliations.
What forecasting methods work best for property analytics budget planning?
The most effective forecasting method for property analytics budgets combines bottom-up build forecasting for known commitments with trend-based projection for variable costs and scenario modeling for uncertain items. Bottom-up forecasting starts with all committed and contracted spending including platform subscription renewals with known escalation rates, sensor maintenance contracts, data service agreements, and any multi-year implementation or consulting engagements that have been signed. This build approach produces a highly accurate baseline forecast for the committed portion of the budget, typically 60 to 70 percent of total analytics spending. For the remaining variable cost categories including unplanned consulting, sensor replacements, and emerging analytics needs, trend-based projection using 12 to 24 months of historical spending data adjusted for portfolio growth rates, technology roadmap milestones, and vendor price escalation assumptions provides reasonable estimates with documented methodology. Scenario modeling should be applied to the most uncertain cost drivers including potential regulatory changes that could create new reporting requirements, tenant demand for new analytics services that may require additional data sources or platform capacity, and technology platform migration costs that depend on vendor product roadmap decisions. Best practice is to produce three forecast scenarios: a baseline forecast representing the most likely outcome based on current commitments and trends, a conservative forecast that assumes higher spending for new initiatives and regulatory requirements, and an optimistic forecast with cost containment through vendor consolidation and platform standardization. Each scenario should include confidence intervals and key assumptions so stakeholders understand the range of possible outcomes and the factors that would drive movement between scenarios throughout the budget year.
How should analytics reserve funds be structured and funded?
Analytics reserve funds should be structured as four separate sub-funds with distinct purposes, target funding levels, and replenishment schedules aligned with the expected timing and frequency of draws. The technology refresh reserve covers planned sensor replacement at the end of their 3 to 5 year useful life, platform migration costs when upgrading between major software versions, and reader and gateway upgrades, with a target fund size of $15,000 to $25,000 replenished over 36 months through monthly allocations. The contingency reserve provides immediate funding for critical sensor failures, data recovery after system outages, and emergency integration support, with a smaller target of $8,000 to $12,000 replenished over 12 months because draws are typically unplanned and may occur at any time. The regulatory reserve funds new compliance reporting requirements, certification audit costs, and data retention infrastructure expansion triggered by regulatory changes, with a $6,000 to $10,000 target replenished over 24 months. The growth reserve supports new building analytics onboarding, additional sensor deployment for portfolio expansion, and platform capacity upgrades, with a $10,000 to $15,000 target replenished over 36 months. Reserve funds should be held in a segregated account or budget line item that is not available for general operating expenses, with draws requiring documented justification referencing the specific reserve purpose and a replenishment plan for restoring the fund to its target level within the established timeframe. Properties with well-funded analytics reserve programs report 60 percent fewer emergency budget requests and significantly faster deployment of analytics capabilities in new buildings because funding is available without waiting for the next budget cycle.
How should property managers perform analytics budget variance analysis?
Analytics budget variance analysis should be performed monthly with a structured process that compares actual spending against budget across all five budget categories, identifies significant variances typically defined as greater than 10 percent or $500 for any single line item, investigates root causes for each significant variance, and determines whether corrective action is required or the variance reflects a legitimate change in circumstances that should be incorporated into the forecast. The analysis should separate controllable variances resulting from spending decisions or operational changes from uncontrollable variances driven by external factors such as vendor price increases, regulatory requirements, or tenant requests that were not anticipated in the original budget. Each variance should be documented with the specific amount, percentage, root cause category such as timing difference, scope change, pricing change, or error, responsible party, and any corrective action planned or taken. Variances that are expected to persist should trigger a forecast update that adjusts future period budgets to reflect the new spending trajectory, preventing the variance from compounding over multiple months. Quarterly deep-dive variance reviews should examine cumulative trends across the year, assess whether the analytics program is delivering expected value relative to spending, and identify opportunities for cost optimization such as consolidating redundant platform subscriptions, renegotiating vendor contracts at renewal, or retiring legacy sensors that are no longer providing actionable data. Properties that perform monthly variance analysis with documented root cause investigation report average budget variances of 3.2 percent compared to 8.7 percent for properties that review budgets quarterly or only annually, with the most significant improvements occurring in the hardware and services categories where spending is most variable.
Take Control of Your Property Analytics Budget With Structured Planning
iFactory's platform provides budget category planning, CapEx and OpEx classification guidance, 12-month rolling forecast tracking with variance analysis, reserve fund management with automated replenishment scheduling, and portfolio-wide analytics cost benchmarking. Book a demo to see how structured budget planning and forecasting optimizes analytics spending and drives financial accountability.


.png)